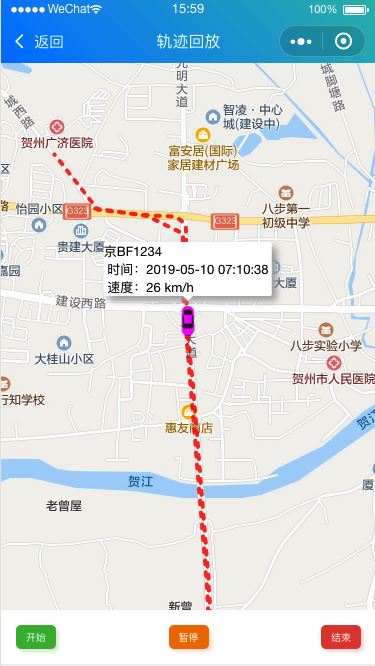
在微信小程序实现轨迹回放的效果 1、wxml map id="map" longitude="{{longitude}}" latitude="{{latitude}}" scale="16" bindcontroltap="controltap" bindmarkertap="markertap" markers="{{markers}}" polyline="{{polyline}}" bindregionc
在微信小程序实现轨迹回放的效果
1、wxml
<map id="map" longitude="{{longitude}}" latitude="{{latitude}}" scale="16"
 bindcontroltap="controltap" bindmarkertap="markertap" markers="{{markers}}" polyline="{{polyline}}"
 bindregionchange="regionchange" show-location style="width: 100%; height:{{height}}px;" ></map>

 <view class="padding flex flex-wrap justify-between align-center bg-white">
  <button class='cu-btn bg-green shadow sm' bindtap='beginTrack'> 开始 </button>
  <button class='cu-btn bg-orange shadow sm' bindtap='pauseTrack'> 暂停 </button>
  <button class='cu-btn bg-red shadow sm' bindtap='endTrack'> 结束 </button>
 </view>
2、js
//index.js
//获取应用实例
const app = getApp()

Page({
 data: {
  StatusBar: app.globalData.StatusBar,
  CustomBar: app.globalData.CustomBar,
  height: wx.getSystemInfoSync().windowHeight,
  latitude: 0,
  longitude: 0,
  playIndex: 0,
  timer: null,
  markers: [],
  polyline: [],
  pointsInfo:[]
 },
 regionchange(e) {
  //console.log(e.type)
 },
 markertap(e) {
  //console.log(e.markerId)
 },
 controltap(e) {
  //console.log(e.controlId)
 },
 beginTrack:function(e){

 },
 onLoad: function (options){
  var that = this;
  wx.request({
   url: 'http://**/getTrack',
   data: {
    beginTime:"开始时间",
    endTime:"结束时间"
   },
   method: "post",
   success: function (res) {
    that.setData({
     pointsInfo:res.data.pointsInfos,
     polyline: [{
      points: res.data.points,
      color: "#FF0000DD",
      width: 4,
      dottedLine: true
     }],
     markers: [{
      iconPath: '../../img/location.jpg',
      id: 0,
      latitude: res.data.points[0].latitude,
      longitude: res.data.points[0].longitude,
      width: 30,
      height: 30,
      title: that.data.brandNumber,
      callout: {
       content: that.data.brandNumber + ' \n 时间:' + res.data.pointsInfos[0].create_time + ' \n 速度:' + res.data.pointsInfos[0].speed + ' km/h',
       color: "#000000",
       fontSize: 13,
       borderRadius: 2,
       bgColor: "#fff",
       display: "ALWAYS",
       boxShadow: "5px 5px 10px #aaa"
      }
     }],
     latitude: res.data.points[0].latitude,
     longitude: res.data.points[0].longitude,
    })
   }
  })
 },
 /**
  * 开始
  */
 beginTrack:function(){
  var that = this;
  var i = that.data.playIndex == 0 ? 0 : that.data.playIndex;
  that.timer = setInterval(function () {
   i ++
   that.setData({
    playIndex: i,
    latitude: that.data.polyline[0].points[i].latitude,
    longitude: that.data.polyline[0].points[i].longitude,
    markers: [{
     iconPath: '../../img/car/e0.png',
     id: 0,
     latitude: that.data.polyline[0].points[i].latitude,
     longitude: that.data.polyline[0].points[i].longitude,
     width: 30,
     height: 30,
     title: that.data.brandNumber,
     callout: {
      content: that.data.brandNumber + ' \n 时间:' + that.data.pointsInfo[i].create_time + ' \n 速度:' + that.data.pointsInfo[i].speed + ' km/h',
      color: "#000000",
      fontSize: 13,
      borderRadius: 2,
      bgColor: "#fff",
      display: "ALWAYS",
      boxShadow: "5px 5px 10px #aaa"
     }
    }]
   })
   if ((i+1) >= that.data.polyline[0].points.length) {
    that.endTrack();
   }
  }, 500)
 },
 /**
  * 暂停
  */
 pauseTrack:function(){
  var that = this;
  clearInterval(this.timer)
 },
 /**
  * 结束
  */
 endTrack:function(){
  var that = this;
  that.setData({
   playIndex: 0,
   latitude: that.data.polyline[0].points[0].latitude,
   longitude: that.data.polyline[0].points[0].longitude,
   markers: [{
    iconPath: '../../img/car/e0.png',
    id: 0,
    latitude: that.data.polyline[0].points[0].latitude,
    longitude: that.data.polyline[0].points[0].longitude,
    width: 30,
    height: 30,
    title: that.data.brandNumber,
    callout: {
     content: that.data.brandNumber + ' \n 时间:' + that.data.pointsInfo[0].create_time + ' \n 速度:' + that.data.pointsInfo[0].speed + ' km/h',
     color: "#000000",
     fontSize: 13,
     borderRadius: 2,
     bgColor: "#fff",
     display: "ALWAYS",
     boxShadow: "5px 5px 10px #aaa"
    }
   }]
  })
  clearInterval(this.timer)
 }
})
后台数据使用的是百度鹰眼的数据。最终效果:

以上就是本文的全部内容,希望对大家的学习有所帮助,也希望大家多多支持易盾网络。
