Rosenbrock函数的定义如下: 其函数图像如下: 我分别使用梯度下降法和牛顿法做了寻找Rosenbrock函数的实验。 梯度下降 梯度下降的更新公式: 图中蓝色的点为起点,橙色的曲线(实际上
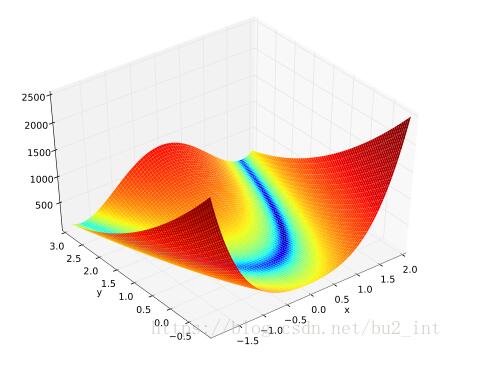
Rosenbrock函数的定义如下:

其函数图像如下:

我分别使用梯度下降法和牛顿法做了寻找Rosenbrock函数的实验。
梯度下降
梯度下降的更新公式:


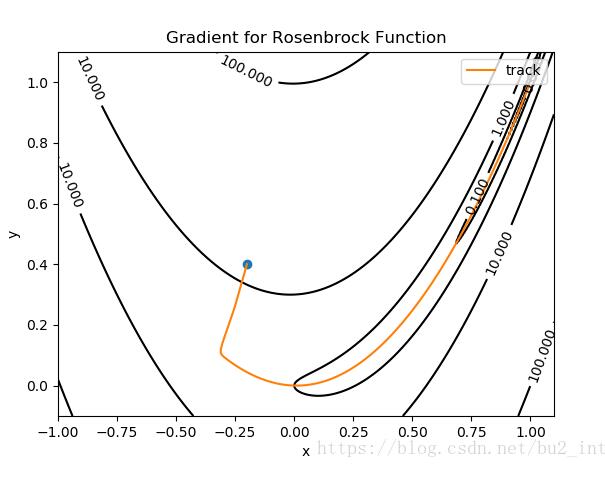
图中蓝色的点为起点,橙色的曲线(实际上是折线)是寻找最小值点的轨迹,终点(最小值点)为 (1,1)(1,1)。
梯度下降用了约5000次才找到最小值点。
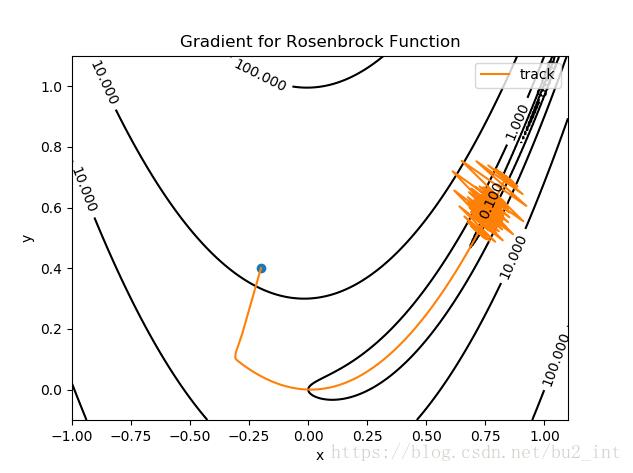
我选择的迭代步长 α=0.002α=0.002,αα 没有办法取的太大,当为0.003时就会发生振荡:

牛顿法
牛顿法的更新公式:

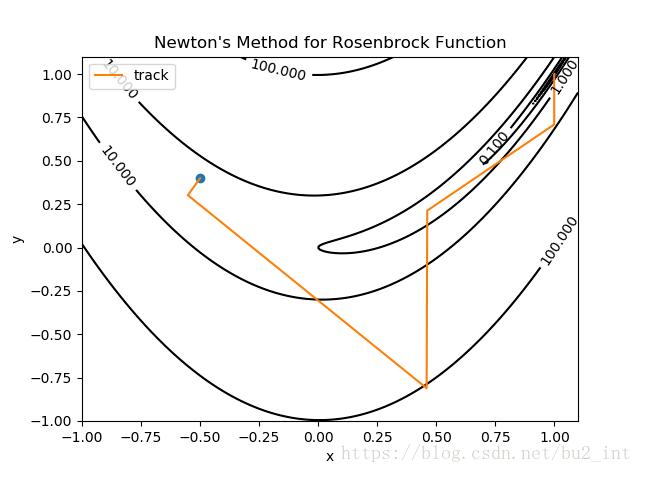
Hessian矩阵中的每一个二阶偏导我是用手算算出来的。

牛顿法只迭代了约5次就找到了函数的最小值点。
下面贴出两个实验的代码。
梯度下降:
import numpy as np
import matplotlib.pyplot as plt
from matplotlib import ticker


def f(x, y):
 return (1 - x) ** 2 + 100 * (y - x * x) ** 2


def H(x, y):
 return np.matrix([[1200 * x * x - 400 * y + 2, -400 * x],
      [-400 * x, 200]])


def grad(x, y):
 return np.matrix([[2 * x - 2 + 400 * x * (x * x - y)],
      [200 * (y - x * x)]])


def delta_grad(x, y):
 g = grad(x, y)

 alpha = 0.002
 delta = alpha * g
 return delta


# ----- 绘制等高线 -----
# 数据数目
n = 256
# 定义x, y
x = np.linspace(-1, 1.1, n)
y = np.linspace(-0.1, 1.1, n)

# 生成网格数据
X, Y = np.meshgrid(x, y)

plt.figure()
# 填充等高线的颜色, 8是等高线分为几部分
plt.contourf(X, Y, f(X, Y), 5, alpha=0, cmap=plt.cm.hot)
# 绘制等高线
C = plt.contour(X, Y, f(X, Y), 8, locator=ticker.LogLocator(), colors='black', linewidth=0.01)
# 绘制等高线数据
plt.clabel(C, inline=True, fontsize=10)
# ---------------------

x = np.matrix([[-0.2],
    [0.4]])

tol = 0.00001
xv = [x[0, 0]]
yv = [x[1, 0]]

plt.plot(x[0, 0], x[1, 0], marker='o')

for t in range(6000):
 delta = delta_grad(x[0, 0], x[1, 0])
 if abs(delta[0, 0]) < tol and abs(delta[1, 0]) < tol:
  break
 x = x - delta
 xv.append(x[0, 0])
 yv.append(x[1, 0])

plt.plot(xv, yv, label='track')
# plt.plot(xv, yv, label='track', marker='o')
plt.xlabel('x')
plt.ylabel('y')
plt.title('Gradient for Rosenbrock Function')
plt.legend()
plt.show()
牛顿法:
import numpy as np
import matplotlib.pyplot as plt
from matplotlib import ticker


def f(x, y):
 return (1 - x) ** 2 + 100 * (y - x * x) ** 2


def H(x, y):
 return np.matrix([[1200 * x * x - 400 * y + 2, -400 * x],
      [-400 * x, 200]])


def grad(x, y):
 return np.matrix([[2 * x - 2 + 400 * x * (x * x - y)],
      [200 * (y - x * x)]])


def delta_newton(x, y):
 alpha = 1.0
 delta = alpha * H(x, y).I * grad(x, y)
 return delta


# ----- 绘制等高线 -----
# 数据数目
n = 256
# 定义x, y
x = np.linspace(-1, 1.1, n)
y = np.linspace(-1, 1.1, n)

# 生成网格数据
X, Y = np.meshgrid(x, y)

plt.figure()
# 填充等高线的颜色, 8是等高线分为几部分
plt.contourf(X, Y, f(X, Y), 5, alpha=0, cmap=plt.cm.hot)
# 绘制等高线
C = plt.contour(X, Y, f(X, Y), 8, locator=ticker.LogLocator(), colors='black', linewidth=0.01)
# 绘制等高线数据
plt.clabel(C, inline=True, fontsize=10)
# ---------------------

x = np.matrix([[-0.3],
    [0.4]])

tol = 0.00001
xv = [x[0, 0]]
yv = [x[1, 0]]

plt.plot(x[0, 0], x[1, 0], marker='o')

for t in range(100):
 delta = delta_newton(x[0, 0], x[1, 0])
 if abs(delta[0, 0]) < tol and abs(delta[1, 0]) < tol:
  break
 x = x - delta
 xv.append(x[0, 0])
 yv.append(x[1, 0])

plt.plot(xv, yv, label='track')
# plt.plot(xv, yv, label='track', marker='o')
plt.xlabel('x')
plt.ylabel('y')
plt.title('Newton\'s Method for Rosenbrock Function')
plt.legend()
plt.show()
以上这篇python使用梯度下降和牛顿法寻找Rosenbrock函数最小值实例就是小编分享给大家的全部内容了,希望能给大家一个参考,也希望大家多多支持易盾网络。
