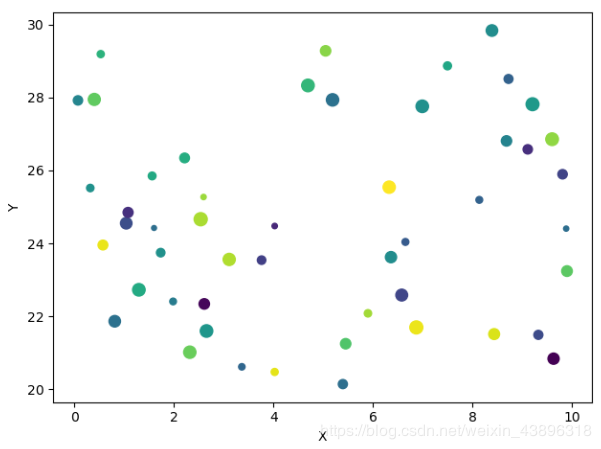
要点说明 在绘制散点图的时候,通常使用变量作为输入数据的载体。 其实,也可以使用字符串作为输入数据的存储载体。 下面代码的data = {“a”: x, “b”: y, “color”: c, “size”: s}正
要点说明
在绘制散点图的时候,通常使用变量作为输入数据的载体。
其实,也可以使用字符串作为输入数据的存储载体。
下面代码的data = {“a”: x, “b”: y, “color”: c, “size”: s}正是将散点图的输入数据、颜色和标记大小放在数据字典data中作为键值对,对应的key是字符串string。
Matplotlib编程实现
import matplotlib.pyplot as plt
import numpy as np

fig = plt.figure()
ax = fig.gca()

x = np.random.rand(50)*10
y = np.random.rand(50)*10+20
s = np.random.rand(50)*100
c = np.random.rand(50)

data = {"a": x, "b": y, "color": c, "size": s}

ax.scatter("a", "b", c="color", s="size", data=data)

ax.set(xlabel="X", ylabel="Y")

plt.show()
成品图

以上就是本文的全部内容,希望对大家的学习有所帮助,也希望大家多多支持易盾网络。
