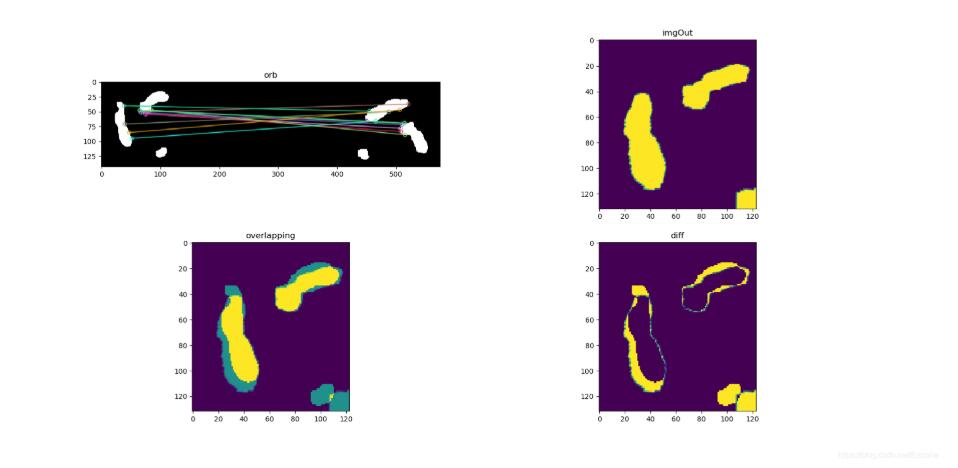
本文实例为大家分享了python opencv实现图像配准与比较的具体代码,供大家参考,具体内容如下 代码 from skimage import ioimport cv2 as cvimport numpy as npimport matplotlib.pyplot as plt img_path1 = '2_HE_ma
本文实例为大家分享了python opencv实现图像配准与比较的具体代码,供大家参考,具体内容如下
代码
from skimage import io
import cv2 as cv
import numpy as np
import matplotlib.pyplot as plt

img_path1 = '2_HE_maxarea.png'
img_path2 = '2_IHC_maxarea.png'

img1 = io.imread(img_path1)
img2 = io.imread(img_path2)
img1 = np.uint8(img1)
img2 = np.uint8(img2)

# find the keypoints and descriptors with ORB
orb = cv.ORB_create()
kp1, des1 = orb.detectAndCompute(img1,None)
kp2, des2 = orb.detectAndCompute(img2,None)

# def get_good_match(des1,des2):
#  bf = cv.BFMatcher()
#  matches = bf.knnMatch(des1, des2, k=2)
#  good = []
#  for m, n in matches:
#   if m.distance < 0.75 * n.distance:
#    good.append(m)
#  return good,matches
# goodMatch,matches = get_good_match(des1,des2)
# img3 = cv.drawMatchesKnn(img1,kp1,img2,kp2,matches[:20],None,flags=2)

# create BFMatcher object
bf = cv.BFMatcher(cv.NORM_HAMMING, crossCheck=True)
# Match descriptors.
matches = bf.match(des1,des2)
# Sort them in the order of their distance.
matches = sorted(matches, key = lambda x:x.distance)
# Draw first 20 matches.
img3 = cv.drawMatches(img1,kp1,img2,kp2,matches[:20],None, flags=2)


goodMatch = matches[:20]
if len(goodMatch) > 4:
 ptsA= np.float32([kp1[m.queryIdx].pt for m in goodMatch]).reshape(-1, 1, 2)
 ptsB = np.float32([kp2[m.trainIdx].pt for m in goodMatch]).reshape(-1, 1, 2)
 ransacReprojThreshold = 4
 H, status =cv.findHomography(ptsA,ptsB,cv.RANSAC,ransacReprojThreshold);
 #其中H为求得的单应性矩阵矩阵
 #status则返回一个列表来表征匹配成功的特征点。
 #ptsA,ptsB为关键点
 #cv2.RANSAC, ransacReprojThreshold这两个参数与RANSAC有关
 imgOut = cv.warpPerspective(img2, H, (img1.shape[1],img1.shape[0]),flags=cv.INTER_LINEAR + cv.WARP_INVERSE_MAP)

# 叠加配准变换图与基准图
rate = 0.5
overlapping = cv.addWeighted(img1, rate, imgOut, 1-rate, 0)
io.imsave('HE_2_IHC.png', overlapping)
err = cv.absdiff(img1,imgOut)

# 显示对比
plt.subplot(221)
plt.title('orb')
plt.imshow(img3)

plt.subplot(222)
plt.title('imgOut')
plt.imshow(imgOut)

plt.subplot(223)
plt.title('overlapping')
plt.imshow(overlapping)

plt.subplot(224)
plt.title('diff')
plt.imshow(err)

plt.show()
结果:


以上就是本文的全部内容,希望对大家的学习有所帮助,也希望大家多多支持易盾网络。
