目录 使用技术点 使用工具 导入第三方库 大家好,我是辣条。 曾经有一个真挚的机会,摆在我面前,但是我没有珍惜,等到失去的时候才后悔莫及,尘世间最痛苦的事莫过于此,如果
目录
大家好,我是辣条。
曾经有一个真挚的机会,摆在我面前,但是我没有珍惜,等到失去的时候才后悔莫及,尘世间最痛苦的事莫过于此,如果老天可以再给我一个再来一次机会的话,我会买下那个比特币,哪怕付出所有零花钱,如果非要在这个机会加上一个期限的话,我希望是十年前。
看着这份台词是不是很眼熟,我稍稍改了一下,曾经差一点点点就购买比特币了,肠子都悔青了现在,今天对比特币做一个简单的数据分析。
# 安装对应的第三方库
!pip install pandas
!pip install numpy
!pip install seaborn
!pip install matplotlib
!pip install sklearn
!pip install tensorflow
使用技术点
1. 数据处理 - pandas
2. 科学运算 - numpy
3. 数据可视化 - seaborn matplotlib
使用工具
1. anaconda
2. notebook
3. python3.7版本
导入第三方库
#a|T + enter  notebook运行方式
import pandas as pd # 数据处理
import numpy as np # 科学运算
import seaborn as sns # 数据可视化
import matplotlib.pyplot as plt # 数据可视化
import warnings
import warnings
warnings.filterwarnings('ignore')
如遇到导包报错 可以看看是不是自己的第三方库的版本问题
# 设置图表与 线格式
plt.rcParams['figure.figsize'] = (10, 10)
plt.rcParams['lines.linewidth'] = 2
plt.style.use('ggplot')
# 读取数据集
df = pd.read_csv('./DOGE-USD.csv')
df.head() # 查看前5行
|
Date |
Open |
High |
Low |
Close |
Adj Close |
Volume |
| 0 |
2014-09-17 |
0.000293 |
0.000299 |
0.000260 |
0.000268 |
0.000268 |
1463600.0 |
| 1 |
2014-09-18 |
0.000268 |
0.000325 |
0.000267 |
0.000298 |
0.000298 |
2215910.0 |
| 2 |
2014-09-19 |
0.000298 |
0.000307 |
0.000275 |
0.000277 |
0.000277 |
883563.0 |
| 3 |
2014-09-20 |
0.000276 |
0.000310 |
0.000267 |
0.000292 |
0.000292 |
993004.0 |
| 4 |
2014-09-21 |
0.000293 |
0.000299 |
0.000284 |
0.000288 |
0.000288 |
539140.0 |
df.isnull().sum() # 统计缺失值的总和(sum())
Date         0
Open         5
High         5
Low          5
Close        5
Adj Close    5
Volume       5
dtype: int64
df.duplicated().sum() # 查看重复值
0
# 数据类型 分布基本情况
df.info()
<class 'pandas.core.frame.DataFrame'>
RangeIndex: 2591 entries, 0 to 2590
Data columns (total 7 columns):
 #   Column     Non-Null Count  Dtype
---  ------     --------------  -----
 0   Date       2591 non-null   object
 1   Open       2586 non-null   float64
 2   High       2586 non-null   float64
 3   Low        2586 non-null   float64
 4   Close      2586 non-null   float64
 5   Adj Close  2586 non-null   float64
 6   Volume     2586 non-null   float64
dtypes: float64(6), object(1)
memory usage: 141.8+ KB
# 转换 Date的类型
df['Date'] = pd.to_datetime(df.Date, dayfirst=True)
# 索引重置 让Date时间格式成为 索引  inplace新建对象
df.set_index('Date', inplace=True)
df
|
Open |
High |
Low |
Close |
Adj Close |
Volume |
| Date |
|
|
|
|
|
|
| 2014-09-17 |
0.000293 |
0.000299 |
0.000260 |
0.000268 |
0.000268 |
1.463600e+06 |
| 2014-09-18 |
0.000268 |
0.000325 |
0.000267 |
0.000298 |
0.000298 |
2.215910e+06 |
| 2014-09-19 |
0.000298 |
0.000307 |
0.000275 |
0.000277 |
0.000277 |
8.835630e+05 |
| 2014-09-20 |
0.000276 |
0.000310 |
0.000267 |
0.000292 |
0.000292 |
9.930040e+05 |
| 2014-09-21 |
0.000293 |
0.000299 |
0.000284 |
0.000288 |
0.000288 |
5.391400e+05 |
| ... |
... |
... |
... |
... |
... |
... |
| 2021-10-16 |
0.233881 |
0.244447 |
0.233683 |
0.237292 |
0.237292 |
1.541851e+09 |
| 2021-10-17 |
0.237193 |
0.241973 |
0.226380 |
0.237898 |
0.237898 |
1.397143e+09 |
| 2021-10-18 |
0.237806 |
0.271394 |
0.237488 |
0.247281 |
0.247281 |
5.003366e+09 |
| 2021-10-19 |
NaN |
NaN |
NaN |
NaN |
NaN |
NaN |
| 2021-10-20 |
0.245199 |
0.246838 |
0.242384 |
0.246078 |
0.246078 |
1.187871e+09 |
2591 rows × 6 columns
df = df.asfreq('d') # 按照天数采集数据
df = df.fillna(method='bfill') # 缺失值填充 下一条数据填充
df
|
Open |
High |
Low |
Close |
Adj Close |
Volume |
| Date |
|
|
|
|
|
|
| 2014-09-17 |
0.000293 |
0.000299 |
0.000260 |
0.000268 |
0.000268 |
1.463600e+06 |
| 2014-09-18 |
0.000268 |
0.000325 |
0.000267 |
0.000298 |
0.000298 |
2.215910e+06 |
| 2014-09-19 |
0.000298 |
0.000307 |
0.000275 |
0.000277 |
0.000277 |
8.835630e+05 |
| 2014-09-20 |
0.000276 |
0.000310 |
0.000267 |
0.000292 |
0.000292 |
9.930040e+05 |
| 2014-09-21 |
0.000293 |
0.000299 |
0.000284 |
0.000288 |
0.000288 |
5.391400e+05 |
| ... |
... |
... |
... |
... |
... |
... |
| 2021-10-16 |
0.233881 |
0.244447 |
0.233683 |
0.237292 |
0.237292 |
1.541851e+09 |
| 2021-10-17 |
0.237193 |
0.241973 |
0.226380 |
0.237898 |
0.237898 |
1.397143e+09 |
| 2021-10-18 |
0.237806 |
0.271394 |
0.237488 |
0.247281 |
0.247281 |
5.003366e+09 |
| 2021-10-19 |
0.245199 |
0.246838 |
0.242384 |
0.246078 |
0.246078 |
1.187871e+09 |
| 2021-10-20 |
0.245199 |
0.246838 |
0.242384 |
0.246078 |
0.246078 |
1.187871e+09 |
2591 rows × 6 columns
In [14]:
# 开盘价的分布情况
df['Open'].plot(figsize=(12, 8))
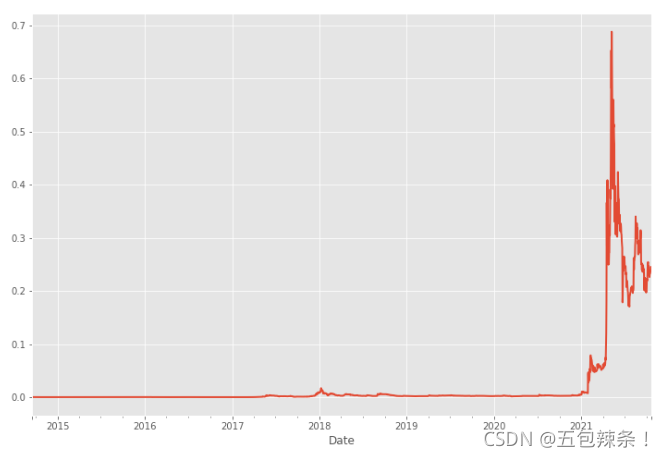
结论:从上图可以看出 BTB是在2021年份开始爆发式的增长 在2015 到 2021 一直都是没有较大波动
# 成交情况
df['Volume'].plot(figsize=(12, 8))

# 投资价值
df['Total Pos'] = df.sum(axis=1)
df['Total Pos'].plot(figsize=(10, 8))
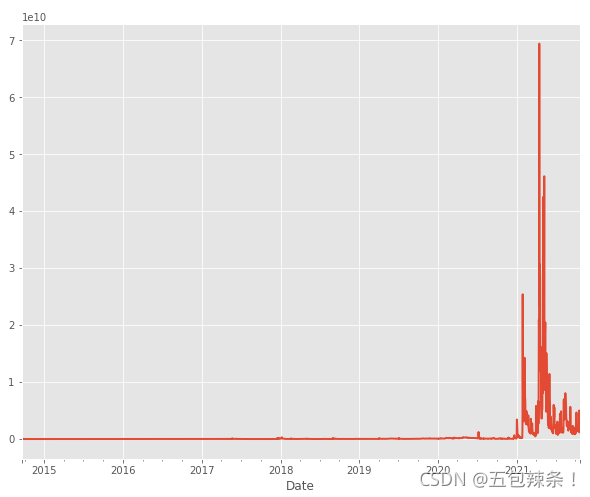
结论:开盘价高 投资价值搞 比较合适做卖出操作 实现一夜暴富(开玩笑的)
# 当前元素与先前元素的相差百分比
df['Daily Reture'] = df['Total Pos'].pct_change(1)
# 日收益率的平均
df['Daily Reture'].mean()
df['Daily Reture'].plot(kind='kde')

SR = df['Daily Reture'].mean() / df['Daily Reture'].std()
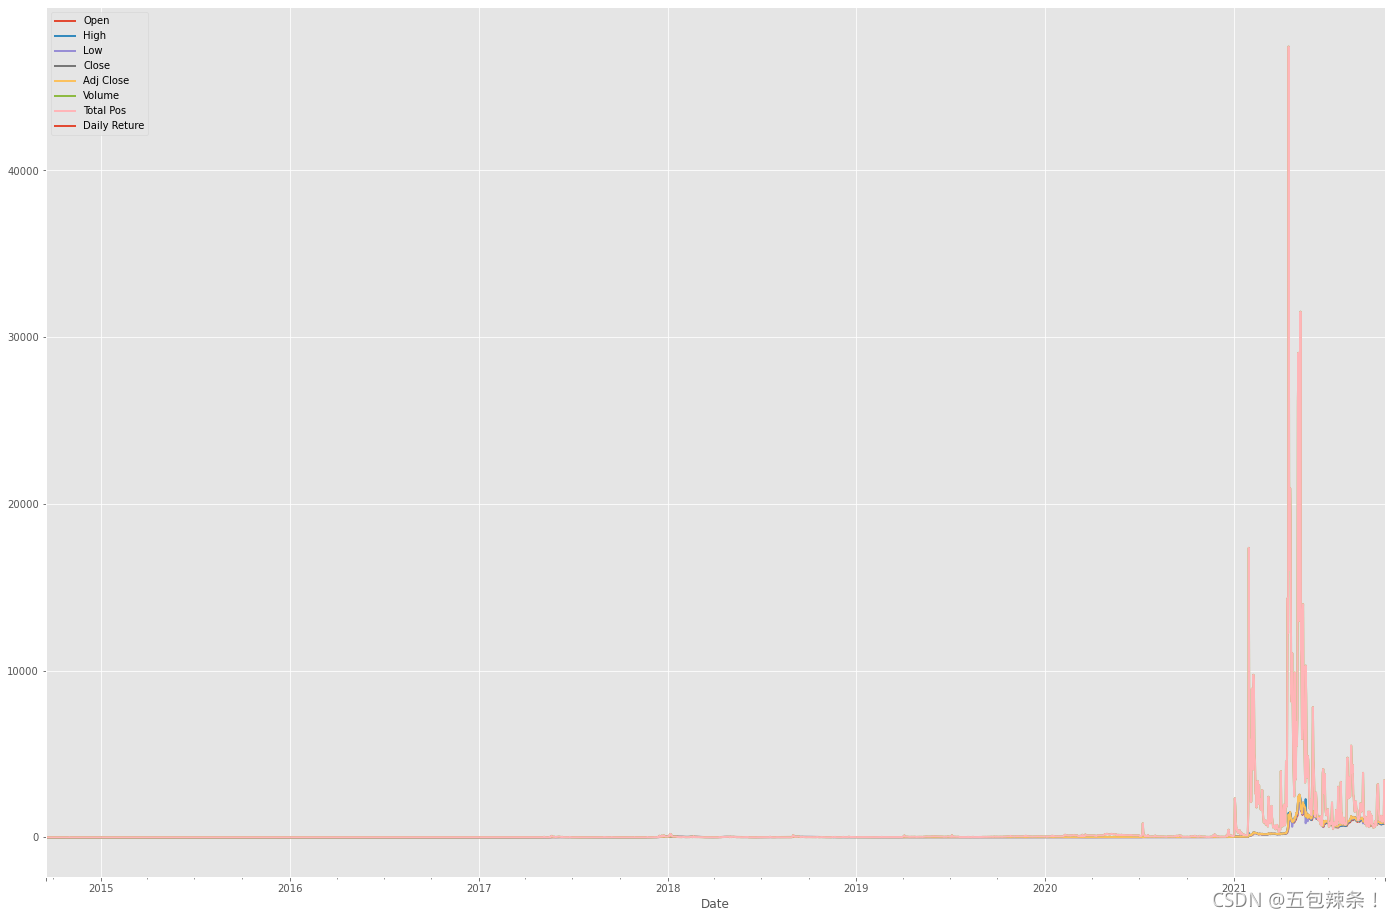
all_plot = df/df.iloc[0]
all_plot.plot(figsize=(24, 16))
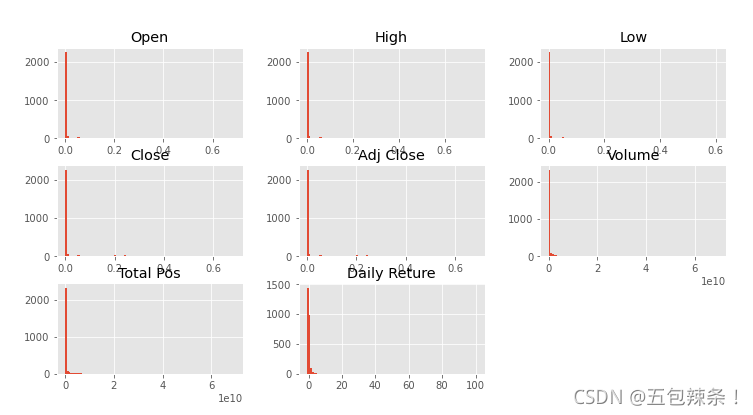
df.hist(bins=100, figsize=(12, 6))
# 按照年份进行采样
df.resample(rule='A').mean()
|
Open |
High |
Low |
Close |
Adj Close |
Volume |
Total Pos |
Daily Reture |
| Date |
|
|
|
|
|
|
|
|
| 2014-12-31 |
0.000249 |
0.000259 |
0.000240 |
0.000248 |
0.000248 |
8.059213e+05 |
8.059213e+05 |
1.028630 |
| 2015-12-31 |
0.000143 |
0.000147 |
0.000139 |
0.000143 |
0.000143 |
1.685476e+05 |
1.685476e+05 |
0.139461 |
| 2016-12-31 |
0.000235 |
0.000242 |
0.000229 |
0.000235 |
0.000235 |
2.564834e+05 |
2.564834e+05 |
0.259038 |
| 2017-12-31 |
0.001576 |
0.001708 |
0.001468 |
0.001601 |
0.001601 |
1.118996e+07 |
1.118996e+07 |
0.225833 |
| 2018-12-31 |
0.004368 |
0.004577 |
0.004125 |
0.004350 |
0.004350 |
2.172325e+07 |
2.172325e+07 |
0.109586 |
| 2019-12-31 |
0.002564 |
0.002631 |
0.002499 |
0.002563 |
0.002563 |
4.463969e+07 |
4.463969e+07 |
0.027981 |
| 2020-12-31 |
0.002736 |
0.002822 |
0.002660 |
0.002744 |
0.002744 |
1.290465e+08 |
1.290465e+08 |
0.052314 |
| 2021-12-31 |
0.200410 |
0.215775 |
0.185770 |
0.201272 |
0.201272 |
4.620961e+09 |
4.620961e+09 |
0.260782 |
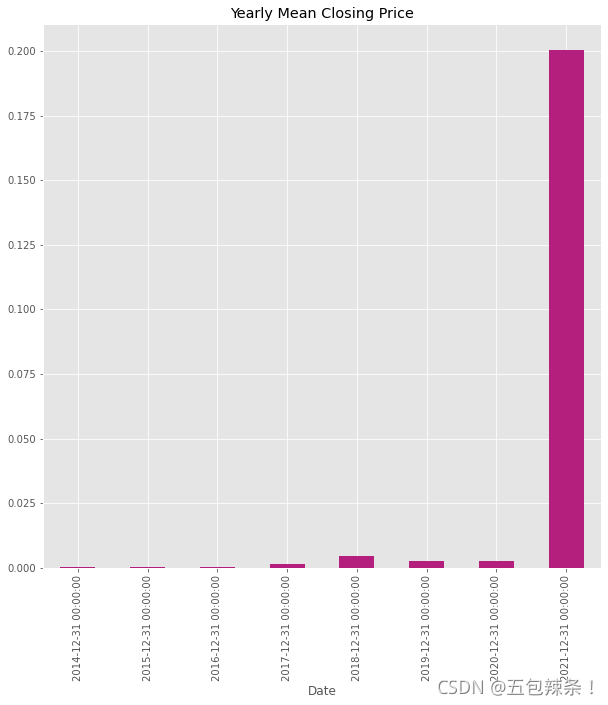
# 年平均收盘价
df['Open'].resample('A').mean().plot.bar(title='Yearly Mean Closing Price', color=['#b41f7d'])
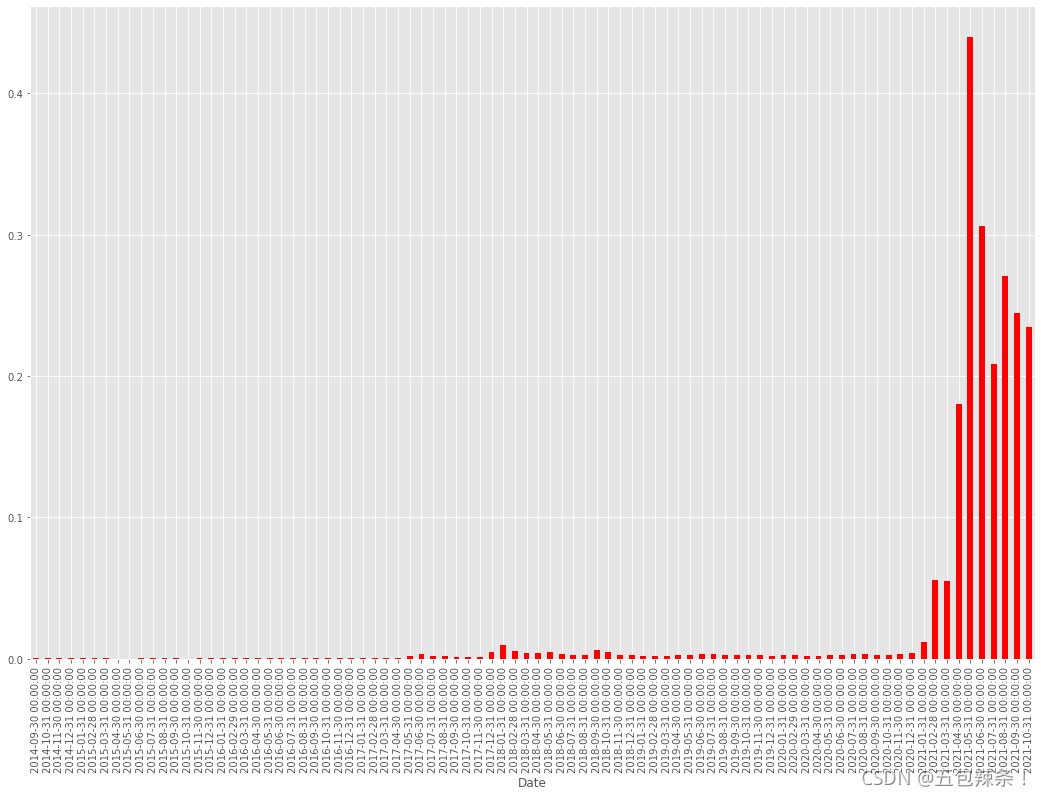
# 月度
df['Open'].resample('M').mean().plot.bar(figsize=(18, 12), color='red')
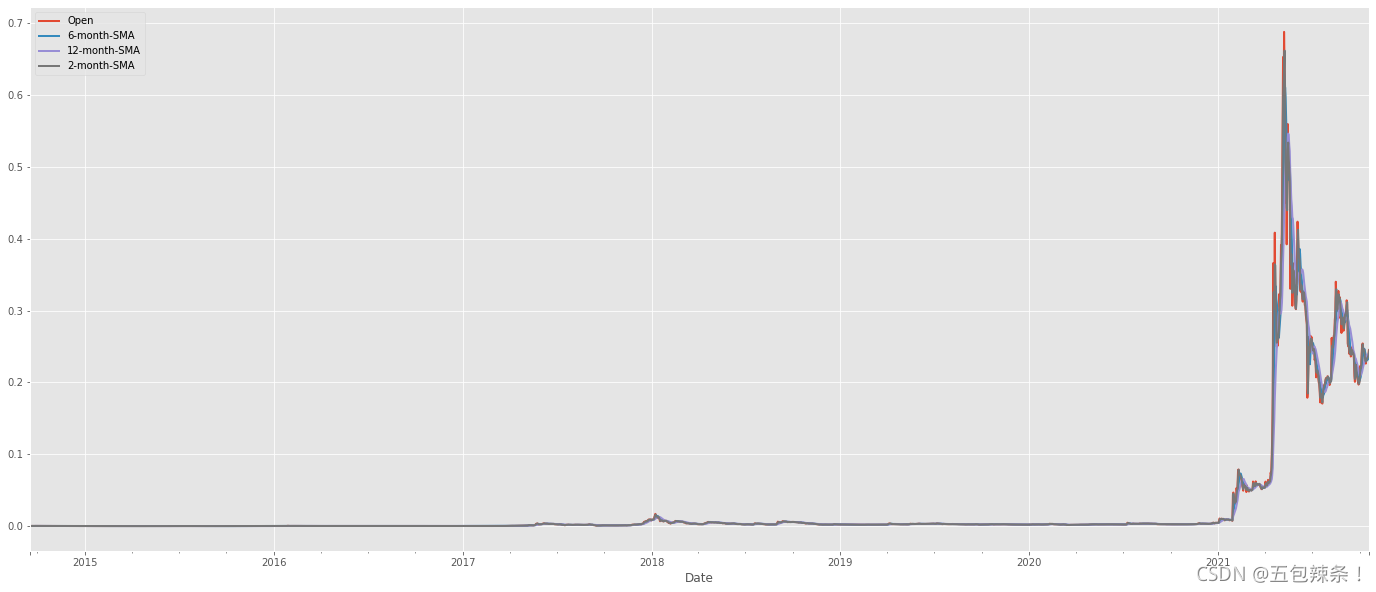
# 分别获取对应时间窗口  6 12 2 均值
df['6-month-SMA'] = df['Open'].rolling(window=6).mean()
df['12-month-SMA'] = df['Open'].rolling(window=12).mean()
df['2-month-SMA'] = df['Open'].rolling(window=2).mean()
df.head(10)
|
Open |
High |
Low |
Close |
Adj Close |
Volume |
Total Pos |
Daily Reture |
6-month-SMA |
12-month-SMA |
2-month-SMA |
| Date |
|
|
|
|
|
|
|
|
|
|
|
| 2014-09-17 |
0.000293 |
0.000299 |
0.000260 |
0.000268 |
0.000268 |
1463600.0 |
1.463600e+06 |
NaN |
NaN |
NaN |
NaN |
| 2014-09-18 |
0.000268 |
0.000325 |
0.000267 |
0.000298 |
0.000298 |
2215910.0 |
2.215910e+06 |
0.514013 |
NaN |
NaN |
0.000281 |
| 2014-09-19 |
0.000298 |
0.000307 |
0.000275 |
0.000277 |
0.000277 |
883563.0 |
8.835630e+05 |
-0.601264 |
NaN |
NaN |
0.000283 |
| 2014-09-20 |
0.000276 |
0.000310 |
0.000267 |
0.000292 |
0.000292 |
993004.0 |
9.930040e+05 |
0.123863 |
NaN |
NaN |
0.000287 |
| 2014-09-21 |
0.000293 |
0.000299 |
0.000284 |
0.000288 |
0.000288 |
539140.0 |
5.391400e+05 |
-0.457062 |
NaN |
NaN |
0.000285 |
| 2014-09-22 |
0.000288 |
0.000301 |
0.000285 |
0.000298 |
0.000298 |
620222.0 |
6.202220e+05 |
0.150391 |
0.000286 |
NaN |
0.000291 |
| 2014-09-23 |
0.000298 |
0.000318 |
0.000295 |
0.000313 |
0.000313 |
739197.0 |
7.391970e+05 |
0.191826 |
0.000287 |
NaN |
0.000293 |
| 2014-09-24 |
0.000314 |
0.000353 |
0.000310 |
0.000348 |
0.000348 |
1277840.0 |
1.277840e+06 |
0.728687 |
0.000295 |
NaN |
0.000306 |
| 2014-09-25 |
0.000347 |
0.000383 |
0.000332 |
0.000375 |
0.000375 |
2393610.0 |
2.393610e+06 |
0.873169 |
0.000303 |
NaN |
0.000331 |
| 2014-09-26 |
0.000374 |
0.000467 |
0.000373 |
0.000451 |
0.000451 |
4722610.0 |
4.722610e+06 |
0.973007 |
0.000319 |
NaN |
0.000361 |
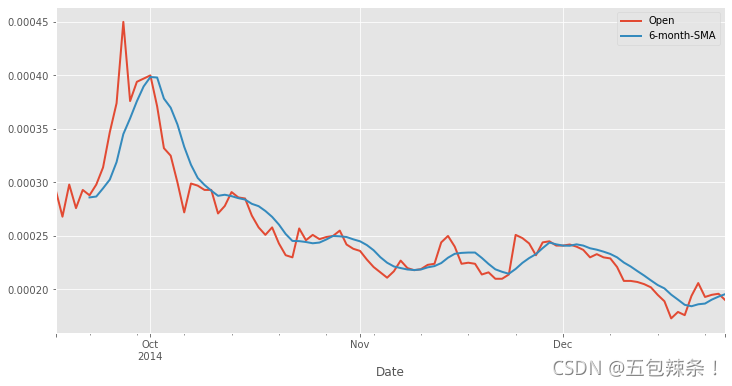
进行可视化 查看对应分布情况
df[['Open', '6-month-SMA', '12-month-SMA', '2-month-SMA']].plot(figsize=(24, 10))
df[["Open","6-month-SMA"]].plot(figsize=(18,10))

df[['Open','6-month-SMA']].iloc[:100].plot(figsize=(12,6)).autoscale(axis='x',tight=True)
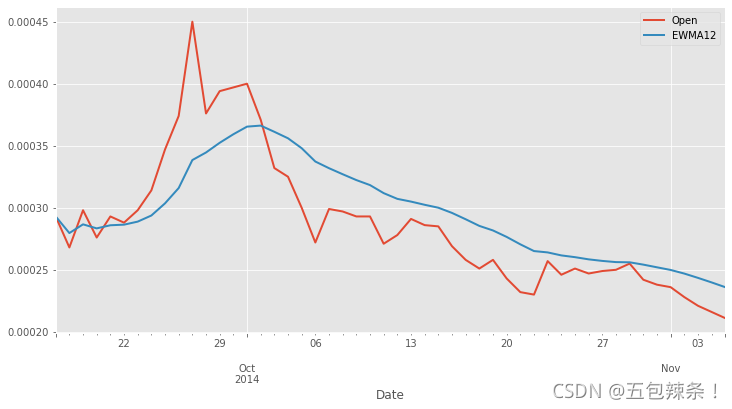
df['EWMA12'] = df['Open'].ewm(span=14,adjust=True).mean()
df[['Open','EWMA12']].plot(figsize=(24,12))

df[['Open','EWMA12']].iloc[:50].plot(figsize=(12,6)).autoscale(axis='x',tight=True)
以上就是python数据分析近年比特币价格涨幅趋势分布的详细内容,更多关于python数据分析比特币价格涨幅的资料请关注易盾网络其它相关文章!


