 vue+echarts可视化大屏,全国地图下钻,页面自适应
之前写过一篇关于数据大屏及地图下钻的文章 https://www.cnblogs.com/weijiutao/p/13977011.html ,但是存在诸多问题,如地图边界线及行政区划老旧,无法自适应问题等,正好抽时间又整理了一下修改的思路.
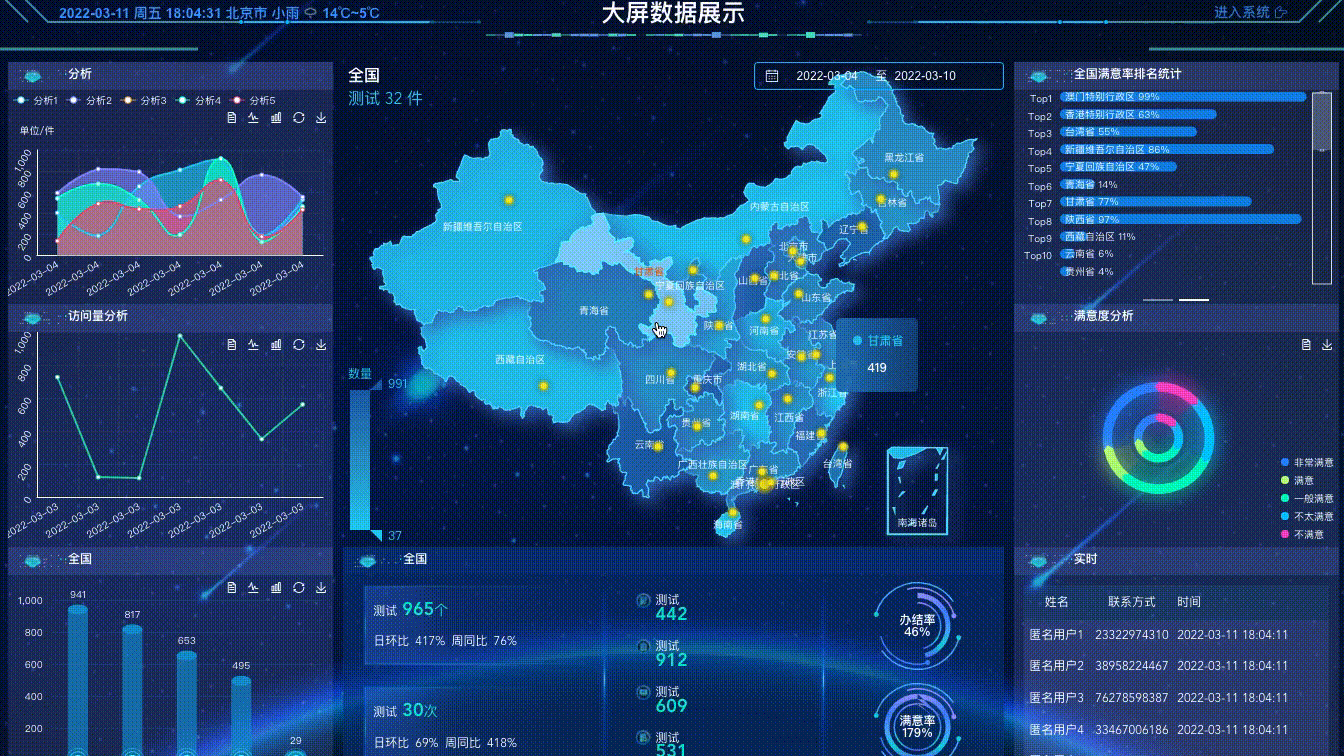
之前的文章已经获取了一套新的全国地图的行政区划及边界线,接下来就可以根据这套区划来进行地图的编写了.先来看一下最后的呈现效果.
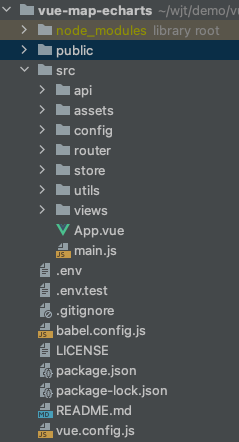
代码目录如下

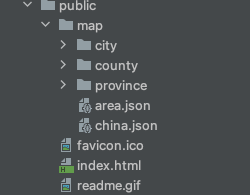
地图采用了最新的行政区划及边界进行加载,具体获取方式在另一篇文章 https://www.cnblogs.com/weijiutao/p/15989290.html
地图边界下目录

这次代码与上一个版本的最大区别在于china.vue文件,如下
  1 <template>
  2   <div id="map-container">
  3     <el-button type="text" size="large" class="back" @click="back" v-if="deepTree.length > 1">返回</el-button>
  4     <div class="echarts">
  5       <div id="map"></div>
  6     </div>
  7   </div>
  8 </template>
  9
 10 <script>
 11
 12 import {getChinaJson, getProvinceJson, getCityJson, getDistrictJson} from "@/api/map";
 13 import {mapOption} from '@/config/mapOption'
 14 import resize from '@/utils/resize'
 15
 16
 17 export default {
 18   mixins: [resize],
 19   name: "china",
 20   components: {},
 21   props: {
 22     areaCode: {
 23       type: String,
 24       default: '000000000000'
 25     },
 26     areaLevel: {
 27       type: [String, Number],
 28       default: 0
 29     },
 30     areaName: {
 31       type: String,
 32       default: 'china'
 33     },
 34     // 当前地图上的地区名字
 35     mapNameList: {
 36       type: Array,
 37       default() {
 38         return []
 39       }
 40     },
 41     // 当前地图上的地区Code
 42     mapCodeList: {
 43       type: Array,
 44       default() {
 45         return []
 46       }
 47     },
 48     // 地区统计数据
 49     areaStatistic: {
 50       type: Array,
 51       default() {
 52         return []
 53       }
 54     }
 55   },
 56   data() {
 57     return {
 58       chart: null, // 实例化echarts
 59       mapDataList: [], // 当前地图上的地区
 60       option: {...mapOption.basicOption}, // map的相关配置
 61       deepTree: [],// 点击地图时push,点返回时pop
 62       areaStatisticMapValue: {}, // 地图数据value, 只是amounts
 63       areaStatisticMapData: {}, // 地图数据data,包含所有数据
 64       areaLevelMap: {
 65         'country': 0,
 66         'china': 0,
 67         'province': 1,
 68         'city': 2,
 69         'district': 3,
 70       },
 71       tooltipAutoplay: null, // 提示框自动播放
 72       tooltipAutoplayIndex: 0, // 提示框自动播放index
 73     }
 74   },
 75   beforeDestroy() {
 76     if (!this.chart) {
 77       return
 78     }
 79     this.chart.dispose()
 80     this.chart = null
 81   },
 82   mounted() {
 83     this.$nextTick(() => {
 84       this.initEcharts();
 85       this.chart.on('click', this.echartsMapClick);
 86       this.chart.on('mouseover', this.echartsMapMouseover);
 87       this.chart.on('mouseout', this.echartsMapMouseout);
 88     });
 89   },
 90   watch: {
 91     areaStatistic: {
 92       handler(val) {
 93         var objValue = {}, objData = {}
 94         for (var i = 0; i < val.length; i++) {
 95           objValue[val[i]['areaCode'].substr(0, 6)] = val[i].amounts * 1
 96           objData[val[i]['areaCode'].substr(0, 6)] = val[i]
 97         }
 98         this.areaStatisticMapValue = objValue
 99         this.areaStatisticMapData = objData
100         this.initEcharts()
101       },
102       deep: true,
103     }
104   },
105   methods: {
106     // 初次加载绘制地图
107     initEcharts() {
108       //地图容器
109       // this.$echarts.dispose(document.getElementById('map'))
110       this.chart = this.$echarts.init(document.getElementById('map'));
111       if (this.areaLevel === 0) {
112         this.requestGetChinaJson();
113       } else if (this.areaLevel === 1) {
114         this.requestGetProvinceJSON({name: this.areaName, level: 'province', adcode: this.areaCode.substr(0, 6)})
115       } else if (this.areaLevel === 2) {
116         this.requestGetCityJSON({name: this.areaName, level: 'city', adcode: this.areaCode.substr(0, 6)})
117       } else if (this.areaLevel === 3) {
118         this.requestGetDistrictJSON({name: this.areaName, level: 'district', adcode: this.areaCode.substr(0, 6)})
119       } else {
120         return false
121       }
122     },
123     // 地图点击
124     echartsMapClick(params) {
125       this.$emit('update:areaCode', params.data.adcode + '000000')
126       this.$emit('update:areaName', params.data.name)
127       this.$emit('update:areaLevel', this.areaLevelMap[params.data.level])
128       if (params.data.level === 'province') {
129         this.requestGetProvinceJSON(params.data);
130       } else if (params.data.level === 'city') {
131         this.requestGetCityJSON(params.data)
132       } else if (params.data.level === 'district' && this.mapDataList.length > 1) {
133         this.requestGetDistrictJSON(params.data)
134       } else {
135         return false
136       }
137     },
138     //绘制全国地图areaStatistic
139     requestGetChinaJson() {
140       getChinaJson().then(res => {
141         // console.log('china--->', res)
142         this.$emit('update:areaLevel', 0)
143         this.setJsonData(res)
144       });
145     },
146     // 加载省级地图
147     requestGetProvinceJSON(params) {
148       getProvinceJson(params.adcode).then(res => {
149         // console.log('province--->', res)
150         this.$emit('update:areaLevel', 1)
151         this.setJsonData(res, params)
152       });
153     },
154     // 加载市级地图
155     requestGetCityJSON(params) {
156       getCityJson(params.adcode).then(res => {
157         // console.log('city--->', res)
158         this.$emit('update:areaLevel', 2)
159         this.setJsonData(res, params)
160       })
161     },
162     // 加载县级地图
163     requestGetDistrictJSON(params) {
164       getDistrictJson(params.adcode).then(res => {
165         // console.log('district--->', res)
166         this.$emit('update:areaLevel', 3)
167         this.setJsonData(res, params)
168       })
169     },
170     // 设置数据
171     setJsonData(res, params) {
172       var mapDataList = [];
173       var mapNameList = [];
174       var mapCodeList = [];
175       for (var i = 0; i < res.features.length; i++) {
176         var obj = {
177           ...res.features[i].properties,
178           value: this._mathRandom1000(),
179           valueData: this._mathRandom1000(),
180         };
181         mapDataList.unshift(obj)
182         mapNameList.unshift(res.features[i].properties.name)
183         mapCodeList.unshift(res.features[i].properties.adcode + '000000')
184       }
185       this.mapDataList = mapDataList;
186       this.$emit('update:mapNameList', mapNameList)
187       this.$emit('update:mapCodeList', mapCodeList)
188       this.setMapData(res, params)
189     },
190     // 设置地图信息
191     setMapData(res, params) {
192       if (this.areaName === 'china') {
193         this.deepTree.push({
194           mapDataList: this.mapDataList,
195           params: {name: 'china', level: 'country', adcode: '100000'}
196         });
197         //注册地图
198         this.$echarts.registerMap('china', res);
199         //绘制地图
200         this.renderMap('china', this.mapDataList);
201       } else {
202         this.deepTree.push({mapDataList: this.mapDataList, params: params});
203         this.$echarts.registerMap(params.name, res);
204         this.renderMap(params.name, this.mapDataList);
205       }
206     },
207     // 渲染地图
208     renderMap(map, data) {
209       var mapDataList = data.map(item => {
210         return {
211           name: item.name,
212           value: item.value
213         }
214       })
215       mapDataList = mapDataList.sort(function (a, b) {
216         return b.value - a.value
217       });
218       var pointData = []
219       for (var i = 0; i < data.length; i++) {
220         if (data[i].value != 0) {
221           pointData.push({
222             ...data[i],
223             value: [data[i].center[0], data[i].center[1], data[i].value],
224           })
225         }
226       }
227       // 设置左下角数量范围值
228       this.option.visualMap.min = mapDataList.length > 1 ? mapDataList[mapDataList.length - 2].value : 0
229       this.option.visualMap.max = mapDataList.length > 0 ? mapDataList[0].value : 0
230       // 设置左上角当前位置
231       this.option.title[0].text = map === 'china' ? '全国' : map
232       this.option.geo = {
233         show: false,
234         map: map,
235         zoom: 1.2, //当前视角的缩放比例
236         roam: true, //是否开启平游或缩放
237         center: undefined,
238       }
239       this.option.series = [
240         {
241           name: map,
242           mapType: map,
243           zoom: 1, //当前视角的缩放比例
244           roam: false, //是否开启平游或缩放
245           center: undefined,
246           scaleLimit: { //滚轮缩放的极限控制
247             min: .5,
248             max: 10
249           },
250           ...mapOption.seriesOption,
251           data: data
252         },
253         {
254           name: '散点',//series名称
255           type: 'effectScatter',//散点类型
256           coordinateSystem: 'geo',// series坐标系类型
257           rippleEffect: {
258             brushType: 'fill'
259           },
260           normal: {
261             show: true,
262             // 提示内容
263             formatter: params => {
264               return params.name;
265             },
266             position: 'top', // 提示方向
267             color: '#fff'
268           },
269           emphasis: {
270             show: true // 点
271           },
272           itemStyle: {
273             normal: {
274               color: '#F4E925',
275               shadowBlur: 10,
276               shadowColor: '#000'
277             }
278           },
279           // symbol:'pin', // 散点样式'pin'(标注)、'arrow'(箭头)
280           data: pointData,
281           symbolSize: function (val) {
282             // return val[2] / 100;
283             if (val[2] === mapDataList[0].value) {
284               return 10
285             }
286             return 6
287           },
288           showEffectOn: 'render', //加载完毕显示特效
289         },
290       ]
291       //渲染地图
292       this.chart.setOption(this.option, true)
293       this.setTooltipAutoplay()
294     },
295     // 地图鼠标移入事件
296     echartsMapMouseover() {
297       clearInterval(this.tooltipAutoplay)
298     },
299     // 地图鼠标移出事件
300     echartsMapMouseout() {
301       this.setTooltipAutoplay()
302     },
303     // 动态显示tooltip
304     setTooltipAutoplay() {
305       clearInterval(this.tooltipAutoplay)
306       // var index = 0; //播放所在下标
307       // if(this.chart.dispatchAction) {
308       this.tooltipAutoplay = setInterval(() => {
309         this.chart.dispatchAction({
310           type: 'showTip',
311           seriesIndex: 0,
312           dataIndex: this.tooltipAutoplayIndex
313         })
314         this.tooltipAutoplayIndex++
315         if (this.tooltipAutoplayIndex >= this.mapDataList.length) {
316           this.tooltipAutoplayIndex = 0;
317           this.setTooltipAutoplay()
318         }
319       }, 6666)
320       // }
321     },
322     // 返回
323     back() {
324       if (this.deepTree.length > 1) {
325         this.deepTree.pop();
326         this.mapDataList = this.deepTree[this.deepTree.length - 1].mapDataList;
327         var areaName = this.deepTree[this.deepTree.length - 1].params.name;
328         var areaCode = this.deepTree[this.deepTree.length - 1].params.adcode;
329         var areaLevel = this.deepTree[this.deepTree.length - 1].params.level;
330         var mapNameList = this.mapDataList.map(item => {
331           return item.name
332         })
333         var mapCodeList = this.mapDataList.map(item => {
334           return item.adcode + '000000'
335         })
336         this.$emit('update:areaCode', (areaCode === '100000' ? '000000' : areaCode) + '000000')
337         this.$emit('update:areaName', areaName)
338         this.$emit('update:areaLevel', this.areaLevelMap[areaLevel])
339         this.$emit('update:mapNameList', mapNameList)
340         this.$emit('update:mapCodeList', mapCodeList)
341         this.renderMap(areaName, this.mapDataList);
342       }
343     }
344   }
345 }
346
347 </script>
348
349 <style lang="scss" scoped>
350 #map-container {
351   height: 66.6%;
352   position: relative;
353
354   .echarts {
355     height: 100%;
356
357     #map {
358       width: 100%;
359       height: 100%;
360     }
361   }
362
363   .back {
364     position: absolute;
365     top: 55px;
366     left: 5px;
367     z-index: 9;
368     //color: #24CFF4;
369     font-weight: bolder;
370   }
371 }
372
373 </style>
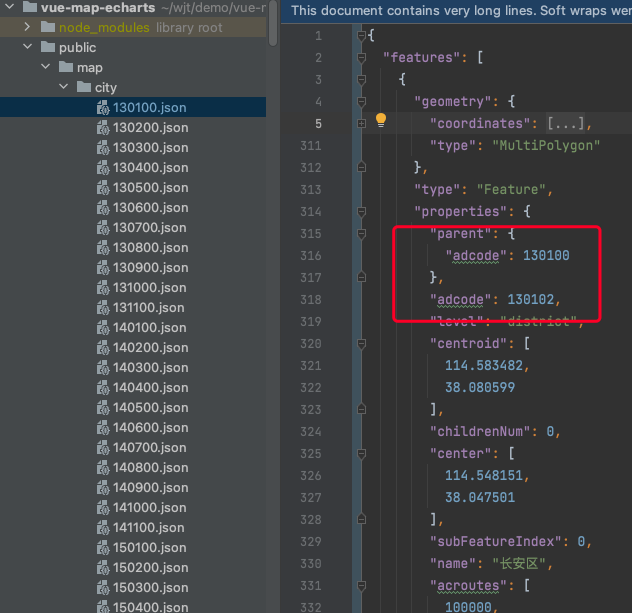
在上一套代码中,地图的边界上没有adcode(行政区划编码),这样就会导致在选取地区的时候只能根据汉字来进行匹配,导致不必要的错误,而最新抓去的行政区划里新增了adcode(行政区划)字段,这样就能根据该地区的行政区划来精准匹配.


同时在上一个版本代码里,也对直辖市和特别行政区做了特殊处理,因为他们没有三级县级地图,而这次版本由于引入adcode,可以直接匹配到指定行政区划中,减少和很多不必要的判断操作,如下图

做地图下钻本人也看过很多网上所说的,但是说的都不是很清楚,也没有专门对其进行代码的整理,这套代码是本人结合自身情况编写的,很多地方可能不是你想要的,需要对其进行取舍.
做地图其实最重要的就是地图边界线,自从echarts不再更新维护地图之后,对于初识echarts地图的人来说不太好下手,希望本文可以帮助到你.
如果有需要大家可以去以下地址下载源码学习,也欢迎star。
gitee源码地址:https://gitee.com/vijtor/vue-map-echarts
