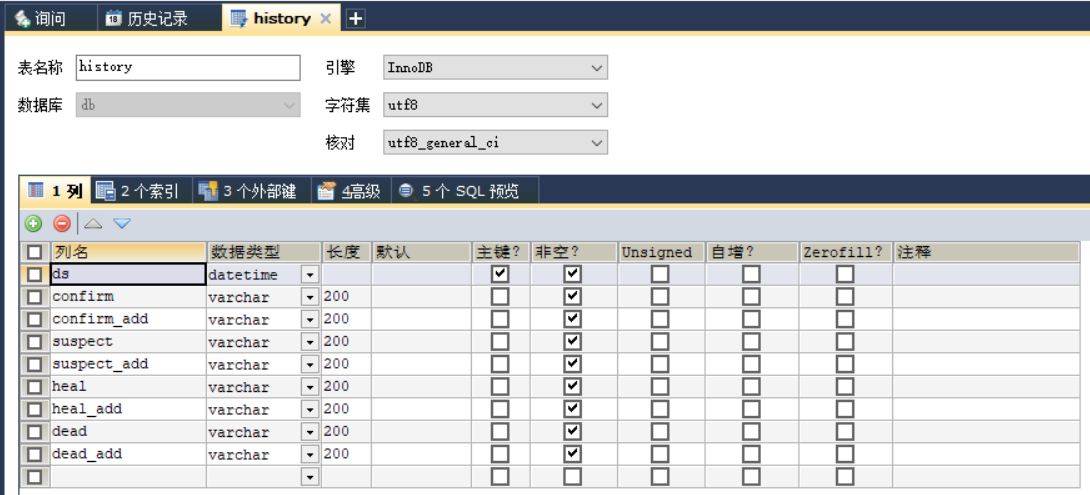
一、全国疫情数据爬取 1.数据表共有两个,分别为details和history,表结构如下: 2.爬取全国疫情数据代码如下: import requestsimport jsonimport timeimport pymysqlimport tracebackdef get_details(): url = '
一、全国疫情数据爬取
1.数据表共有两个,分别为details和history,表结构如下:


2.爬取全国疫情数据代码如下:
import requests
import json
import time
import pymysql
import traceback
def get_details():
url = 'https://view.inews.qq.com/g2/getOnsInfo?name=disease_h5&callback=jQuery34102848205531413024_1584924641755&_=1584924641756'
headers ={
'user-agent': 'Mozilla/5.0 (Windows NT 10.0; WOW64) AppleWebKit/537.36 (KHTML, like Gecko) Chrome/70.0.3538.25 Safari/537.36 Core/1.70.3741.400 QQBrowser/10.5.3863.400'
}
res = requests.get(url,headers=headers)
#输出全部信息
# print(res.text)
response_data = json.loads(res.text.replace('jQuery34102848205531413024_1584924641755(','')[:-1])
#输出这个字典的键值 dict_keys(['ret', 'data'])ret是响应值,0代表请求成功,data里是我们需要的数据
# print(response_data.keys())
"""上面已经转化过一次字典,然后获取里面的data,因为data是字符串,所以需要再次转化字典
print(json.loads(reponse_data['data']).keys())
结果:
dict_keys(['lastUpdateTime', 'chinaTotal', 'chinaAdd', 'isShowAdd', 'showAddSwitch',
'areaTree', 'chinaDayList', 'chinaDayAddList', 'dailyNewAddHistory', 'dailyHistory',
'wuhanDayList', 'articleList'])
lastUpdateTime是最新更新时间,chinaTotal是全国疫情总数,chinaAdd是全国新增数据,
isShowAdd代表是否展示新增数据,showAddSwitch是显示哪些数据,areaTree中有全国疫情数据
"""
areaTree_data = json.loads(response_data['data'])['areaTree']
temp=json.loads(response_data['data'])
# print(temp.keys())
# print(areaTree_data[0].keys())
"""
获取上一级字典里的areaTree
然后查看里面中国键值
print(areaTree_data[0].keys())
dict_keys(['name', 'today', 'total', 'children'])
name代表国家名称,today代表今日数据,total代表总数,children里有全国各地数据,我们需要获取全国各地数据,查看children数据
print(areaTree_data[0]['children'])
这里面是
name是地区名称,today是今日数据,total是总数,children是市级数据,
我们通过这个接口可以获取每个地区的总数据。我们遍历这个列表,取出name,这个是省级的数据,还需要获取市级数据,
需要取出name,children(市级数据)下的name、total(历史总数)下的confirm、heal、dead,today(今日数据)下的confirm(增加数),
这些就是我们需要的数据
"""
# print(areaTree_data[0]['children'])
# for province_data in areaTree_data[0]['children']:
# print(province_data)
ds= temp['lastUpdateTime']
details=[]
for pro_infos in areaTree_data[0]['children']:
province_name = pro_infos['name'] # 省名
for city_infos in pro_infos['children']:
city_name = city_infos['name'] # 市名
confirm = city_infos['total']['confirm']#历史总数
confirm_add = city_infos['today']['confirm']#今日增加数
heal = city_infos['total']['heal']#治愈
dead = city_infos['total']['dead']#死亡
# print(ds,province_name,city_name,confirm,confirm_add,heal,dead)
details.append([ds,province_name,city_name,confirm,confirm_add,heal,dead])
return details
def get_history():
url = 'https://view.inews.qq.com/g2/getOnsInfo?name=disease_other&callback=jQuery341026745307075030955_1584946267054&_=1584946267055'
headers ={
'user-agent': 'Mozilla/5.0 (Windows NT 10.0; WOW64) AppleWebKit/537.36 (KHTML, like Gecko) Chrome/70.0.3538.25 Safari/537.36 Core/1.70.3741.400 QQBrowser/10.5.3863.400'
}
res = requests.get(url,headers=headers)
# print(res.text)
response_data = json.loads(res.text.replace('jQuery341026745307075030955_1584946267054(','')[:-1])
# print(response_data)
data = json.loads(response_data['data'])
# print(data.keys())
chinaDayList = data['chinaDayList']#历史记录
chinaDayAddList = data['chinaDayAddList']#历史新增记录
history = {}
for i in chinaDayList:
ds = '2021.' + i['date']#时间
tup = time.strptime(ds,'%Y.%m.%d')
ds = time.strftime('%Y-%m-%d',tup)#改变时间格式,插入数据库
confirm = i['confirm']
suspect = i['suspect']
heal = i['heal']
dead = i['dead']
history[ds] = {'confirm':confirm,'suspect':suspect,'heal':heal,'dead':dead}
for i in chinaDayAddList:
ds = '2021.' + i['date']#时间
tup = time.strptime(ds,'%Y.%m.%d')
ds = time.strftime('%Y-%m-%d',tup)#改变时间格式,插入数据库
confirm_add = i['confirm']
suspect_add = i['suspect']
heal_add = i['heal']
dead_add = i['dead']
history[ds].update({'confirm_add':confirm_add,'suspect_add':suspect_add,'heal_add':heal_add,'dead_add':dead_add})
return history
def get_conn():
"""
:return: 连接,游标
"""
# 创建连接
conn = pymysql.connect(host="127.0.0.1",
user="root",
password="417020",
db="db",
charset="utf8")
# 创建游标
cursor = conn.cursor() # 执行完毕返回的结果集默认以元组显示
return conn, cursor
def close_conn(conn, cursor):
if cursor:
cursor.close()
if conn:
conn.close()
def update_details():
"""
更新 details 表
:return:
"""
cursor = None
conn = None
try:
li = get_details()
conn, cursor = get_conn()
sql = "insert into details(update_time,province,city,confirm,confirm_add,heal,dead) values(%s,%s,%s,%s,%s,%s,%s)"
sql_query = 'select %s=(select update_time from details order by id desc limit 1)' #对比当前最大时间戳
cursor.execute(sql_query,li[0][0])
if not cursor.fetchone()[0]:
print(f"{time.asctime()}开始更新最新数据")
for item in li:
cursor.execute(sql, item)
conn.commit() # 提交事务 update delete insert操作
print(f"{time.asctime()}更新最新数据完毕")
else:
print(f"{time.asctime()}已是最新数据!")
except:
traceback.print_exc()
finally:
close_conn(conn, cursor)
def insert_history():
"""
插入历史数据
:return:
"""
cursor = None
conn = None
try:
dic = get_history()
print(f"{time.asctime()}开始插入历史数据")
conn, cursor = get_conn()
sql = "insert into history values(%s,%s,%s,%s,%s,%s,%s,%s,%s)"
for k, v in dic.items():
# item 格式 {'2021-01-13': {'confirm': 41, 'suspect': 0, 'heal': 0, 'dead': 1}
cursor.execute(sql, [k, v.get("confirm"), v.get("confirm_add"), v.get("suspect"),
v.get("suspect_add"), v.get("heal"), v.get("heal_add"),
v.get("dead"), v.get("dead_add")])
conn.commit() # 提交事务 update delete insert操作
print(f"{time.asctime()}插入历史数据完毕")
except:
traceback.print_exc()
finally:
close_conn(conn, cursor)
def update_history():
"""
更新历史数据
:return:
"""
cursor = None
conn = None
try:
dic = get_history()
print(f"{time.asctime()}开始更新历史数据")
conn, cursor = get_conn()
sql = "insert into history values(%s,%s,%s,%s,%s,%s,%s,%s,%s)"
sql_query = "select confirm from history where ds=%s"
for k, v in dic.items():
# item 格式 {'2020-01-13': {'confirm': 41, 'suspect': 0, 'heal': 0, 'dead': 1}
if not cursor.execute(sql_query, k):
cursor.execute(sql, [k, v.get("confirm"), v.get("confirm_add"), v.get("suspect"),
v.get("suspect_add"), v.get("heal"), v.get("heal_add"),
v.get("dead"), v.get("dead_add")])
conn.commit() # 提交事务 update delete insert操作
print(f"{time.asctime()}历史数据更新完毕")
except:
traceback.print_exc()
finally:
close_conn(conn, cursor)
update_history()
insert_history()
update_details()
二、完整项目代码
1.项目结构:

2..js文件
ec_center.js
var ec_center=echarts.init(document.getElementById('c2'),"dark");

var mydata=[{'name':'上海','value':318},{'name':'云南','value':162}]

var ec_center_option={
    title:{
        text: '',
        subtext: '',
        x: 'left'
    },
    tooltip:{
        trigger:'item'
    },
    //左侧小导航图标
    visualMap:{
        show:true,
        x:'left',
        y:'bottom',
        textStyle:{
            fontSize:8,
        },
        splitList: [{start:1,end:9},
            {start:10,end:99},
            {start:100,end:999},
            {start:1000,end:9999},
            {start:1000000}],
        color:['#8A3310','#C64918','#E55B25','#F2AD92','#F9DCD1']
    },
    series:[{
        name:'累计确诊人数',
        type:'map',
        mapType:'china',
        roam:false,
        itemStyle:{
            normal:{
                borderWidth:.5,//区域边框宽度
                borderColor:'#009fe8',//区域边框颜色
                areaColor:'#ffefd5',//区域颜色
            },
            emphasis:{//鼠标划过地图高亮
                borderWidth:.5,
                borderColor:'#4b0082',
                areaColor:"#fff",
            }
        },
        label:{
            normal:{
                show:true,
                fontSize:8,
            },
            emphasis:{
                show:true,
                fontSize:8,
            }
        },
        data:mydata//数据
    }]
};
ec_center.setOption(ec_center_option)
controller.js:
function gettime(){
    $.ajax({
        url:"/time",
        timeout:10000,
        success: function(data) {
            $("#time").html(data)
            },
            error:function(xhr,type,errorThrowm){

            }
    });
}

function get_c1_data(){
    $.ajax({
        url:"/c1",
        success: function(data) {
            $(".num h1").eq(0).text(data.confirm)
            $(".num h1").eq(1).text(data.suspect)
            $(".num h1").eq(2).text(data.heal)
            $(".num h1").eq(3).text(data.dead)
        },
        error:function(xhr,type,errorThrowm){

        }
    })
}
function get_c2_data(){
    $.ajax({
        url:"/c2",
        success: function(data) {
            ec_center_option.series[0].data=data.data
            ec_center.setOption(ec_center_option)
        },
        error:function(xhr,type,errorThrowm){

        }
    })
}

function get_l1_data(){
    $.ajax({
        url:"/l1",
        success: function(data) {
            ec_left1_Option.xAxis[0].data=data.day
            ec_left1_Option.series[0].data=data.confirm
            ec_left1_Option.series[1].data=data.suspect
            ec_left1_Option.series[2].data=data.heal
            ec_left1_Option.series[3].data=data.dead
            ec_left1.setOption(ec_left1_Option)
        },
        error:function(xhr,type,errorThrowm){

        }
    })
}

function get_l2_data(){
    $.ajax({
        url:"/l2",
        success: function(data) {
            ec_left2_Option.xAxis[0].data=data.day
            ec_left2_Option.series[0].data=data.confirm_add
            ec_left2_Option.series[1].data=data.suspect_add
            ec_left2.setOption(ec_left2_Option)
        },
        error:function(xhr,type,errorThrowm){

        }
    })
}

function get_r1_data(){
    $.ajax({
        url:"/r1",
        success: function(data) {
            ec_right1_Option.xAxis.data=data.city;
            ec_right1_Option.series[0].data=data.confirm;
            ec_right1.setOption(ec_right1_Option);
        }
    })
}

function get_r2_data(){
    $.ajax({
        url:"/r2",
        success: function(data) {
            ec_right2_Option.xAxis.data=data.city;
            ec_right2_Option.series[0].data=data.confirm;
            ec_right2.setOption(ec_right2_Option);
        }
    })
}
gettime()
get_c1_data()
get_c2_data()
get_l1_data()
get_l2_data()
get_r1_data()
get_r2_data()
//setInterval(gettime,1000)
//setInterval(get_c1_data,1000)
ec_left1.js:
var ec_left1 = echarts.init(document.getElementById('l1'), "dark");
var ec_left1_Option = {
    title: {
        text: "全国累计趋势",
        textStyle: {
            //color:'white',
        },
        left: 'left',
    },
    tooltip: {
        trigger: 'axis',
        axisPointer: {
            type: 'line',
            lineStyle: {
                color: '#7171C6'
            }
        },
    },
    legend: {
        data: ["累计确诊", "现有疑似", "累积治愈", "累计死亡"],
        left: "right"
    },
    //图形位置
    grid: {
        left: '4%',
        right: '6%',
        bottom: '4%',
        top: 50,
        containLabel: true
    },
    xAxis: [{
        type: 'category',
        data: ['01.24', '01.25', '01.26']
    }],
    yAxis: [{
        type: 'value',
        axisLabel: {
            show: true,
            color: 'white',
            fontSize: 12,
            formatter: function(value) {
                if (value >= 1000) {
                    value = value / 1000 + 'k';
                }
                return value;
            }
        },
        //y轴线设置显示
        axisLine: {
            show: true
        },
        //与x轴平行的线样式
        splitLine: {
            show: true,
            lineStyle: {
                color: '#17273B',
                width: 1,
                type: 'solid',
            }
        }
    }],
    series: [{
        name: "累计确诊",
        type: 'line',
        smooth: true,
        data: [260, 406, 529]
    }, {
        name: "现有疑似",
        type: 'line',
        smooth: true,
        data: [54, 37, 3935]},
        {
        name: "累积治愈",
        type: 'line',
        smooth: true,
        data: [25, 25, 25]
    },{
        name: "累计死亡",
        type: 'line',
        smooth: true,
        data: [6, 9, 17]
    }]
};
ec_left1.setOption(ec_left1_Option)
ec_left2.js:
var ec_left2 = echarts.init(document.getElementById('l2'), "dark");
var ec_left2_Option = {
    tooltip: {
        trigger: 'axis',
        //指示器
        axisPointer: {
            type: 'line',
            lineStyle: {
                color: '#7171C6'
            }
        },
    },
    legend: {
        data: ['新增确诊', '新增疑似'],
        left: "right"
    },
    //标题样式
    title: {
        text: "全国新增趋势",
        textStyle: {
             color:'yellow',
            fontSize: 16
        },
        left: 'left'
    },
    //图形位置
    grid: {
        left: '4%',
        right: '6%',
        bottom: '4%',
        top: 50,
        containLabel: true
    },
    xAxis: [{
        type: 'category',
        //x轴坐标点开始与结束点位置都不在最边缘
        // boundaryGap : true,
        data: []
    }],
    yAxis: [{
        type: 'value',
        //y轴字体设置

        //y轴线设置显示
        axisLine: {
            show: true
        },
        axisLabel: {
            show: true,
            color: 'white',
            fontSize: 12,
            formatter: function(value) {
                if (value >= 1000) {
                    value = value / 1000 + 'k';
                }
                return value;
            }
        },
        //与x轴平行的线样式
        splitLine: {
            show: true,
            lineStyle: {
                color: '#17273B',
                width: 1,
                type: 'solid',
            }
        }
    }],
    series: [{
        name: "新增确诊",
        type: 'line',
        smooth: true,
        data: []
    }, {
        name: "新增疑似",
        type: 'line',
        smooth: true,
        data: []
    }]
};

ec_left2.setOption(ec_left2_Option)
ec_right1.js:
var ec_right1=echarts.init(document.getElementById('r1'),"dark");
var ec_right1_Option={
    title:{
        text:"非湖北地区城市确诊TOP5",
        textStyle:{
            color:'white',
        },
        left:'left',
    },
      color:['#3398DB'],
        tooltip:{
            trigger:'axis',
            axisPointer:{
                type:'shadow',
            }
        },
    xAxis:{
        type:'category',
        data:['东莞','珠海','境外输入','邢台','南京']
    },
    yAxis:{
        type:'value',
    },
    series:[{
        data:[99,98,96,94,93],
        type:'bar',
        barMaxWidth:"50%"
    }]
};
ec_right1.setOption(ec_right1_Option)
ec_right2.js:
var ec_right2=echarts.init(document.getElementById('r2'),"dark");
var ec_right2_Option={
    title:{
        text:"湖北地区城市确诊TOP5",
        textStyle:{
            color:'white',
        },
        left:'left',
    },
      color:['#3398DB'],
        tooltip:{
            trigger:'axis',
            axisPointer:{
                type:'shadow',
            }
        },
    xAxis:{
        type:'category',
        data:['东莞','珠海','境外输入','邢台','南京']
    },
    yAxis:{
        type:'value',
    },
    series:[{
        data:[99,98,96,94,93],
        type:'bar',
        barMaxWidth:"50%"
    }]
};
ec_right2.setOption(ec_right2_Option)
(其余js文件需从Echarts官网下载)

3.main.html:
<!DOCTYPE html>
<html>
    <head>
        <meta charset="utf-8">
        <title>疫情监控</title>
        <script src="../static/js/jquery-3.5.1.js"></script>
        <script src="../static/js/jquery-3.6.0.min.js"></script>
        <script src="../static/js/echarts.min.js"></script>
        <script src="../static/js/china.js"></script>
        <link href="../static/css/main.css" rel="stylesheet" />
        <style>

        </style>
    </head>
    <body>
        <div id="title">全国疫情实时追踪</div>
        <div id="time">我是时间</div>
        <div id="l1">我是左1</div>
        <div id="l2">我是左2</div>
        <div id="c1">
            <div class="num"><h1>123</h1></div>
            <div class="num"><h1>123</h1></div>
            <div class="num"><h1>123</h1></div>
            <div class="num"><h1>123</h1></div>
            <div class="txt"><h2>累计确诊</h2></div>
            <div class="txt"><h2>剩余疑似</h2></div>
            <div class="txt"><h2>累计治愈</h2></div>
            <div class="txt"><h2>累计死亡</h2></div>
        </div>
        <div id="c2">我是中2</div>
        <div id="r1">我是右1</div>
        <div id="r2"></div>
        <script src="../static/js/ec_center.js"></script>
        <script src="../static/js/ec_left1.js"></script>
        <script src="../static/js/ec_left2.js"></script>
        <script src="../static/js/ec_right1.js"></script>
        <script src="../static/js/ec_right2.js"></script>
        <script src="../static/js/controller.js"></script>
    </body>
</html>
4..py文件
main.py:
from flask import Flask
from flask import request
from flask import render_template
from flask import jsonify
import utils
app = Flask(__name__)

@app.route("/")
def hello_world():
    return render_template("main.html")

@app.route("/c1")
def get_c1_data():
    data=utils.get_c1_data()
    return jsonify({"confirm":data[0],"suspect":data[1],"heal":data[2],"dead":data[3]})

@app.route("/c2")
def get_c2_data():
    res=[]
    for tup in utils.get_c2_data():
        print(tup)
        res.append({"name":tup[0],"value":int(tup[1])})
    return jsonify({"data":res})

@app.route("/l1")
def get_l1_data():
    data=utils.get_l1_data()
    day,confirm,suspect,heal,dead=[],[],[],[],[]
    for a,b,c,d,e in data:
        day.append(a.strftime("%m-%d"))
        confirm.append(b)
        suspect.append(c)
        heal.append(d)
        dead.append(e)
    return jsonify({"day":day,"confirm":confirm,"suspect":suspect,"heal":heal,"dead":dead})

@app.route("/l2")
def get_l2_data():
    data=utils.get_l2_data()
    day,confirm_add,suspect_add=[],[],[]
    for a,b,c in data:
        day.append(a.strftime("%m-%d"))
        confirm_add.append(b)
        suspect_add.append(c)
    return jsonify({"day":day,"confirm_add":confirm_add,"suspect_add":suspect_add})

@app.route("/r1")
def get_r1_data():
    data=utils.get_r1_data()
    city=[]
    confirm=[]
    for k,v in data:
        city.append(k)
        confirm.append(int(v))
    return jsonify({"city":city,"confirm":confirm})

@app.route("/r2")
def get_r2_data():
    data=utils.get_r2_data()
    city=[]
    confirm=[]
    for k,v in data:
        city.append(k)
        confirm.append(int(v))
    return jsonify({"city":city,"confirm":confirm})

@app.route('/ajax',methods=["get","post"])
def index3():
    name=request.values.get("name")
    score=request.values.get("score")
    print(f"name:{name},score:{score}")
    return "10000"

@app.route("/time")
def get_time():
    return utils.get_time()


if __name__ == '__main__':
    app.run(debug=True)
utils.py:
import time
import pymysql
def get_time():
    time_str=time.strftime("%Y{}%m{}%d{} %X")
    return time_str.format("年","月","日")

def get_conn():
    conn=pymysql.connect(host="127.0.0.1",
                         user="root",
                         password="417020",
                         db="db",
                         charset="utf8")
    cursor=conn.cursor()
    return conn,cursor

def close_conn(conn,cursor):
    cursor.close()
    conn.close()

def query(sql,*args):
    conn,cursor=get_conn()
    cursor.execute(sql,args)
    res=cursor.fetchall()
    close_conn(conn,cursor)
    return res

def get_c1_data():
    sql="select sum(confirm)," \
        "(select suspect from history order by ds desc limit 1)," \
        "sum(heal)," \
        "sum(dead) " \
        "from details " \
        "where update_time=(select update_time from details order by update_time desc limit 1)"
    res=query(sql)
    return res[0]
def get_c2_data():
    sql = "select province,sum(confirm) from details "\
          "where update_time=(select update_time from details "\
          "order by update_time desc limit 1) "\
          "group by province"
    res=query(sql)
    return res

def get_l1_data():
    sql="select ds,confirm,suspect,heal,dead from history"
    res = query(sql)
    return res

def get_l2_data():
    sql="select ds,confirm_add,suspect_add from history"
    res = query(sql)
    return res

def get_r1_data():
    sql='SELECT city,confirm FROM '\
        '(select city,confirm from details '\
        'where update_time=(select update_time from details order by update_time desc limit 1) '\
        'and province not in ("湖北","北京","上海","天津","重庆") '\
        'union all '\
        'select province as city,sum(confirm) as confirm from details '\
        'where update_time=(select update_time from details order by update_time desc limit 1) '\
        'and province in ("北京","上海","天津","重庆") group by province) as a '\
        'ORDER BY confirm DESC LIMIT 5'
    res = query(sql)
    return res

def get_r2_data():
    sql='SELECT city,confirm FROM '\
        '(select city,confirm from details '\
        'where update_time=(select update_time from details order by update_time desc limit 1) '\
        'and province  in ("湖北") '\
        'union all '\
        'select province as city,sum(confirm) as confirm from details '\
        'where update_time=(select update_time from details order by update_time desc limit 1) '\
        'and province in ("北京","上海","天津") group by province) as a '\
        'ORDER BY confirm DESC LIMIT 5'
    res = query(sql)
    return res

if __name__=="__main__":

    print(get_r1_data())
    print(get_l1_data())
    print(get_l2_data())
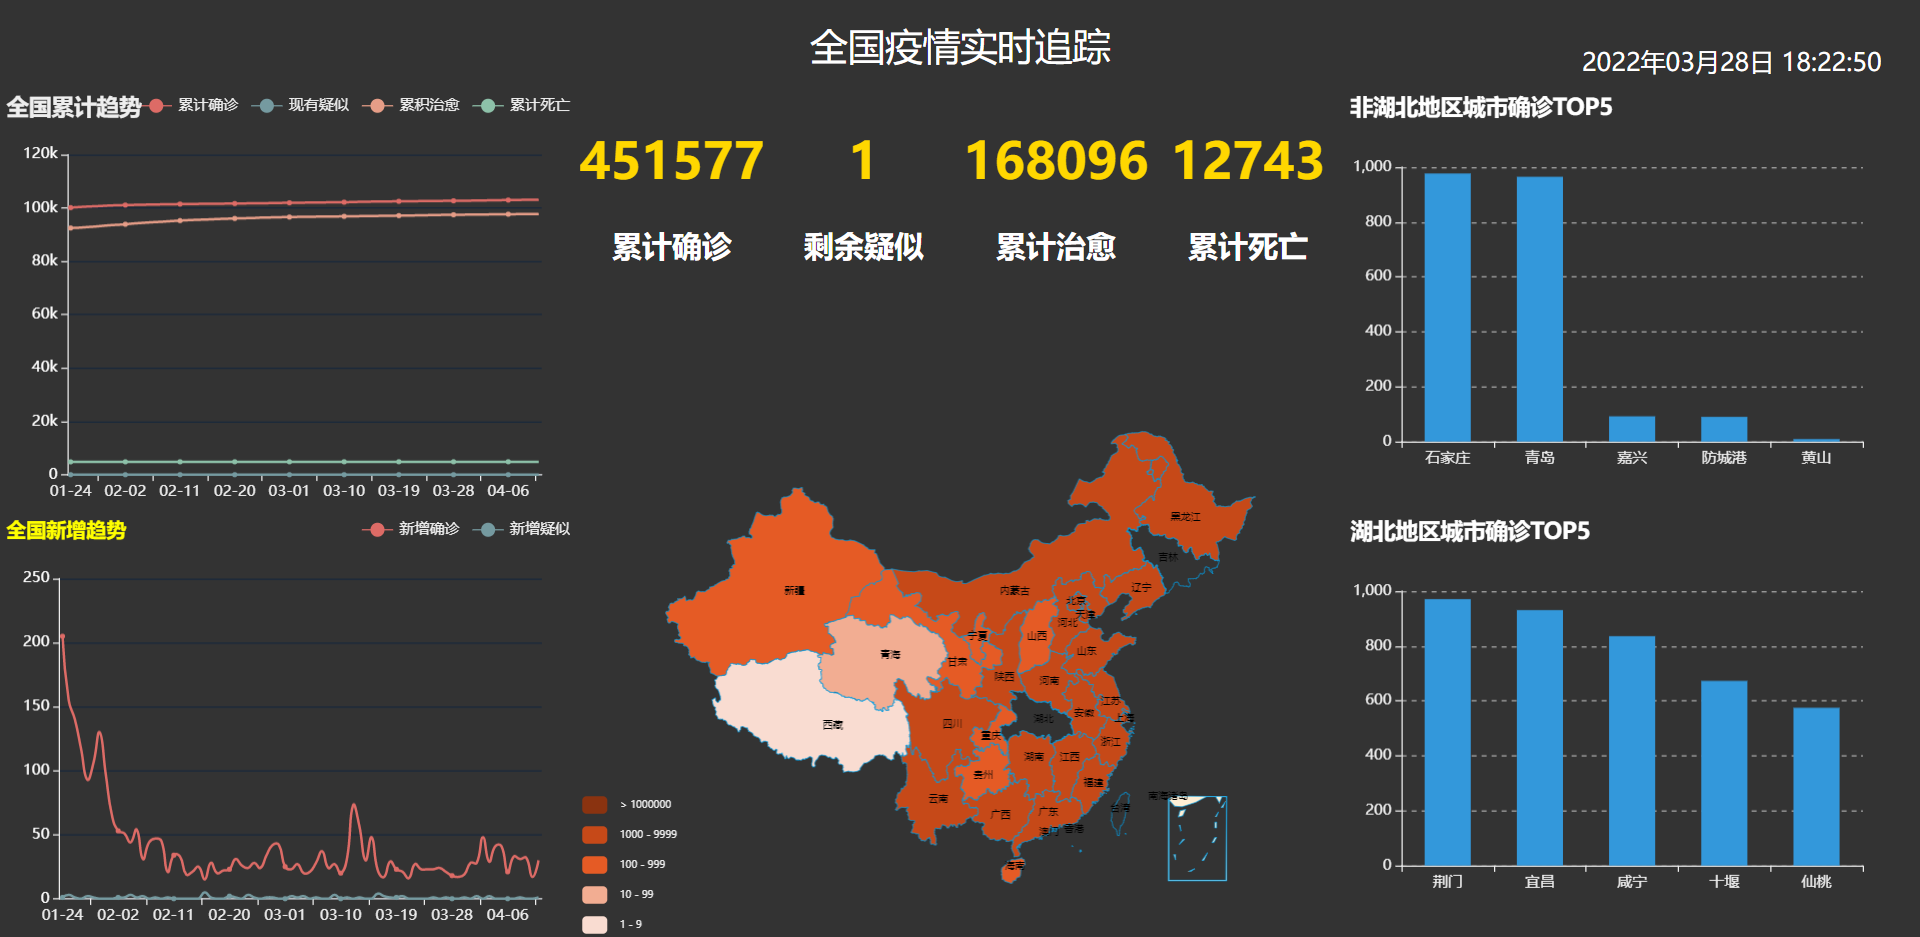
5.最终实现效果展示(更新于2022年3月28日,由于数据爬取时间原因,与官方数据相比可能存在误差):

官方数据:

