文章目录 code result: code # -*- coding: utf-8 -*- # 对数据进行基本的探索 # 返回缺失值个数以及最大最小值 from openpyxl import Workbook from openpyxl . utils . dataframe import dataframe_to
文章目录
- code
- result:

code
# -*- coding: utf-8 -*-
# 对数据进行基本的探索
# 返回缺失值个数以及最大最小值

from openpyxl import Workbook
from openpyxl.utils.dataframe import dataframe_to_rows
import pandas as pd
prefix = "./exp5/"
datafile = 'air_data.csv'  # 航空原始数据,第一行为属性标签
resultfile = 'explore_result.xls'  # 数据探索结果表

# 读取原始数据,指定UTF-8编码(需要用文本编辑器将数据装换为UTF-8编码)
data_table = pd.read_csv(prefix + datafile, encoding='utf-8')
# print(data_table)
""" Returns
    DataFrame or TextParser
    A comma-separated values (csv) file is returned as two-dimensional data structure with labeled axes. """
df_described = data_table.describe(percentiles=[
    0.75], include='all')
# print(df_described)
# 包括对数据的基本描述,percentiles参数是指定计算多少的分位数表(如1/4分位数、(1/2分位数)中位数等);T是转置,转置后更方便查阅;include :要显示的数据类型对应的数据列
df_described_T = df_described.T
print(df_described_T)
'''
    DataFrame.count
    Count number of non-NA/null observations.

    DataFrame.max
    Maximum of the values in the object.

    DataFrame.min
    Minimum of the values in the object.

    DataFrame.mean
    Mean of the values.

    DataFrame.std
    Standard deviation of the observations.

    DataFrame.select_dtypes
    Subset of a DataFrame including/excluding columns based on their dtype. '''


# print("len(data_table)")
# print(len(data_table))
# print("df_described['count']")
# print(df_described_T["count"])
# print(len(data_table)-df_described_T['count'])

# describe()函数自动计算非空值数,空值数需自己动手计算;df_described['null']将为df_described增加一列null列
df_described_T['null'] = len(data_table)-df_described_T['count']
df_described_T['standard deviation'] = data_table.std()
print(df_described_T)
''' get the sepecified colums :(use a list contains column names) '''
df_described_5 = df_described_T[['null', 'max', 'min','mean', 'std']]
# print(df_described_T)
# 表头重命名
df_described_5.columns = [u'空值数', u'最大值', u'最小值', u'均值',u'标准差']

'''这里只选取部分探索结果。
describe()函数自动计算的字df = pd.DataFrame({'categorical': pd.Categorical(['d','e','f']),
                   'numeric': [1, 2, 3],
                   'object': ['a', 'b', 'c']
                  })段有count(非空值数)、unique(唯一值数)、top(频数最高者)、freq(最高频数)、mean(平均值)、std(标准差)、min(最小值)、50%(中位数)、max(最大值)'''


# explore_table.to_excel(prefix + resultfile)  # 导出结果
wb = Workbook()
ws = wb.active
# write the entries in the dataframe to the excel table

for r in dataframe_to_rows(df_described_5, index=True, header=True):
    ws.append(r)
wb.save(prefix+resultfile)
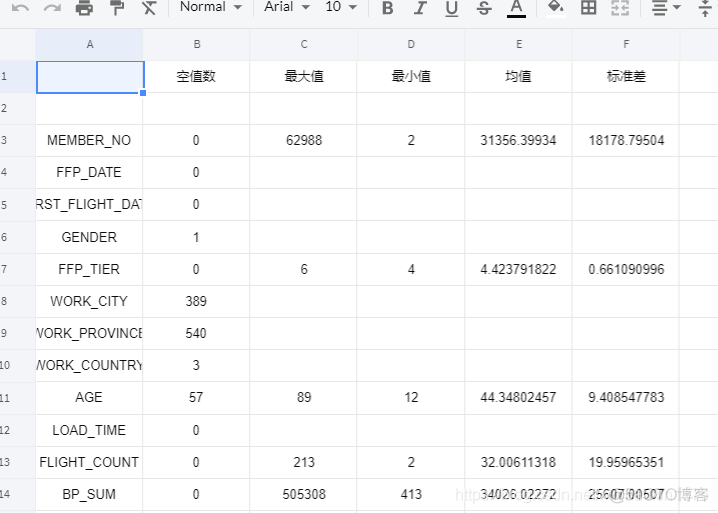
result:

