机器学习,支持向量机 import numpy as np #导入数值分析模块 import scipy . io as scio #用来读取matlat数据文件 import matplotlib . pyplot as plt #导入绘图模块 import scipy . optimize #最优化 from sklearn impo
机器学习,支持向量机
import numpy as np #导入数值分析模块import scipy.io as scio #用来读取matlat数据文件
import matplotlib.pyplot as plt #导入绘图模块
import scipy.optimize #最优化
from sklearn import svm #导入支持向量机
data = scio.loadmat("D:\CourseraML\ex6\data\ex6data1.mat") #读取数据
X, y = data["X"], data["y"]
pos = np.array([X[i] for i in range(len(X)) if y[i]==0]) #正性样本
neg = np.array([X[i] for i in range(len(X)) if y[i]==1]) #负性样本
print(pos[:,0])
print(y.flatten())def dataPlot(): #数据可视化
plt.figure(figsize = (6, 4))#新建画布
plt.scatter(pos[:,0], pos[:,1], color = "k", marker = "+", label = "Positive sample")
plt.scatter(neg[:,0], neg[:,1],color = "yellow", marker = "o", label ="Negative sample")
plt.legend()
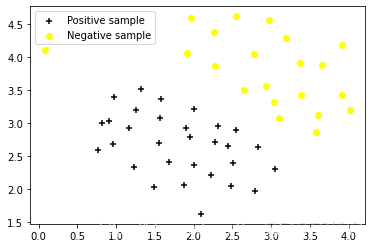
dataPlot()
print()
xvals = np.linspace(xmin, xmax, 100) #
yvals = np.linspace(ymin, ymax, 100)#
u, v = np.meshgrid(xvals , yvals) #网格矩阵
zvals = mysvm.predict(np.c_[u.ravel(), v.ravel()]).reshape(u.shape) #生成z变量
dataPlot() #散点
plt.contour(u, v, zvals)#等值线
plt.title("Decision boundary") #标题
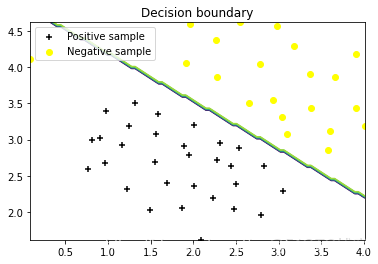
boundaryPlot(linearsvm, np.min(X[:,0]), np.max(X[:,0]), np.min(X[:,1]), np.max(X[:,1]))
linearsvm.fit(X, y.ravel()) #训练模型
linearsvm.score(X,y)#模型得分
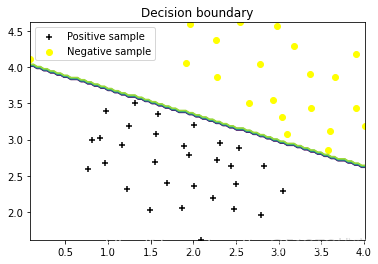
boundaryPlot(linearsvm, np.min(X[:,0]), np.max(X[:,0]), np.min(X[:,1]), np.max(X[:,1]))
- 高斯核
return np.exp(-((x1 -x2)**2).sum()/ (2*sigma**2))
gaussKernel(np.array([1, 2, 1]),np.array([0, 4, -1]), 2.)
- 非线性可分
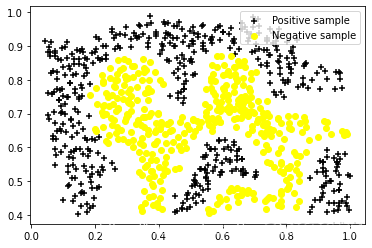
X, y = mat["X"], mat["y"]
pos = np.array([X[i] for i in range(len(X)) if y[i] == 1]) #正性样本
neg = np.array([X[i] for i in range(len(X)) if y[i] == 0]) #负性样本
dataPlot()
gamma = np.power( sigma, -2)
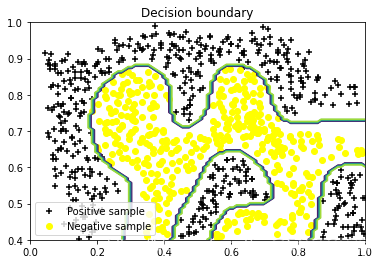
gauss_svm = svm.SVC(C = 1, kernel = "rbf", gamma = gamma) #模型初始化
gauss_svm.fit(X, y.flatten()) #训练模型
#dataPlot()
boundaryPlot(gauss_svm, 0, 1, 0.4, 1)
- 第三份数据
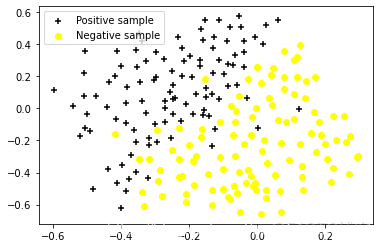
X, y = mat["X"], mat["y"]
Xval, yval = mat["Xval"], mat["yval"]
pos = np.array([X[i] for i in range(len(X)) if y[i] == 1]) #正性样本
neg = np.array([X[i] for i in range(len(X)) if y[i] == 0]) #负性样本
dataPlot()
- 不同C值下的模型
sigmavalues = Cvalues
best_pair, best_score = (0, 0), 0
for C in Cvalues:
for sigma in sigmavalues:
gamma = np.power(sigma, -2)
model = svm.SVC(C = C, kernel = "rbf", gamma = gamma) #模型初始化
model.fit(X, y.flatten()) #模型训练
this_score = model.score(Xval, yval) #模型得分
if this_score > best_score:
best_score = this_score
best_pair = (C, sigma)
print("best_pair = {}, best_score = {}".format(best_pair, best_score))
- 决策边界
gaus_svm.fit(X, y.flatten())
#dataPlot()
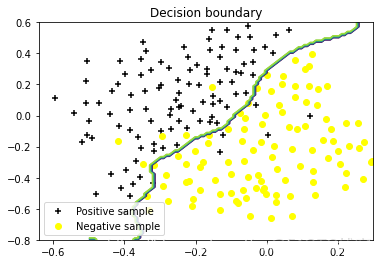
boundaryPlot(gaus_svm, -0.5, 0.3, -0.8, 0.6)
