大伙使用谷歌浏览器(Google Chrome)会查看请求头吗?下面小编就分享了谷歌浏览器(Google Chrome)查看请求头的操作技巧哦,一起来看看吧。 1、打开谷歌浏览器(Google Chrome),在其右上角
大伙使用谷歌浏览器(Google Chrome)会查看请求头吗?下面小编就分享了谷歌浏览器(Google Chrome)查看请求头的操作技巧哦,一起来看看吧。
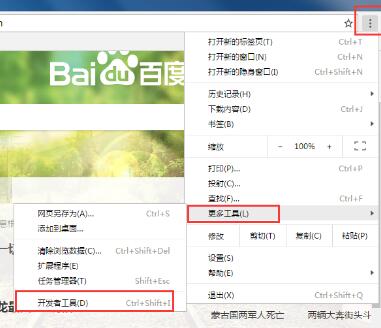
1、打开谷歌浏览器(Google Chrome),在其右上角的菜单中找到“开发者工具”并打开;
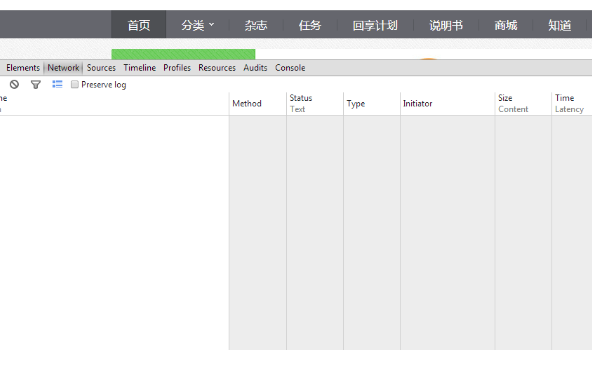
2、找到Network选项框。以百度页面为例,点击任务选框来查看网络请求流;
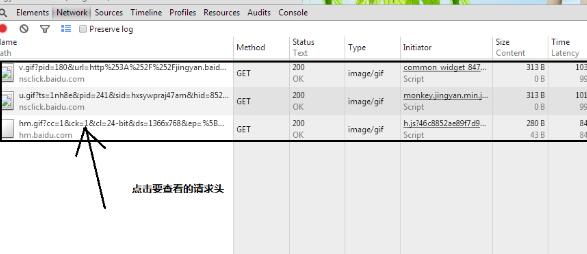
3、在Network框里会有所有的请求流;
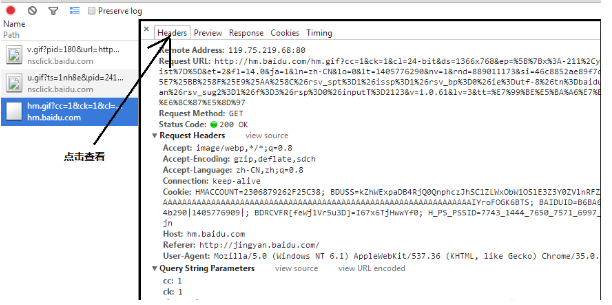
4、点击自己所需要的请求流,查看头部信息。
谷歌浏览器相关攻略推荐:
谷歌浏览器怎么设置翻译网页内容?设置翻译网页内容的方法说明
谷歌浏览器如何打开硬件加速模式?硬件加速模式打开方式分享
谷歌浏览器怎么登录账号?谷歌浏览器登录账号方法分享
上文就是IEfans小编今日为大家带来的谷歌浏览器查看请求头操作技巧分享,更多软件教程敬请关注自由互联!