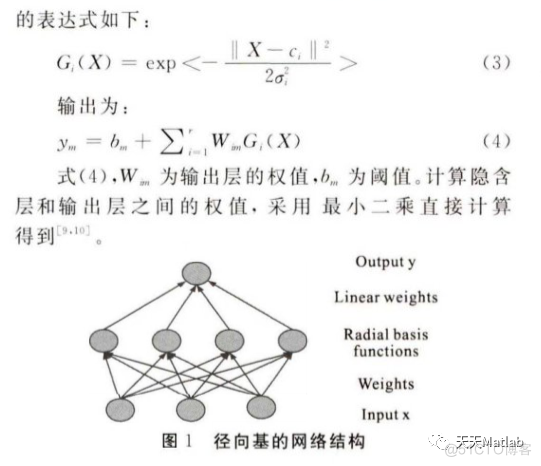
1 简介 数据预测是指在分析现有数据的基础上估计或推测未来的数据的过程.神经网络具有良好的训练性和自学习能力,能够对大量复杂数据进行分析,特别是RBF网络模型,非常适合解决预测
1 简介
数据预测是指在分析现有数据的基础上估计或推测未来的数据的过程.神经网络具有良好的训练性和自学习能力,能够对大量复杂数据进行分析,特别是RBF网络模型,非常适合解决预测问题.随着云计算技术的迅速发展,数据获取,数据存储,数据分析的能力的发展和普及,使得在传统模式下很难进行的大数据量数据预测成为可能.


2 部分代码
clcclear all
close all
ST_RBF = load('ST_RBF.mat');
RBF = load('RBF.mat');
%% Results
% Input and output signals (training phase)
figure
plot(ST_RBF.indt,ST_RBF.f_train,'k','linewidth',ST_RBF.lw);
hold on;
% plot(RBF.indt,RBF.f_train,'r','linewidth',RBF.lw);
plot(RBF.indt,RBF.y_train,'.:b','linewidth',RBF.lw);
plot(ST_RBF.indt,ST_RBF.y_train,'--r','linewidth',ST_RBF.lw);
xlim([ST_RBF.start_of_series_tr+ST_RBF.time_steps ST_RBF.end_of_series_tr]);
h=legend('Actual Value (Training)','RBF Predicted (Training)','ST-RBF Predicted (Training)','Location','Best');
grid minor
xlabel('Sample #','FontSize',ST_RBF.fsize);
ylabel('Magnitude','FontSize',ST_RBF.fsize);
set(h,'FontSize',12)
set(gca,'FontSize',13)
saveas(gcf,strcat('Time_SeriesTraining.png'),'png')
% Input and output signals (test phase)
figure
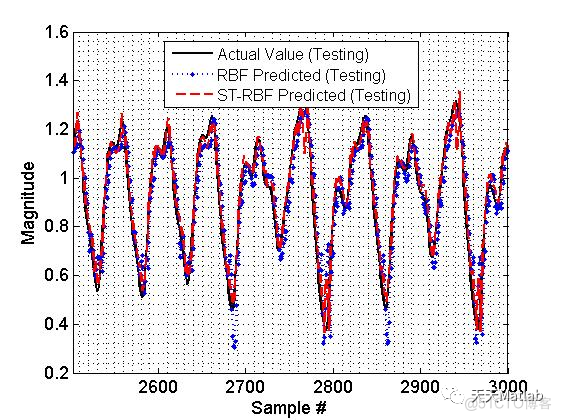
plot(ST_RBF.indts,ST_RBF.f_test,'k','linewidth',ST_RBF.lw);
hold on;
plot(RBF.indts,RBF.y_test,'.:b','linewidth',RBF.lw);
plot(ST_RBF.indts,ST_RBF.y_test,'--r','linewidth',ST_RBF.lw);
xlim([ST_RBF.start_of_series_ts+ST_RBF.time_steps ST_RBF.end_of_series_ts]);
h=legend('Actual Value (Testing)','RBF Predicted (Testing)','ST-RBF Predicted (Testing)','Location','Best');
grid minor
xlabel('Sample #','FontSize',ST_RBF.fsize);
ylabel('Magnitude','FontSize',ST_RBF.fsize);
set(h,'FontSize',12)
set(gca,'FontSize',13)
saveas(gcf,strcat('Time_SeriesTesting.png'),'png')
% Objective function (MSE) (training phase)
figure
plot(RBF.start_of_series_tr:RBF.end_of_series_tr-1,10*log10(RBF.I(1:RBF.end_of_series_tr-RBF.start_of_series_tr)),'+-b','linewidth',RBF.lw)
hold on
plot(ST_RBF.start_of_series_tr:ST_RBF.end_of_series_tr-1,10*log10(ST_RBF.I(1:ST_RBF.end_of_series_tr-ST_RBF.start_of_series_tr)),'+-r','linewidth',ST_RBF.lw)
h=legend('RBF (Training)','ST-RBF (Training)','Location','North');
grid minor
xlabel('Sample #','FontSize',ST_RBF.fsize);
ylabel('MSE (dB)','FontSize',ST_RBF.fsize);
set(h,'FontSize',12)
set(gca,'FontSize',13)
saveas(gcf,strcat('Time_SeriesTrainingMSE.png'),'png')
% Objective function (MSE) (test phase)
figure
plot(RBF.start_of_series_ts+RBF.time_steps:RBF.end_of_series_ts,10*log10(RBF.I(RBF.end_of_series_tr-RBF.start_of_series_tr+1:end)),'.:b','linewidth',RBF.lw+1)
hold on
plot(ST_RBF.start_of_series_ts+ST_RBF.time_steps:ST_RBF.end_of_series_ts,10*log10(ST_RBF.I(ST_RBF.end_of_series_tr-ST_RBF.start_of_series_tr+1:end)),'.:r','linewidth',ST_RBF.lw+1)
h=legend('RBF (Testing)','ST-RBF (Testing)','Location','South');
grid minor
xlabel('Sample #','FontSize',ST_RBF.fsize);
ylabel('MSE (dB)','FontSize',ST_RBF.fsize);
set(h,'FontSize',12)
set(gca,'FontSize',13)
saveas(gcf,strcat('Time_SeriesTestingMSE.png'),'png')
% Mean square error
[[10*log10(((RBF.f_train'-RBF.y_train)*(RBF.f_train'-RBF.y_train)')/length(RBF.y_train)) ...
10*log10(((RBF.f_test'-RBF.y_test)*(RBF.f_test'-RBF.y_test)')/length(RBF.y_test))];
[10*log10(((ST_RBF.f_train'-ST_RBF.y_train)*(ST_RBF.f_train'-ST_RBF.y_train)')/length(ST_RBF.y_train)) ...
10*log10(((ST_RBF.f_test'-ST_RBF.y_test)*(ST_RBF.f_test'-ST_RBF.y_test)')/length(ST_RBF.y_test))]]
3 仿真结果

4 参考文献
[1]乐励华, 温荣生, 朱辉. 基于RBF神经网络的股市预测及MATLAB实现[J]. 科技情报开发与经济, 2008.
博主简介:擅长智能优化算法、神经网络预测、信号处理、元胞自动机、图像处理、路径规划、无人机等多种领域的Matlab仿真,相关matlab代码问题可私信交流。
部分理论引用网络文献,若有侵权联系博主删除。

