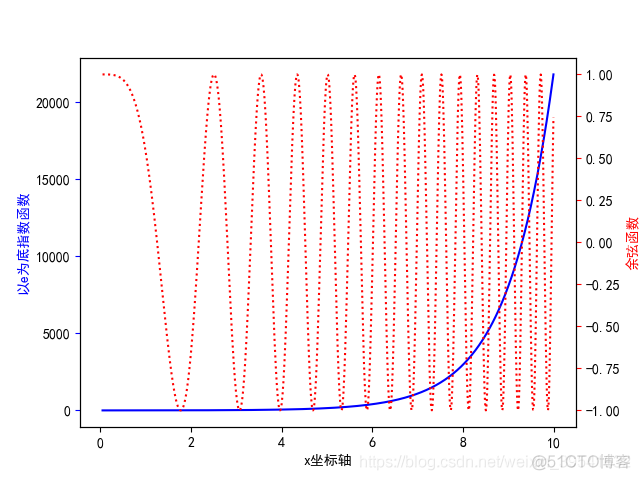
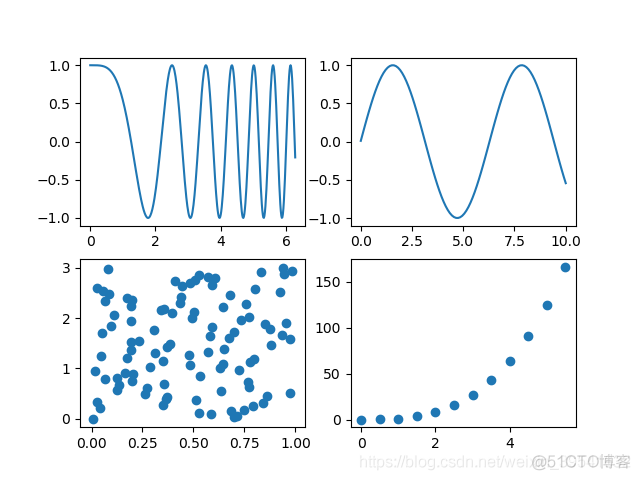
import matplotlib as mpl import matplotlib . pyplot as plt import numpy as np 共享单一绘图区域的坐标轴 def no1 (): """ 共享单一绘图区域的坐标轴 :return: """ mpl . rcParams [ "font.sans-serif" ] = [ "SimHei" ] mpl . r
import matplotlib.pyplot as plt
import numpy as np

"""
共享单一绘图区域的坐标轴
:return:
"""
mpl.rcParams["font.sans-serif"] = ["SimHei"]
mpl.rcParams["axes.unicode_minus"] = False
fig, ax1 = plt.subplots()
t = np.arange(0.05, 10.0, 0.01)
s1 = np.exp(t)
ax1.plot(t, s1, c='b',ls='-')
ax1.set_xlabel("x坐标轴")
ax1.set_ylabel("以e为底指数函数",color='b')
ax1.tick_params("y",color='b')
ax2 = ax1.twinx()
s2 = np.cos(t**2)
ax2.plot(t,s2,c='r',ls=':')
ax2.set_ylabel("余弦函数",color='r')
ax2.tick_params("y", color='r')
plt.savefig(r"E:\Programmer\PYTHON\Matplotlib实践\figure\Figure(Unit "
r"7)\no1.png")
plt.show()

"""
共享不同子区绘图区域的坐标轴
:return:
"""
x1 = np.linspace(0, 2*np.pi, 400)
y1 = np.cos(x1**2)
x2 = np.linspace(0.01, 10, 100)
y2 = np.sin(x2)
x3 = np.random.rand(100)
y3 = np.linspace(0,3,100)
x4 = np.arange(0,6,0.5)
y4 = np.power(x4,3)
# subplots(2,2,sharex="all")
# subplots(2,2,sharex="none")
# subplots(2,2,sharex="row")
# subplots(2,2,sharex="col")
fig, ax = plt.subplots(2,2)
ax1 = ax[0, 0]
ax1.plot(x1, y1)
ax2 = ax[0, 1]
ax2.plot(x2, y2)
ax3 = ax[1, 0]
ax3.scatter(x3, y3)
ax4 = ax[1, 1]
ax4.scatter(x4, y4)
plt.savefig(r"E:\Programmer\PYTHON\Matplotlib实践\figure\Figure(Unit "
r"7)\no2.png")
plt.show()

"""
将共享坐标轴的子区之间的空隙去掉
:return:
"""
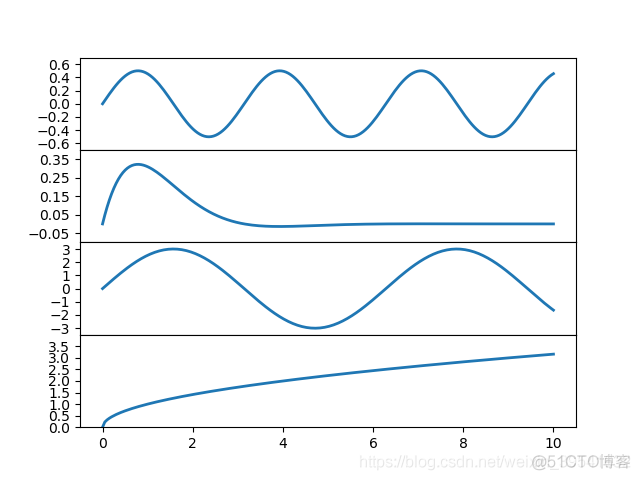
x = np.linspace(0.0, 10.0, 200)
y = np.cos(x)*np.sin(x)
y2 = np.exp(-x)*np.sin(x)
y3 = 3*np.sin(x)
y4 = np.power(x, 0.5)
fig, (ax1,ax2,ax3,ax4) = plt.subplots(4, 1, sharex='all')
fig.subplots_adjust(hspace=0)
ax1.plot(x,y,ls='-',lw=2)
ax1.set_yticks(np.arange(-0.6,0.7,0.2))
ax1.set_ylim(-0.7,0.7)
ax2.plot(x, y2, ls='-', lw=2)
ax2.set_yticks(np.arange(-0.05, 0.36, 0.1))
ax2.set_ylim(-0.1, 0.4)
ax3.plot(x, y3, ls='-', lw=2)
ax3.set_yticks(np.arange(-3, 4, 1))
ax3.set_ylim(-3.5, 3.5)
ax4.plot(x, y4, ls='-', lw=2)
ax4.set_yticks(np.arange(0.0, 3.6, 0.5))
ax4.set_ylim(0.0, 4.0)
plt.savefig(r"E:\Programmer\PYTHON\Matplotlib实践\figure\Figure(Unit "
r"7)\no3.png")
plt.show()

"""
共享个别子区绘图区域的坐标轴
:return:
"""
# create sample data
x1 = np.linspace(0, 2 * np.pi, 400)
y1 = np.cos(x1 ** 2)
x2 = np.linspace(0.01, 10, 100)
y2 = np.sin(x2)
x3 = np.random.rand(100)
y3 = np.linspace(0, 3, 100)
x4 = np.arange(0, 6, 0.5)
y4 = np.power(x4, 3)
# set (2,2) subplots
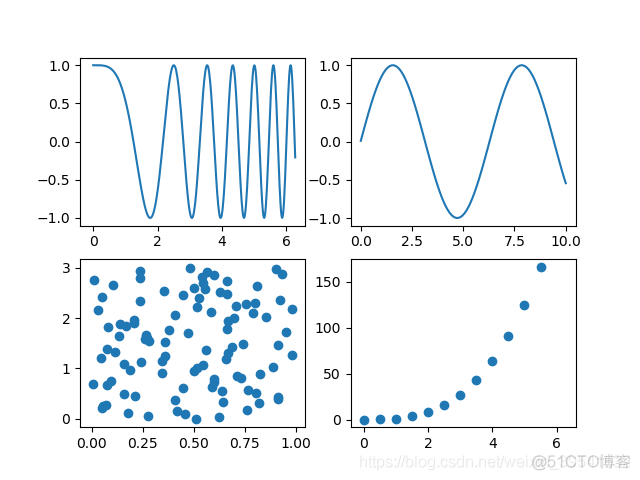
fig, ax = plt.subplots(2, 2)
# set chart of each subplot
ax1 = plt.subplot(221)
ax1.plot(x1, y1)
ax2 = plt.subplot(222)
ax2.plot(x2, y2)
ax3 = plt.subplot(223)
ax3.scatter(x3, y3)
ax4 = plt.subplot(224,sharex=ax1)
ax4.scatter(x4, y4)
plt.savefig(r"E:\Programmer\PYTHON\Matplotlib实践\figure\Figure(Unit "
r"7)\no4.png")
plt.show()
- 本篇博文特别感谢刘大成的《Python数据可视化之matplotlib实践》
