缺失值分析处理 可视化数据分析 代码 import numpy as np import pandas as pd import matplotlib.pyplot as plt import seaborn as sns import warnings warnings.filterwarnings( 'ignore' ) train=pd.read_csv( "train.csv" ) test=pd.rea

缺失值分析处理
可视化&数据分析
代码
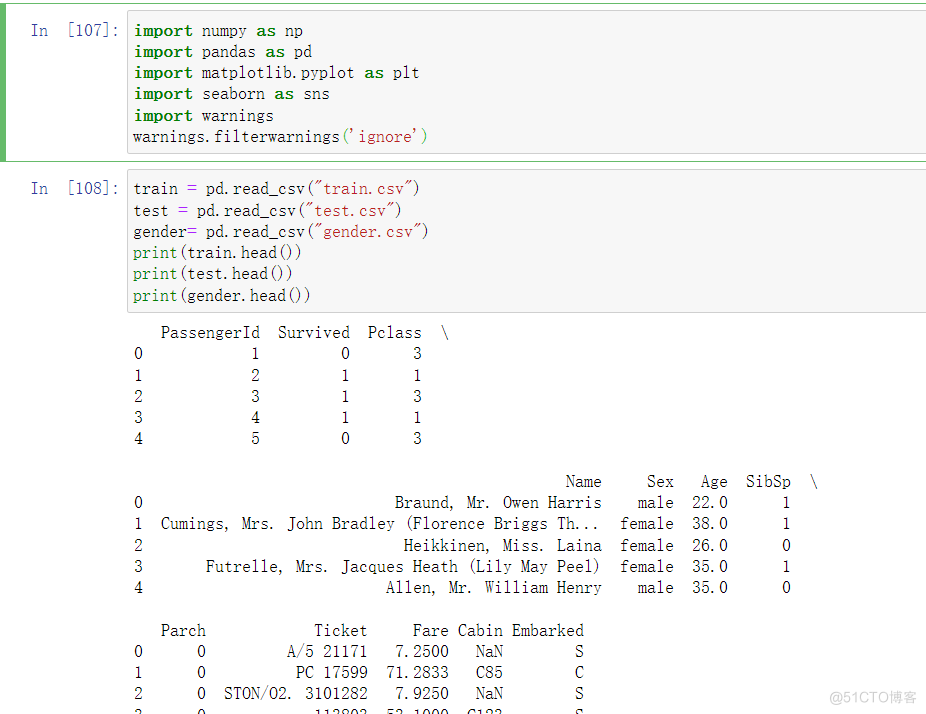
importnumpyasnpimportpandasaspdimportmatplotlib.pyplotaspltimportseabornassnsimportwarningswarnings.filterwarnings('ignore')
train = pd.read_csv("train.csv")test = pd.read_csv("test.csv")gender= pd.read_csv("gender.csv")print(train.head())print(test.head())print(gender.head())
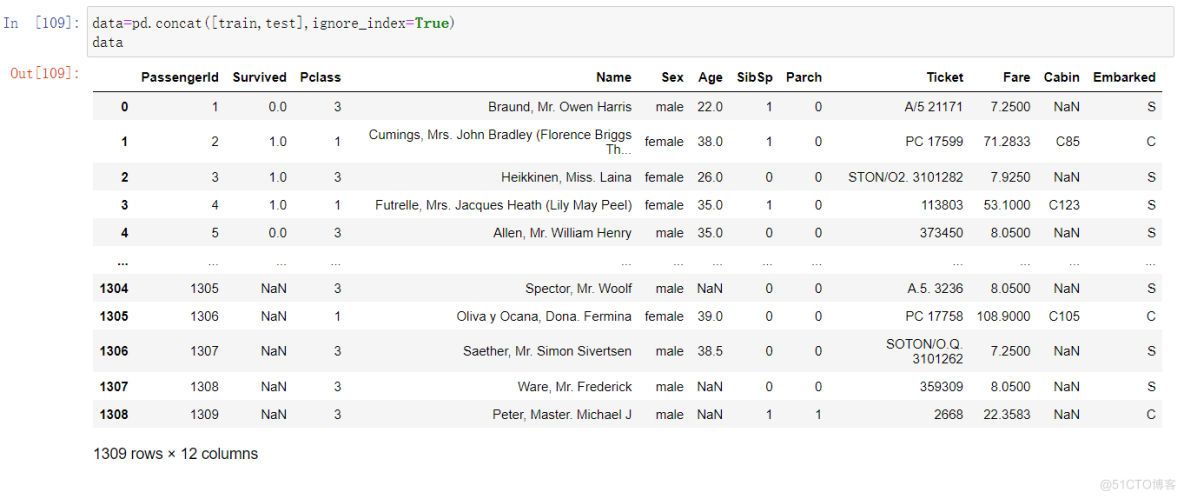
data=pd.concat([train,test],ignore_index=True)data
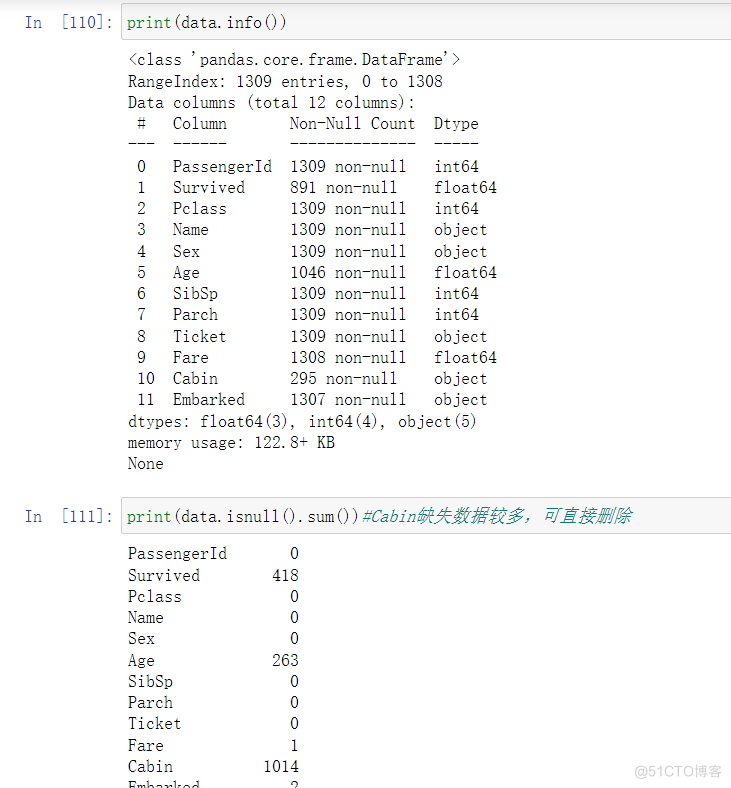
print(data.info())
print(data.isnull().sum())#Cabin缺失数据较多,可直接删除
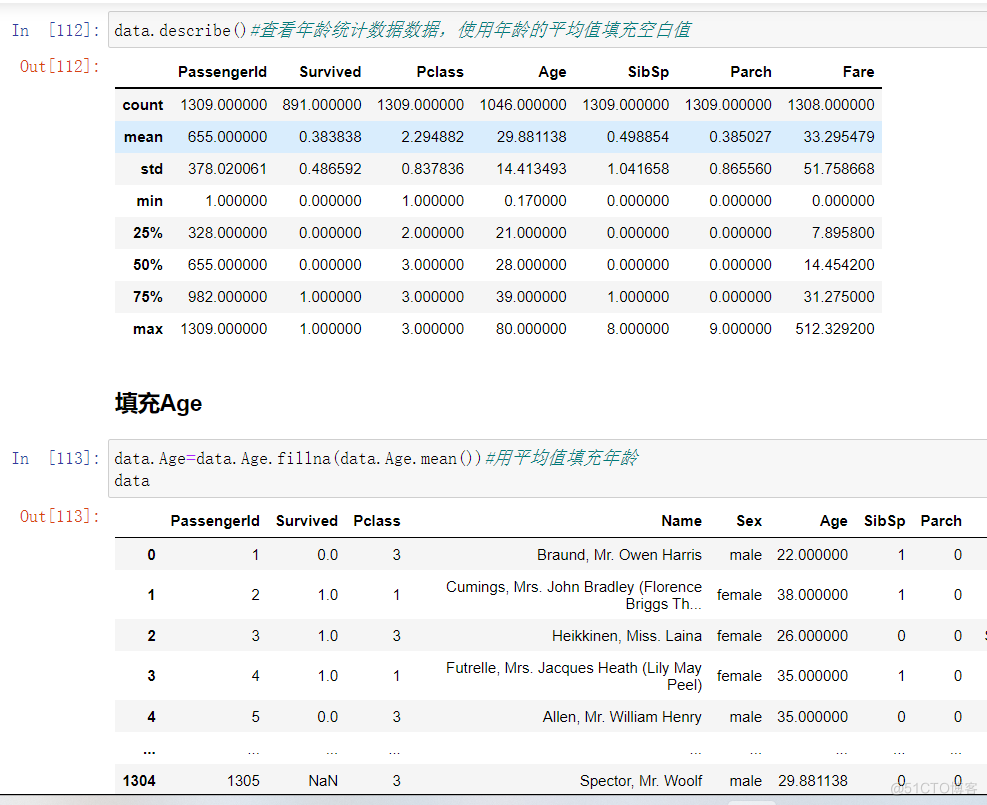
data.describe()#查看年龄统计数据数据,使用年龄的平均值填充空白值
data.Age=data.Age.fillna(data.Age.mean())#用平均值填充年龄data
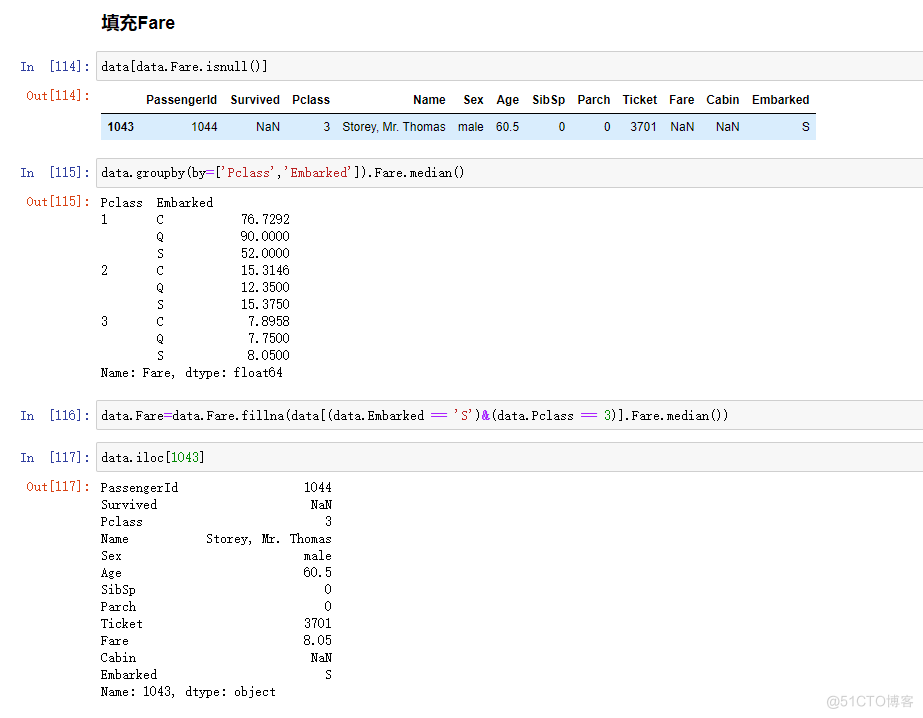
data[data.Fare.isnull()]
data.Fare=data.Fare.fillna(data[(data.Embarked =='S')&(data.Pclass ==3)].Fare.median())
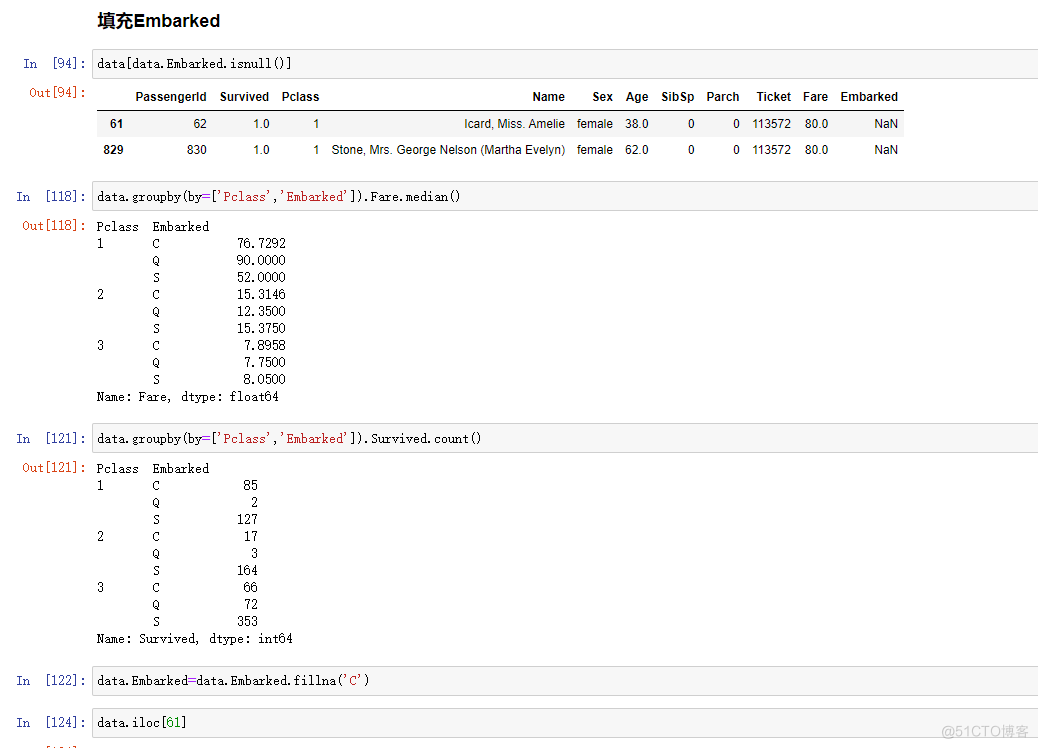
data[data.Embarked.isnull()]
data.groupby(by=['Pclass','Embarked']).Fare.median()
data.groupby(by=['Pclass','Embarked']).Survived.count()
data.Embarked=data.Embarked.fillna('C')
data.iloc[61]
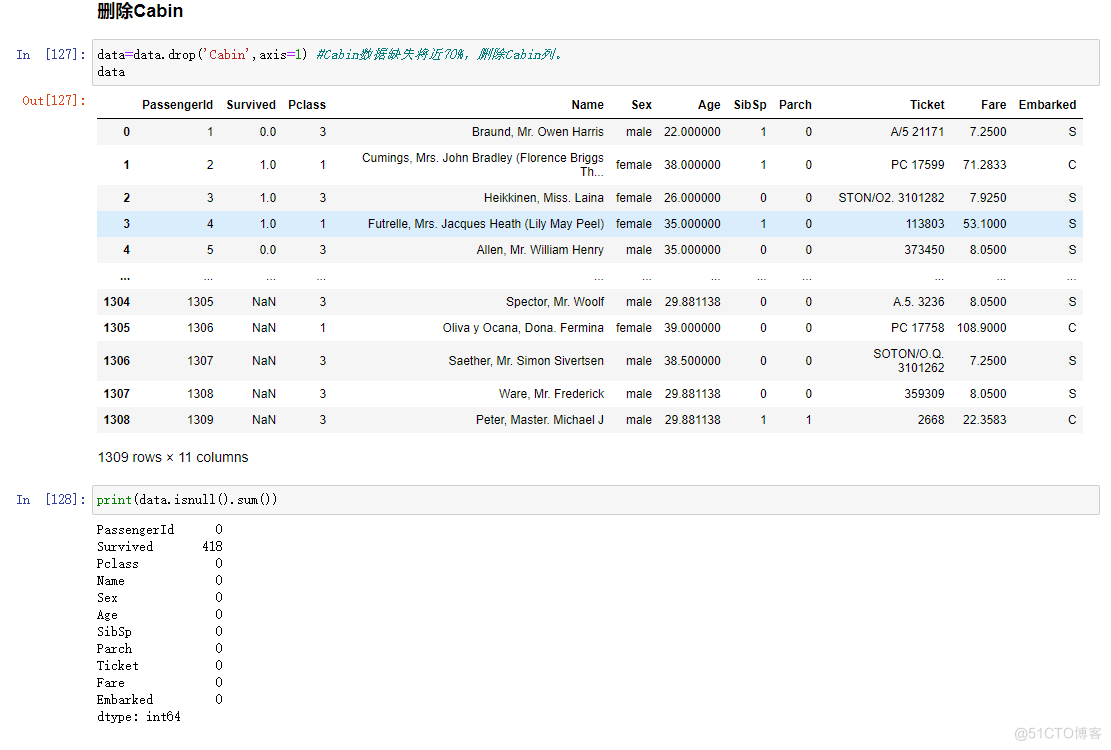
data=data.drop('Cabin',axis=1)#Cabin数据缺失将近70%,删除Cabin列。data
print(data.isnull().sum())
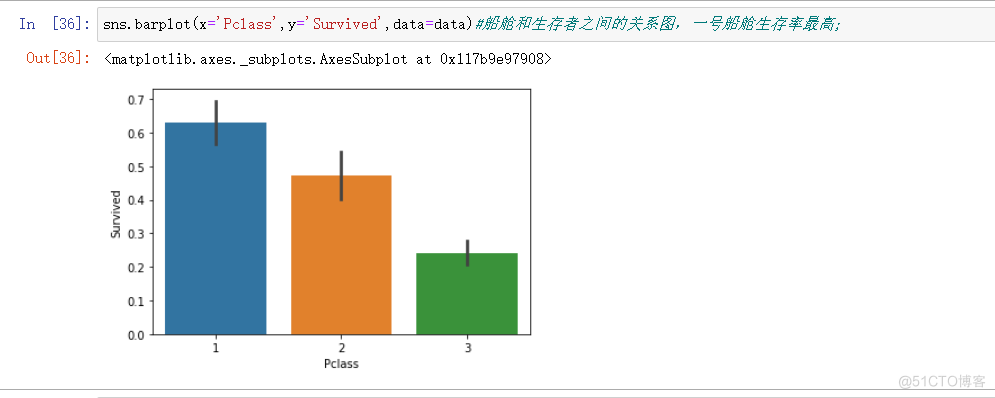
sns.barplot(x='Pclass',y='Survived',data=data)
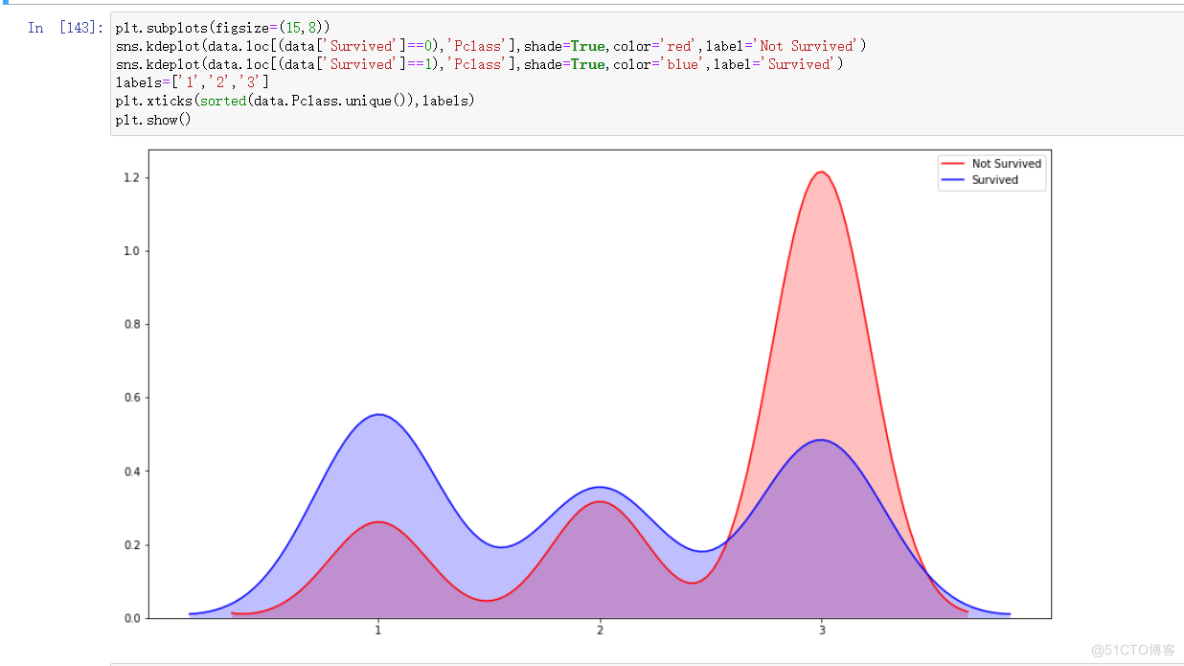
plt.subplots(figsize=(15,8))sns.kdeplot(data.loc[(data['Survived']==0),'Pclass'],shade=True,color='red',label='Not Survived')sns.kdeplot(data.loc[(data['Survived']==1),'Pclass'],shade=True,color='blue',label='Survived')labels=['1','2','3']plt.xticks(sorted(data.Pclass.unique()),labels)plt.show()
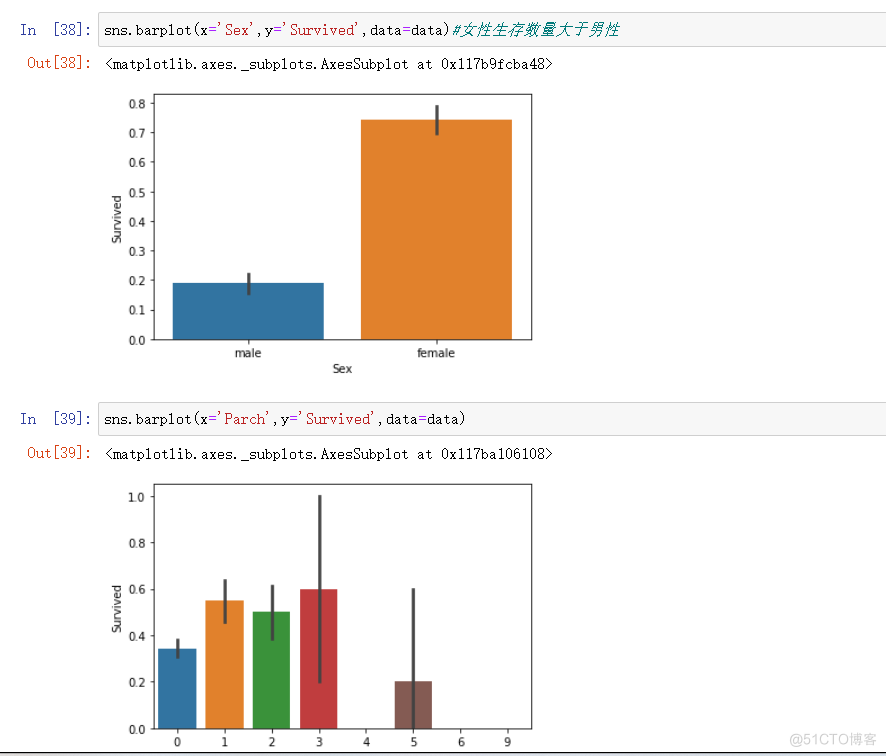
sns.barplot(x='Sex',y='Survived',data=data)#女性生存数量大于男性
sns.barplot(x='Parch',y='Survived',data=data)
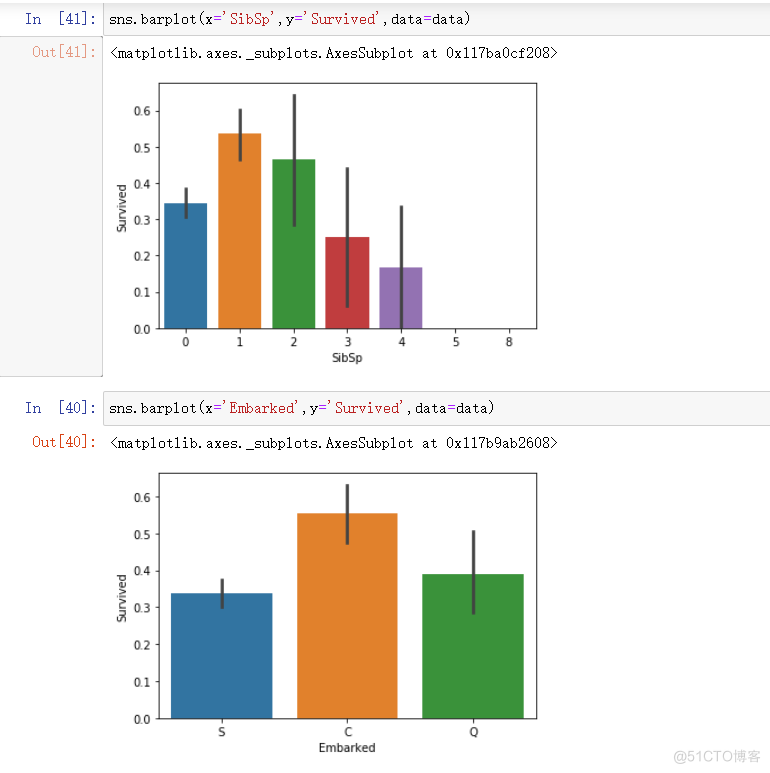
sns.barplot(x='SibSp',y='Survived',data=data)
sns.barplot(x='Embarked',y='Survived',data=data)