html代码: !DOCTYPE html PUBLIC "-//W3C//DTD XHTML 1.0 Transitional//EN" "http://www.w3.org/TR/xhtml1/DTD/xhtml1-transitional.dtd"html xmlns="http://www.w3.org/1999/xhtml"head title/title/headbody div id="divBarChart" /div div id="divPie
html代码:
<!DOCTYPE html PUBLIC "-//W3C//DTD XHTML 1.0 Transitional//EN" "http://www.w3.org/TR/xhtml1/DTD/xhtml1-transitional.dtd">
<html xmlns="http://www.w3.org/1999/xhtml">
<head>
    <title></title>
</head>
<body>
    <div id="divBarChart">
    </div>
    <div id="divPieChart">
    </div>
    <div id="divPieChart2">
    </div>
    <script type="text/javascript" src="FusionChart/FusionCharts.js"></script>
    <script type="text/javascript">
        function ConstructHttpString(myURL) {
            myURL += "?rnd=" + new Date().getTime();
            return encodeURIComponent(myURL.toString());
        }
        //画图(以指定 xml格式文件为数据源)
        function DrawChart(divId,flashFileName,width,height,xmlUrl) {
            var myChartId = new Date().getTime();
            var myChart = new FusionCharts("FusionChart/" + flashFileName, myChartId, width, height);
            //myChart.setDataURL("data.xml"); //获取xml格式数据源
            myChart.setDataURL(ConstructHttpString(xmlUrl)); //获取xml格式数据源
            myChart.set
            myChart.addParam("wmode", "Opaque");
            myChart.render(divId);
        }

        //画图 (以指定 xml格式字符串为数据源)
        function DrawChart2(divId, flashFileName, width, height) {
            var myChartId = new Date().getTime();
            var myChart = new FusionCharts("FusionChart/" + flashFileName, myChartId, width, height);
            myChart.setDataXML('<chart caption="逗你玩" numberPrefix="$"><set value="25" label="Item A" color="AFD8F8" /><set value="17" label="Item B" color="F6BD0F" /><set value="23" label="Item C" color="8BBA00" isSliced="1" /></chart>');
            myChart.addParam("wmode", "Opaque");
            myChart.render(divId);
        }
        //柱状图
        DrawChart("divBarChart", "StackedColumn2D.swf", "831", "396", "dataXml.xml");
        //饼状图
        DrawChart("divPieChart", "Pie2D.swf", "831", "396", "xml.aspx");
        //饼状图
        DrawChart2("divPieChart2", "Pie2D.swf", "500", "396");
    </script>
</body>
</html>
上面是,前端页面上的使用,可以看出:其用法很简单,对于绘制柱状图或是饼状图等,对于使用唯一的区别就是:指定不同的展示flash文件和相应的xml格式内容(具体每种chart图表对应的xml文件格式,请查看官网Demo)。其方法主要方法有:
- setDataURL:设置数据源Url,以指定 xml格式文件为数据源
- setDataXML:设置数据源xml内容,以指定 xml格式字符串为数据源
(网上说有个setJSONData的方法,可以设置json对象作为数据源,但应该是老版本或整合修改后的js文件,没找到,所以直接设置json对象作为数据源貌似不行!)
using System;

namespace Web_Client.pieChart
{
    public partial class xml : System.Web.UI.Page
    {
        protected void Page_Load(object sender, EventArgs e)
        {
            Response.ContentType = "text/xml; characterset=utf-8";
            Response.BinaryWrite(new byte[] { 0xEF, 0xBB, 0xBF });
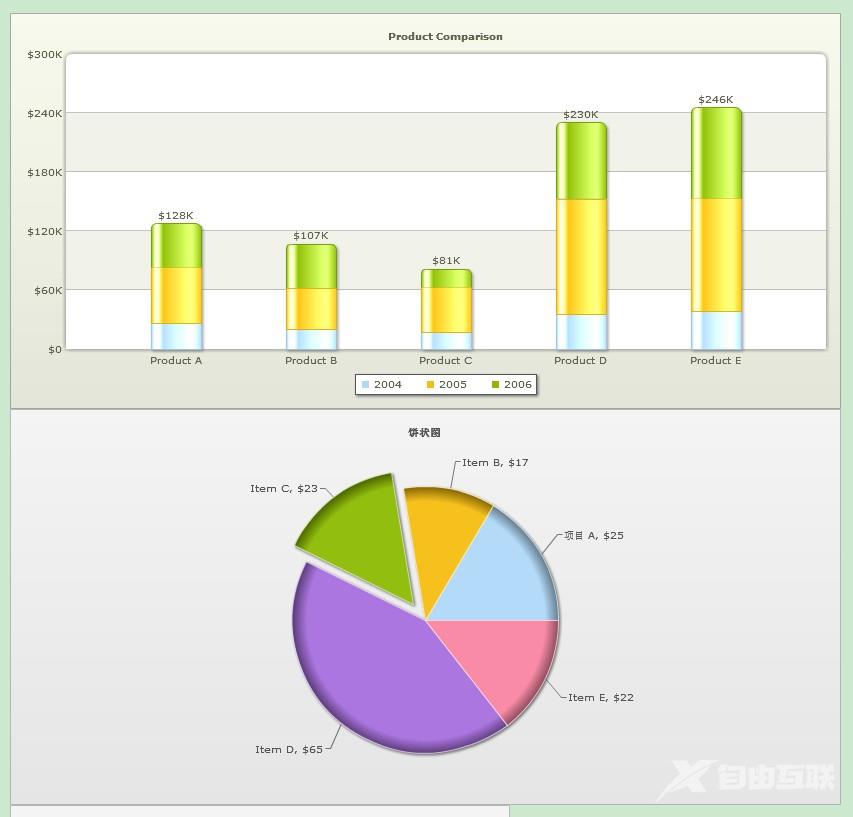
            Response.Write("<chart caption=\"饼状图\" numberPrefix=\"$\"><set value=\"25\" label=\"项目 A\" color=\"AFD8F8\" /><set value=\"17\" label=\"Item B\" color=\"F6BD0F\" /><set value=\"23\" label=\"Item C\" color=\"8BBA00\" isSliced=\"1\" />   <set value=\"65\" label=\"Item D\" color=\"A66EDD\" /><set value=\"22\" label=\"Item E\" color=\"F984A1\" /></chart>");
            Response.End();
        }
    }
}
以上是在后台代码中输出xml格式文件为数据源,需要注意的是:Response.ContentType = "text/xml; characterset=utf-8";Response.BinaryWrite(new byte[] { 0xEF, 0xBB, 0xBF });——这两行代码是不可缺少的,其作用是:指定输出xml文件的编码和解决中文乱码问题!
效果图如下:

以上就是本文的全部内容,希望对大家的学习有所帮助,也希望大家多多支持易盾网络。
