目录 效果图 代码部分 总结 效果图 代码部分 methods: { mychart1(data) { this.myChart = echarts.init(document.getElementById('profitTotal')); let echartData = []; if(data) { echartData = data; } else { echartData = []; } let
目录
- 效果图
- 代码部分
- 总结
效果图
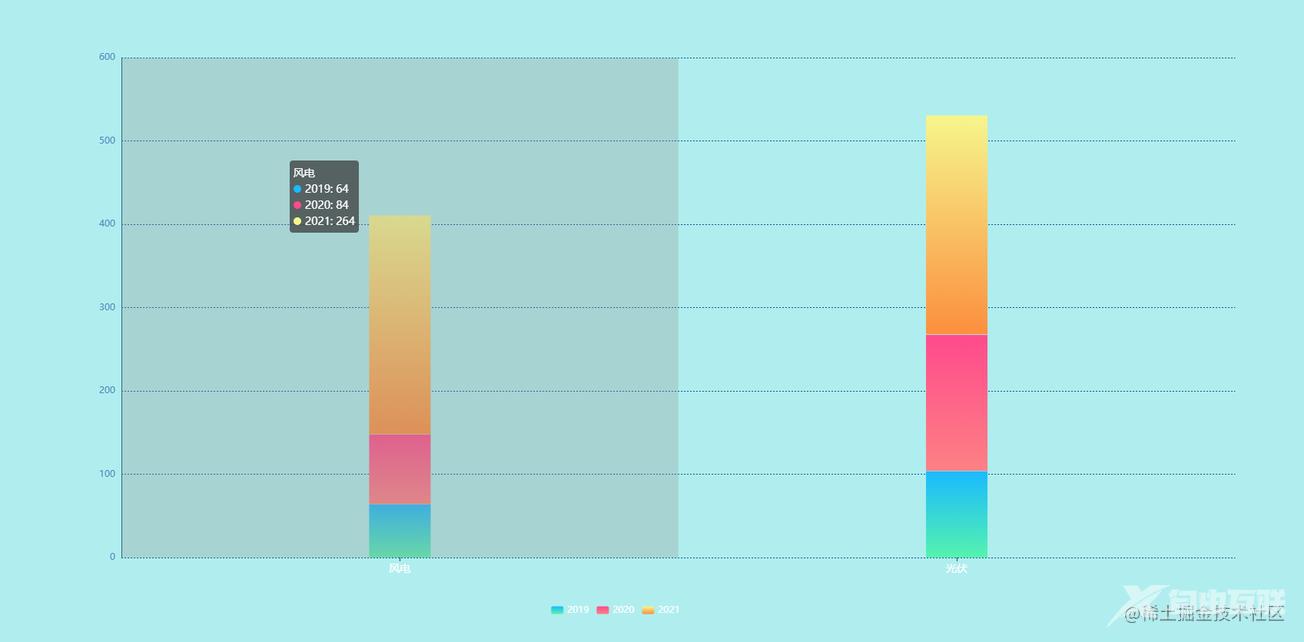
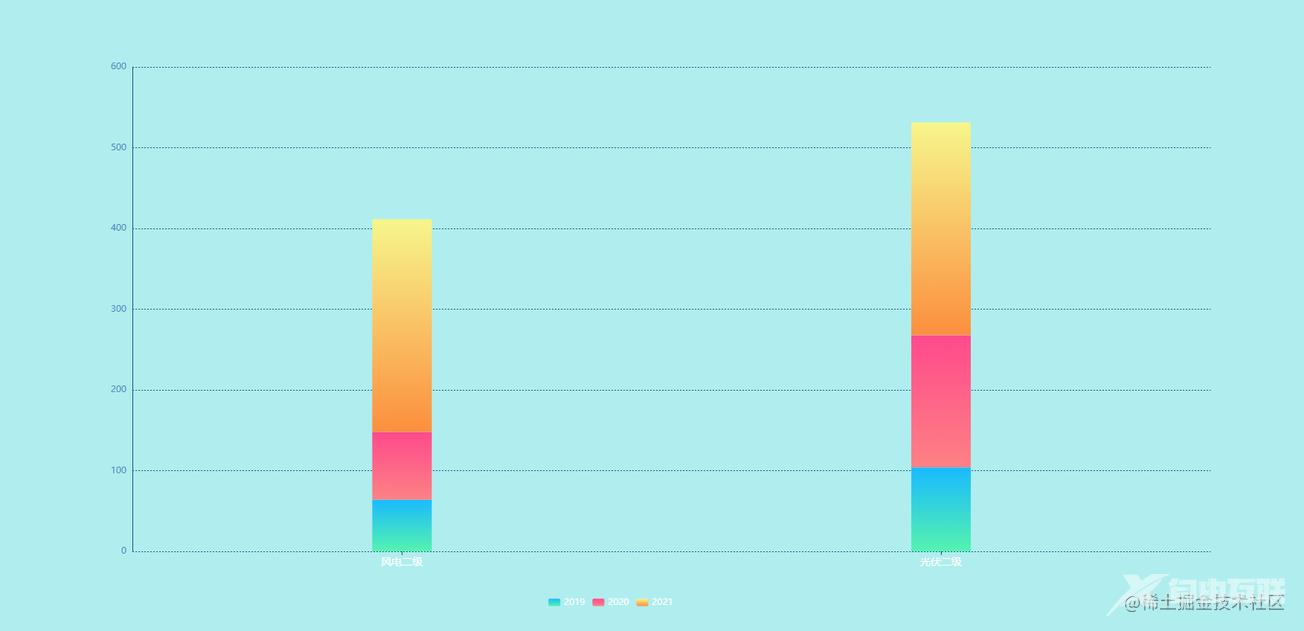
代码部分
methods: {
    mychart1(data) {
        this.myChart = echarts.init(document.getElementById('profitTotal'));
        let echartData = [];
        if(data) {
            echartData = data;
        } else {
            echartData = [];
        }
        let xAxisData = echartData.map(v => v.name);
        let yAxisData1 = echartData.map(v => v.value1);
        let yAxisData2 = echartData.map(v => v.value2);
        let yAxisData3 = echartData.map(v => v.value3);
        option = {
            tooltip: {
                trigger: 'axis',
                axisPointer: {
                    type: 'shadow'
                }
            },
            legend: {
                data: ['2019', '2020','2021'],
                orient: "horizontal",//vertical
                x: 'center',
                // y: 'bottom',
                // right: '-50%',
                bottom: '4%',
                icon: "roundRect",
                selectedMode: false,//取消图例上的点击事件
                itemWidth: 16,  // 设置宽度
                itemHeight: 10, // 设置高度
                itemGap: 10,// 设置间距
                textStyle: {//文字根据legend显示
                    color: "#FFFFFF",
                    fontSize: 12,
                },
            },
            grid: {
                left: '15%',
                top: '20%',
                right: '8%',
                bottom: '10%',
                containLabel: true
            },
            xAxis: {
                type: 'category',
                triggerEvent: true,
                // data: ['风电', '光伏'],
                data: xAxisData,
                axisLine: {
                    show: false
                },
                axisLabel: {
                    color: "#FFFFFF",
                    fontSize: '14',
                    // interval: 0,
                    // rotate: rotate//文字旋转角度
                },
                axisTick: {
                    // show: false,
                    alignWithLabel: true,
                    lineStyle: {
                        color: '#0C4F81',
                        type: 'solid'
                    }
                },
            },
            yAxis: {
                type: 'value',
                nameTextStyle: {
                    color: '#4F88BD',
                    padding: [0, 25, -5, 0],
                    fontSize: 12,
                    fontFamily: 'Microsoft YaHei',
                },
                axisLine: {
                    show: true,
                    lineStyle: {
                        color: "#0C4F81"
                    }
                },
                axisLabel: {
                    color: "#4F88BD",
                    fontSize: '12',
                    formatter: '{value}'
                },
                splitLine: {
                    lineStyle: {
                        type: "dotted",
                        color: "#0C4F81"
                    }
                },
                axisTick: {
                    show: false
                },
            },
            series: [
                {
                    name: '2019',
                    type: 'bar',
                    barMaxWidth: 80,
                    stack: 'Ad',
                    emphasis: {
                        focus: 'series'
                    },
                    itemStyle: {
                        normal: {
                            label: {
                                show: false,
                                position: 'top',
                                color: '#ffffff'
                            },
                            color: new echarts.graphic.LinearGradient(0, 0, 0, 1, [{
                                offset: 0,
                                color: "rgba(25, 186, 255, 1)"
                            },
                            {
                                offset: 1,
                                color: "rgba(85, 243, 174, 1)"
                            }
                            ]),
                        }
                    },
                    data: yAxisData1
                },
                {
                    name: '2020',
                    type: 'bar',
                    barMaxWidth: 80,
                    stack: 'Ad',
                    emphasis: {
                        focus: 'series'
                    },
                    itemStyle: {
                        normal: {
                            label: {
                                show: false,
                                position: 'top',
                                color: '#ffffff'
                            },
                            color: new echarts.graphic.LinearGradient(0, 0, 0, 1, [{
                                offset: 0,
                                color: "rgba(255, 74, 140, 1)"
                            },
                            {
                                offset: 1,
                                color: "rgba(253, 129, 132, 1)"
                            }
                            ]),
                        }
                    },
                    data: yAxisData2
                },
                {
                    name: '2021',
                    type: 'bar',
                    barMaxWidth: 80,
                    stack: 'Ad',
                    emphasis: {
                        focus: 'series'
                    },
                    itemStyle: {
                        normal: {
                            label: {
                                show: false,
                                position: 'top',
                                color: '#ffffff'
                            },
                            color: new echarts.graphic.LinearGradient(0, 0, 0, 1, [{
                                offset: 0,
                                color: "#F6F68C"
                            },
                            {
                                offset: 1,
                                color: "#FC8F3E"
                            }
                            ]),
                        }
                    },
                    data: yAxisData3
                },
            ]
        };
        this.myChart.clear();
        this.myChart.setOption(option);
        this.echarClickfun(this.myChart);
    },
    //图表点击事件封装
    //
    echarClickfun(myChart) {
        var _this = this;
        myChart.off('click');
        myChart.on('click', function (params) {
            if (params.componentType == "xAxis") {//点击x轴标签xAxis
                _this.getchart(params.value);
            } else if(params.componentType == "yAxis") {//点击y轴标签yAxis
                _this.getchart(params.value);
            } else {//点击柱子柱子
            }
        })
    },
    //获取二级数据重新渲染
    getchart(data) {
       ajaxGet('接口地址', { "province": data }, res => {
            if (res.state !== 1) {
                this.$message({
                    message: res.value || '接口报错',
                    type: 'error'
                });
                return;
            }
            var echartData = res.value || [];//获取二级数据
            this.mychart1(echartData);
        })
    }
}
注:echarClickfun里边点击事件根据自己实际情况写就可以,我这里是把三种情况都列举出来了,这里还需要一个默认图表一级数据,大家真正实际写的时候加上获取接口数据就好了。
总结
到此这篇关于Echarts图表点击x轴y轴切换图表二级数据的文章就介绍到这了,更多相关Echarts切换图表二级数据内容请搜索自由互联以前的文章或继续浏览下面的相关文章希望大家以后多多支持自由互联!