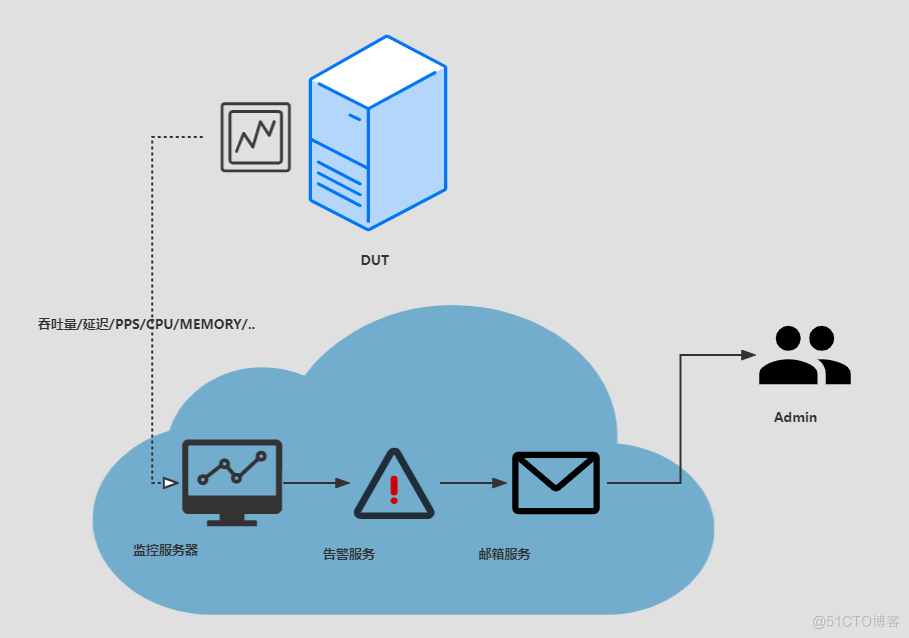
一、拓扑
二、prometheus 部署
去官网下载一个对应平台的安装包https://prometheus.io/download/
下载2.37.1 release版本
[root@localhost monitor]# wget https://github.com/prometheus/prometheus/releases/download/v2.37.1/prometheus-2.37.1.linux-amd64.tar.gz
下载后解压
[root@localhost monitor]# tar zxvf prometheus-2.37.1.linux-amd64.tar.gz
把prometheus的服务写成系统服务
[root@localhost monitor]# mv /root/monitor/prometheus-2.37.1.linux-amd64/prometheus /usr/local/bin/ [root@localhost monitor]# cat <<EOF > /usr/lib/systemd/system/prometheus.service[Unit]Description=prometheus[Service]Type=simpleExecStart=/usr/local/bin/prometheus --config.file=/root/monitor/prometheus-2.37.1.linux-amd64/prometheus.yml --web.enable-lifecycleSuccessExitStatus=143Restart=alwaysRestartSec=3[Install]WantedBy=multi-user.targetEOF
加上执行权限
chmod 755 /usr/lib/systemd/system/prometheus.service
开机自启动服务
systemctl start prometheussystemctl enable prometheus
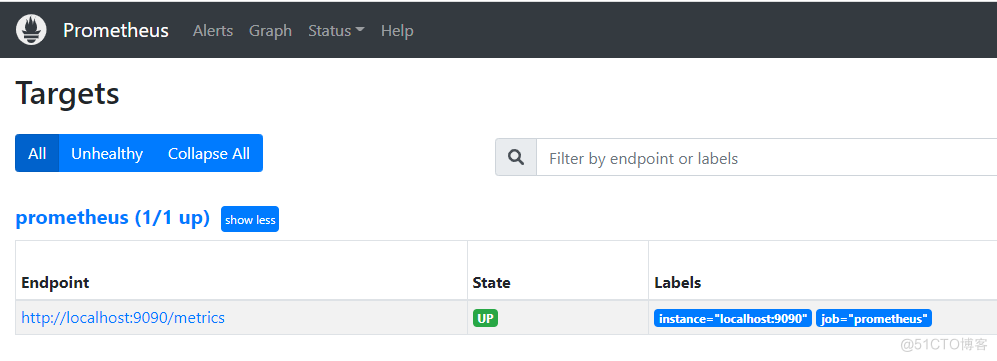
IP:9090即可登录prometheus web
三、alertmanager部署
下载 https://prometheus.io/download/
wget https://github.com/prometheus/alertmanager/releases/download/v0.24.0/alertmanager-0.24.0.linux-amd64.tar.gz[root@localhost monitor]# tar zxvf alertmanager-0.24.0.linux-amd64.tar.gz
安装成系统服务
[root@localhost monitor]# mv alertmanager-0.24.0.linux-amd64/alertmanager /usr/local/bincat <<EOF > /usr/lib/systemd/system/alertmanager.service[Unit]Descriptinotallow=alertmanager[Service]Type=simpleExecStart=/usr/local/bin/alertmanager --cluster.advertise-address=0.0.0.0:9093 --config.file=/root/monitor/alertmanager-0.24.0.linux-amd64/alertmanager.ymlSuccessExitStatus=143Restart=alwaysRestartSec=3[Install]WantedBy=multi-user.targetEOFchmod 755 /usr/lib/systemd/system/alertmanager.service
开机自启动
systemctl start alertmanager.servicesystemctl enable alertmanager.service
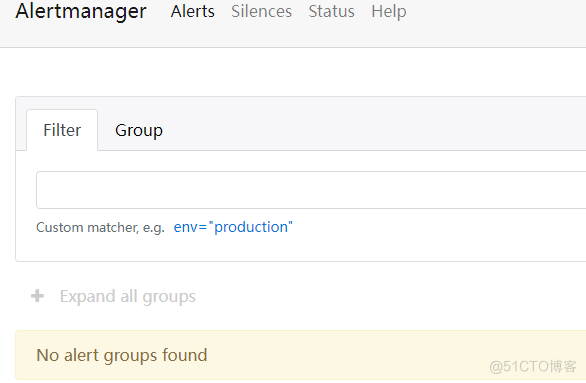
web登录alertmanager
ip:9093
四、grafana部署
[root@localhost monitor]# wget https://dl.grafana.com/enterprise/release/grafana-enterprise-9.2.3-1.x86_64.rpm[root@localhost monitor]# yum localinstall grafana-enterprise-9.2.2-1.x86_64.rpm -ysystemctl start grafana-serversystemctl enable grafana-server
web登录
IP:3000 默认用户名密码为admin/admin
五、客户端node_exporter部署
wget https://github.com/prometheus/node_exporter/releases/download/v1.4.0/node_exporter-1.4.0.linux-amd64.tar.gztar zxvf node_exporter-1.4.0.linux-amd64.tar.gz
也可以写成系统服务,简单运行的话直接运行在后台即可
./node_exporter &
在服务端配置该客户端的监听
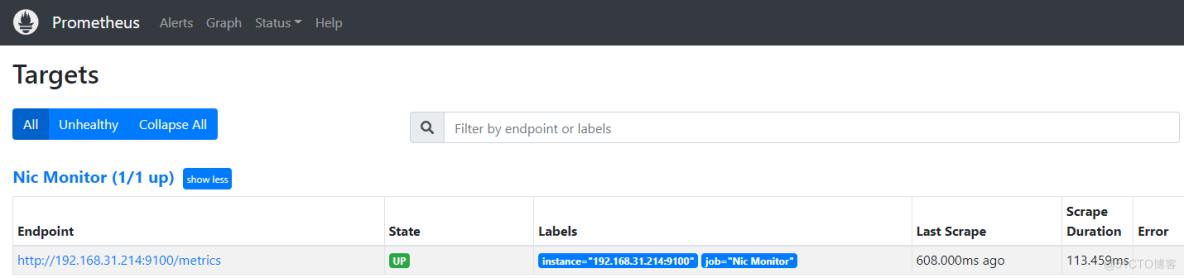
vim prometheus-2.37.1.linux-amd64/prometheus.yml - job_name: "Nic Monitor" static_configs: - targets: ["192.168.31.214:9100"]
已经监控生效
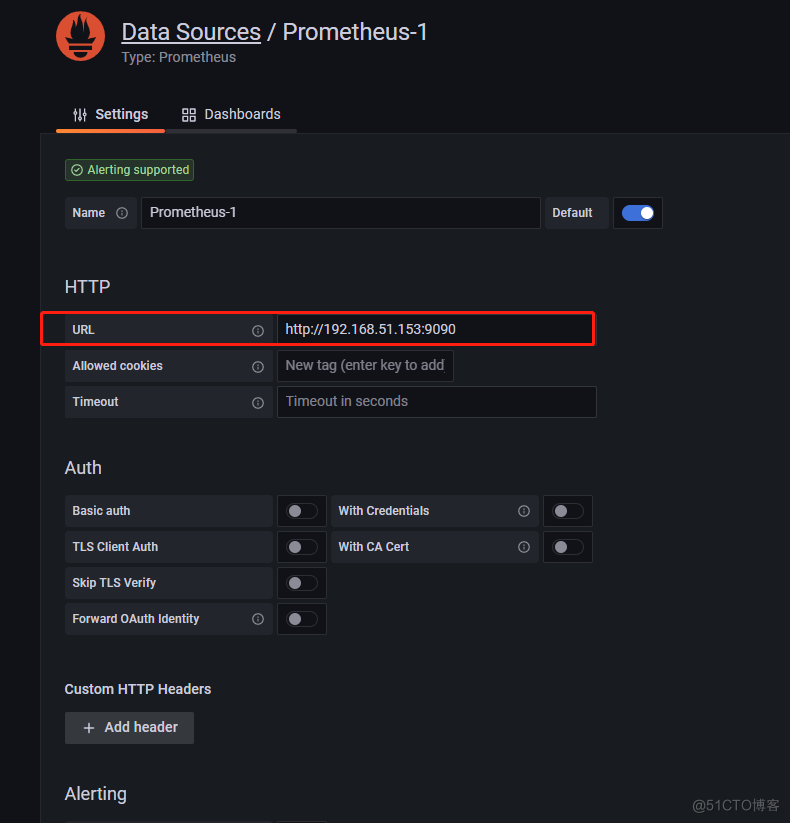
六、配置grafana
配置数据源,这里没有额外用influxdb,直接选择prometheus即可
配置dashboard,去https://grafana.com/grafana/dashboards/下载自己需要的模板,然后导入
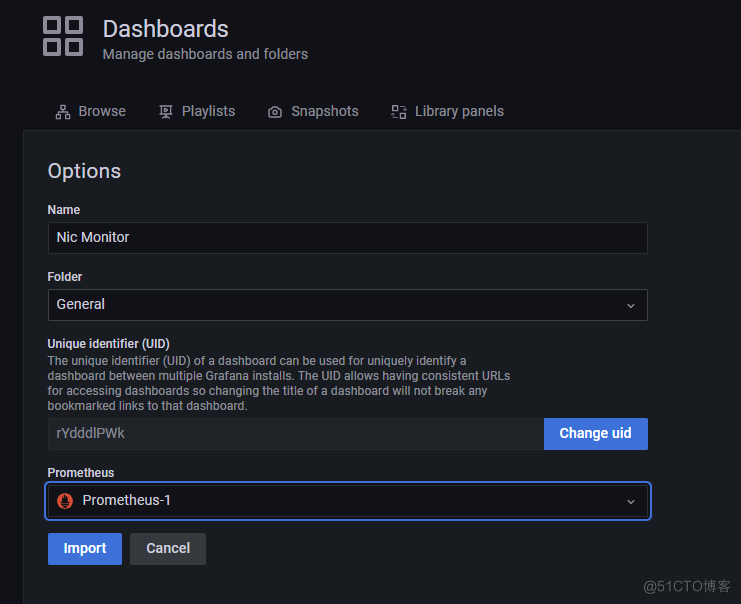
可以自己自定义修改模板
七、配置告警
prometheus通过PromQL设置自己需要的监控项,根据对监控数据做运算后得出想要的监控项,并发送给alertmanager进行路由处理。
prometheus.yml增加配置
rule_files:
- "/root/monitor/rules/*.rules"
在该目录下自定义各类rules
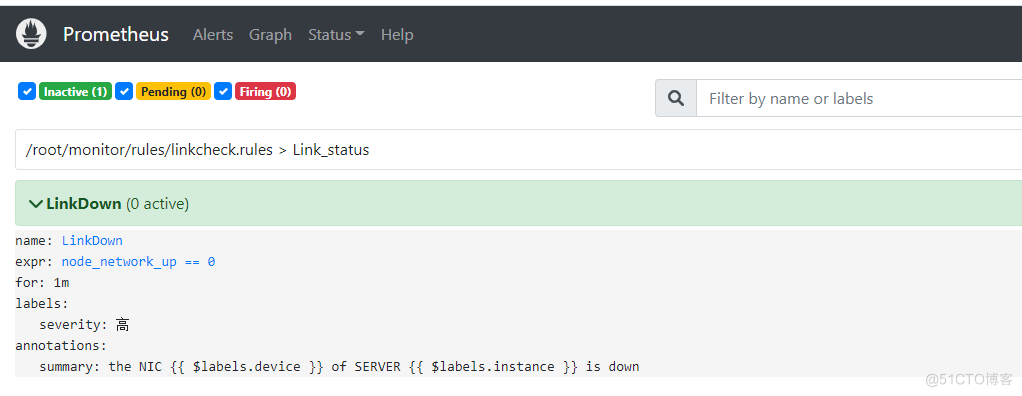
自定义rules规则,这些固定下来就不需要动了,当alert状态到Firing的时候就会发送到alertmanager
配置网卡link的检查项(后续可以check其他项,如CPU,内存,流量等)
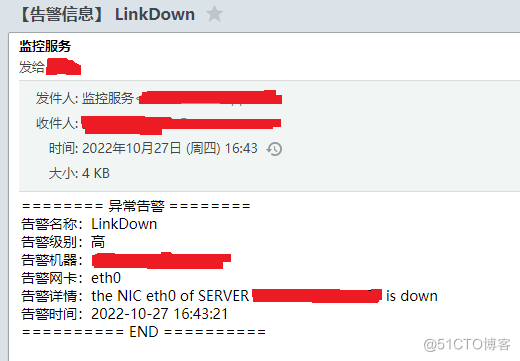
groups:- name: Link_status rules:# Alert for any instance that is unreachable for >1 minutes. - alert: LinkDown expr: node_network_up == 0 for: 1m labels: severity: 高 annotations: summary: "the NIC {{ $labels.device }} of SERVER {{ $labels.instance }} is down"
配置告警设置
因为触发了alert后,prometheus会发送到alertmanager
在prometheus.yml文件中配置alertmanager
alerting: alertmanagers: - static_configs: - targets: ['localhost:9093']
在alertmanager配置router和receivers。
alertmanager支持对告警消息的分组,抑制和静默。
可以匹配alert里面的各类标签进行分组,并路由到不同的receiver去。
这里没什么需求的话就设置一个顶部路由即可。
附alertmanager配置文件和邮件模板
alertmanager.yml
global: resolve_timeout: 5m smtp_from: '发件的邮箱' smtp_smarthost: 'smtp.qq.com:465' smtp_auth_username: '改成你的邮箱' smtp_auth_password: '改成你邮箱的密码' smtp_require_tls: false smtp_hello: 'qq.com'templates: - '/root/monitor/alertmanager-0.24.0.linux-amd64/email.tmpl'route: group_by: ['device'] group_wait: 10s group_interval: 1m repeat_interval: 1h receiver: 'manager'receivers: - name: 'manager' email_configs: - to: wangxiao@mucse.com headers: { Subject: " 【告警信息】 {{ .CommonLabels.alertname }} " } html: '{{ template "email.to.html" . }}' send_resolved: trueinhibit_rules: - source_match: severity: 'critical' target_match: severity: 'warning' equal: ['alertname', 'dev', 'instance']
邮件模板
{{ define "email.from" }}管理员{{ end }}{{ define "email.to" }}xxxxxxxx@qq.com{{ end }}{{ define "email.to.html" }}{{- if gt (len .Alerts.Firing) 0 -}}{{- range $index, $alert := .Alerts -}}======== 异常告警 ========<br>告警名称:{{ $alert.Labels.alertname }}<br>告警级别:{{ $alert.Labels.severity }}<br>告警机器:{{ $alert.Labels.instance }}<br>告警网卡:{{ $alert.Labels.device }}<br>告警详情:{{ $alert.Annotations.summary }}<br>告警时间:{{ ($alert.StartsAt.Add 28800e9).Format "2006-01-02 15:04:05" }}<br>========== END ==========<br>{{- end }}{{- end }}{{- if gt (len .Alerts.Resolved) 0 -}}{{- range $index, $alert := .Alerts -}}======== 告警恢复 ========<br>告警名称:{{ $alert.Labels.alertname }}<br>告警级别:{{ $alert.Labels.severity }}<br>告警机器:{{ $alert.Labels.instance }}<br>告警网卡:{{ $alert.Labels.device }}<br>告警详情:{{ $alert.Annotations.summary }}<br>告警时间:{{ ($alert.StartsAt.Add 28800e9).Format "2006-01-02 15:04:05" }}<br>恢复时间:{{ ($alert.EndsAt.Add 28800e9).Format "2006-01-02 15:04:05" }}<br>========== END ==========<br>{{- end }}{{- end }}{{- end }}
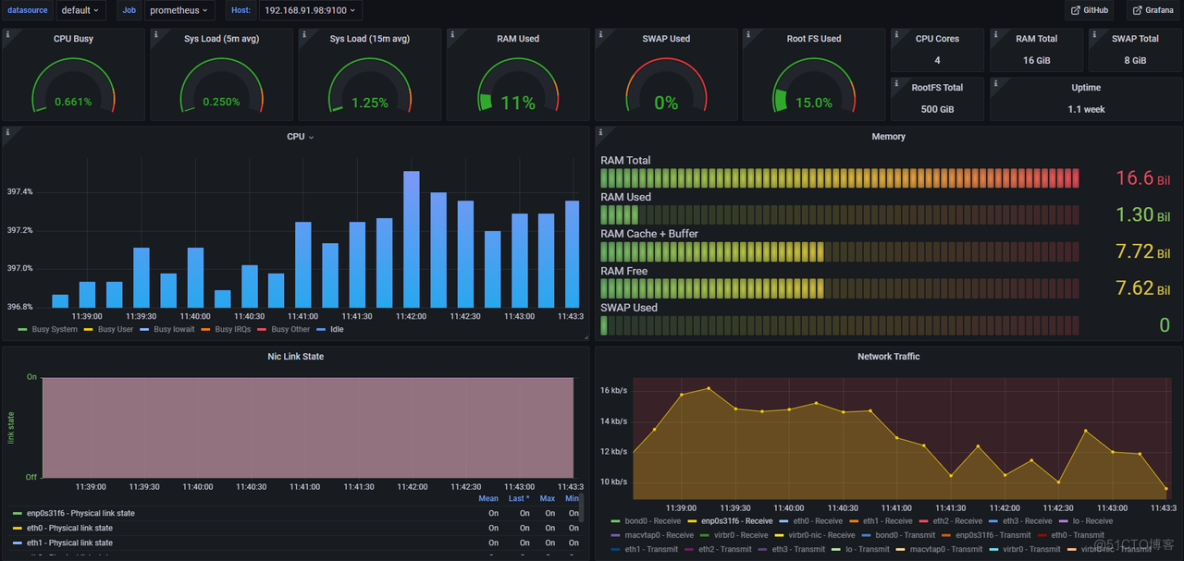
七、演示
数据监控
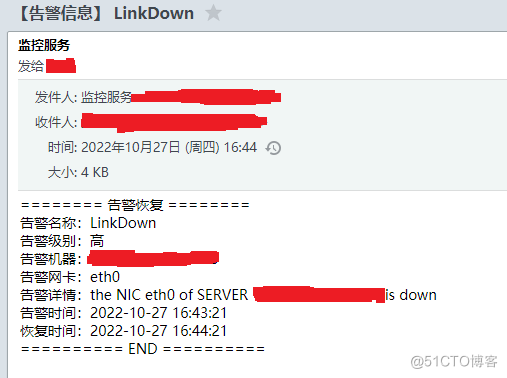
告警邮件
恢复邮件