Prometheus 是一个开放性的监控解决方案,用户可以非常方便的安装和使用 Prometheus 并且能够非常方便的对其进行扩展。
在Prometheus的架构设计中,Prometheus Server 并不直接服务监控特定的目标,其主要任务负责数据的收集,存储并且对外提供数据查询支持。因此为了能够能够监控到某些东西,如主机的CPU使用率,我们需要使用到Exporter。Prometheus周期性的从Exporter暴露的HTTP服务地址(通常是/metrics)拉取监控样本数据。
Exporter可以是一个相对开放的概念,其可以是一个独立运行的程序独立于监控目标以外,也可以是直接内置在监控目标中。只要能够向Prometheus提供标准格式的监控样本数据即可。
1 环境配置
我们在 Windows 下安装 Prometheus。
1.1 安装 Prometheus
下载地址:https://prometheus.io/download/
选择 Windows 安装包,我选择的是prometheus-2.41.0.windows-amd64, 下载完成后解压,直接运行 prometheus.exe 即可。
prometheus默认端口是9090,在浏览器访问:http://localhost:9090,即可看到项目已经在运行。
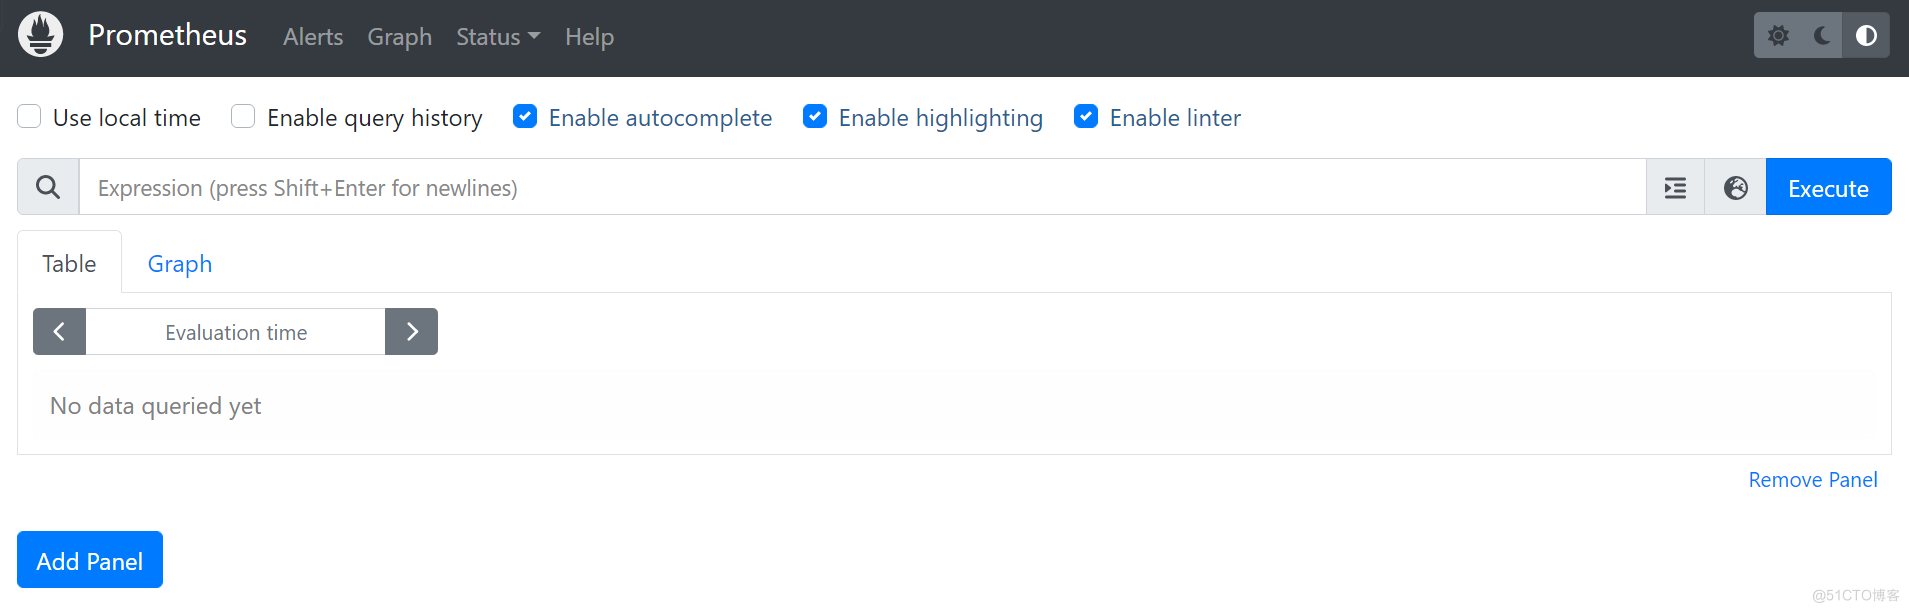
Prometheus 的相关配置可以在 prometheus.yaml 中修改。
1.2 安装 NodeExporter
NodeExporter 是 Prometheus 提供的一个可以采集到主机信息的应用程序,它能采集到机器的 CPU、内存、磁盘等信息。
下载地址: https://prometheus.io/download/
选择 Windows 版本,我选择的是windows_exporter-0.20.0-amd64,下载完成后直接运行 windows_exporter-0.20.0-amd64.exe 文件即可。
windows_exporter默认端口是9182,通过浏览器访问:http://localhost:9182/metrics,
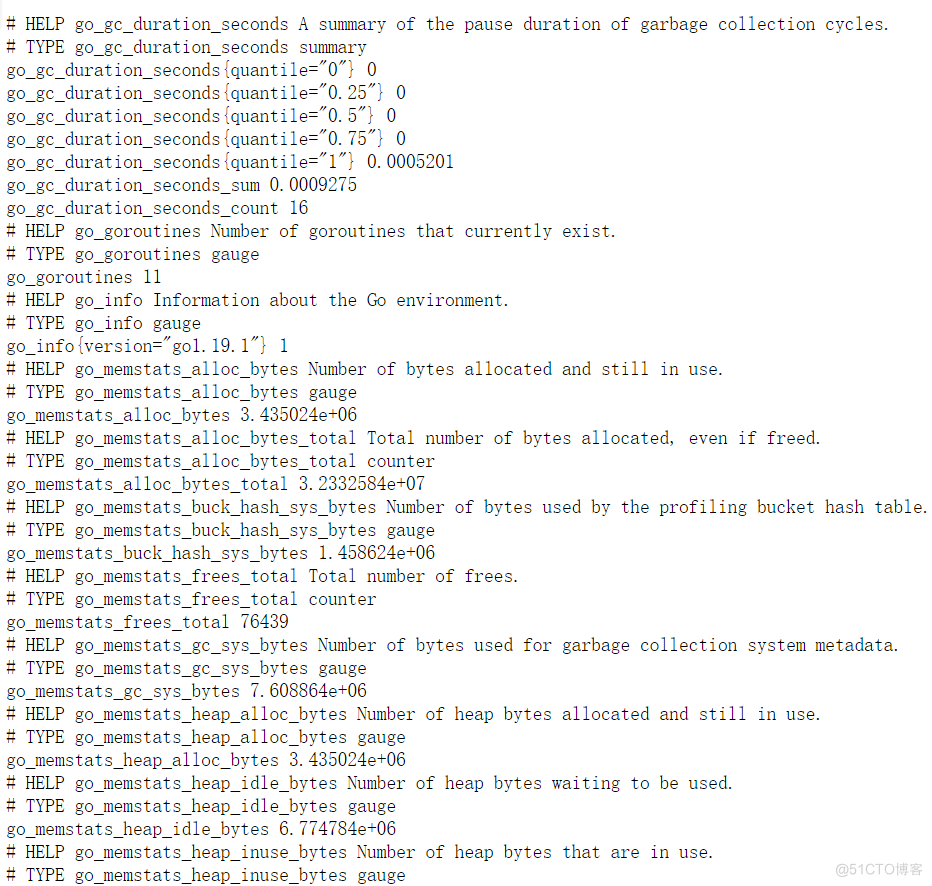
可以看到当前 node exporter 获取到的当前主机的所有监控数据。 其中 HELP 用于解释当前指标的含义,TYPE 则说明当前指标的数据类型。
2 添加数据源
编辑 prometheus 的配置文件 prometheus.yml,将scrape_configs修改为如下内容:
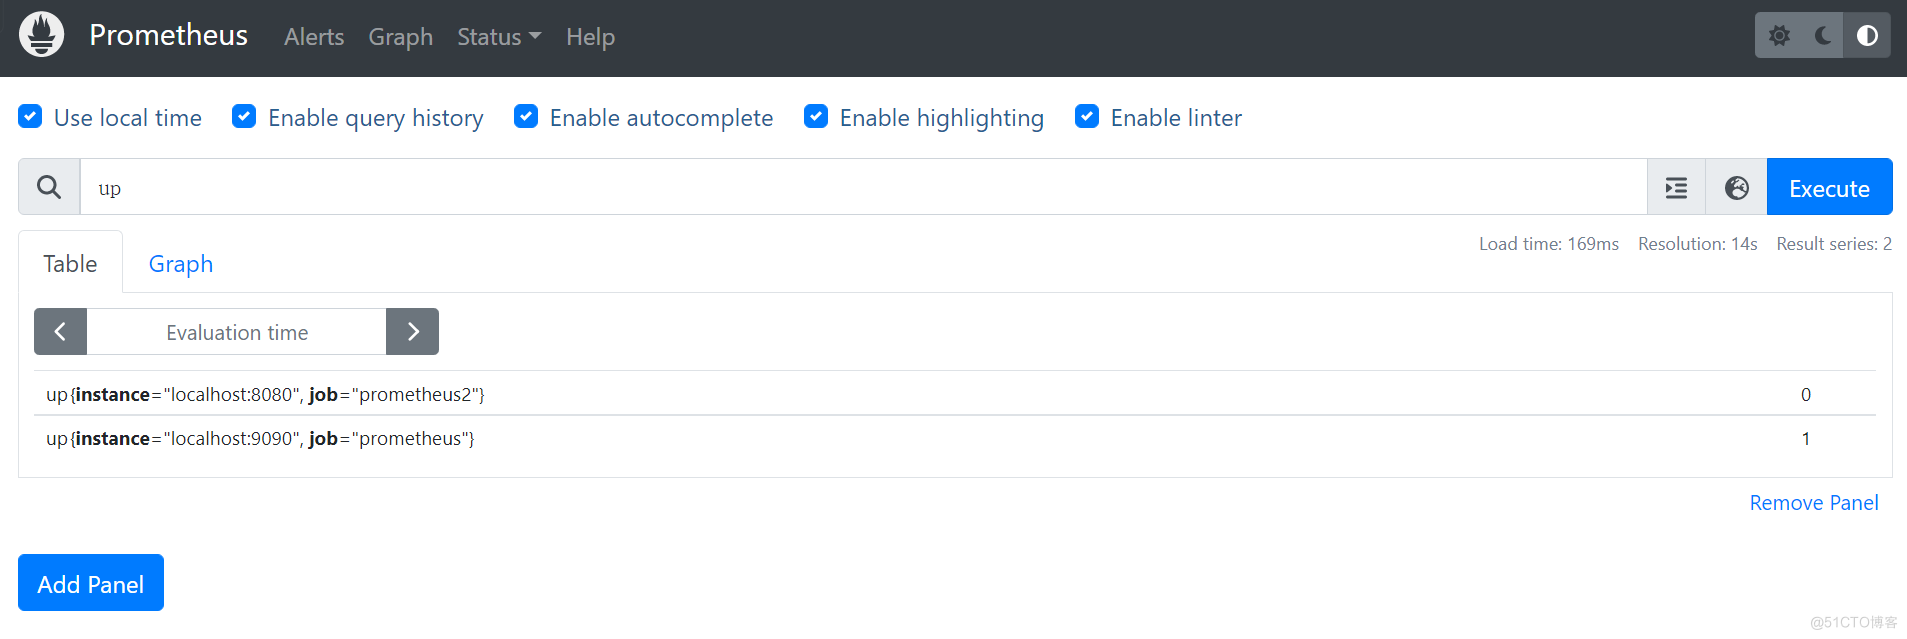
scrape_configs: - job_name: "prometheus" static_configs: - targets: ["localhost:9090"] # node exporter 监控源 - job_name: 'prometheus2' static_configs: - targets: ['localhost:8080']即配置了两个任务。一个名为 prometheus,其从「localhost:9090」地址读取数据。另一个名为 prometheus2,其从「localhost:8080」地址读取数据。 然后重启 Prometheus。
浏览器访问:http://localhost:9090,在搜索框输入up,点击execute,即可看到我们配置的两个任务:
3 自定义写入的数据
新建 SpringBoot 项目。完整项目地址:
GitHub地址:https://github.com/Snowstorm0/learn-prometheus
Gitee地址:https://gitee.com/Snowstorm0/learn-prometheus
在 service 层编写插入数据的代码:
public void insertPrometheus() { meterRegistry.clear(); setIdList(); setNameMap(); setValueMap(); for (String id : idList) { List<Tag> list = new ArrayList<>(); list.add(Tag.of("id", id)); list.add(Tag.of("name", nameMap.get(id))); String name = "insertPrometheus"; double value = Double.parseDouble(String.valueOf(valueMap.get(id))); meterRegistry.gauge(name, Tags.of(list), value); } }在 controller 层编写读取的代码:
@RequestMapping(value = "/metric/custom", method = RequestMethod.GET,produces = "text/plain; charset=utf-8") public Object metric() { return prometheusMeterRegistry.scrape(); }用浏览器或者Postman访问: http://localhost:8081/metric/custom
可以看到写入的数据:
# HELP insertPrometheus # TYPE insertPrometheus gauge insertPrometheus{id="1002",name="钱二",} 1002.0 insertPrometheus{id="1001",name="赵一",} 1001.0 insertPrometheus{id="1003",name="孙三",} 1003.0这里的数据是放在本地的,可以供 Prometheus 读取。
4 更新数据
在 service 层编写插入数据的代码:
public void updatePrometheus() { String name = "updatePrometheus"; List<Tag> list = new ArrayList<>(); list.add(Tag.of("id", "1001")); list.add(Tag.of("name", "测试更新")); // 通过引用的方式将 Prometheus 的 value 存入 valueMap,修改 valueMap 即可修改 Prometheus updateValueMap.put("1001", meterRegistry.gauge(name, Tags.of(list), new AtomicDouble(0))); for (int value = 0; value < 12; value++) { try { updateValueMap.get("1001").set(value); // 修改 valueMap 中的 value Thread.sleep(5 * 1000); // 暂停5秒 } catch (InterruptedException e) { e.printStackTrace(); } } }用浏览器或者Postman访问: http://localhost:8081/metric/custom
可以看到写入的数据:
updatePrometheus{id="1001",name="测试更新",} 1.0
学习更多编程知识,请关注我的公众号:
代码的路