目录 前言 格子颜色表 渐变色带 前言 在做色彩相关的算法分析时候,经常需要使用规则的颜色表来进行辅助。下面用python(numpy和opencv)来生成颜色表并保存为图片。 有两种类型: 格
目录
- 前言
- 格子颜色表
- 渐变色带
前言
在做色彩相关的算法分析时候,经常需要使用规则的颜色表来进行辅助。下面用python(numpy和opencv)来生成颜色表并保存为图片。
有两种类型:
- 格子形状的颜色表
- 渐变色带
长的样子分别如下:
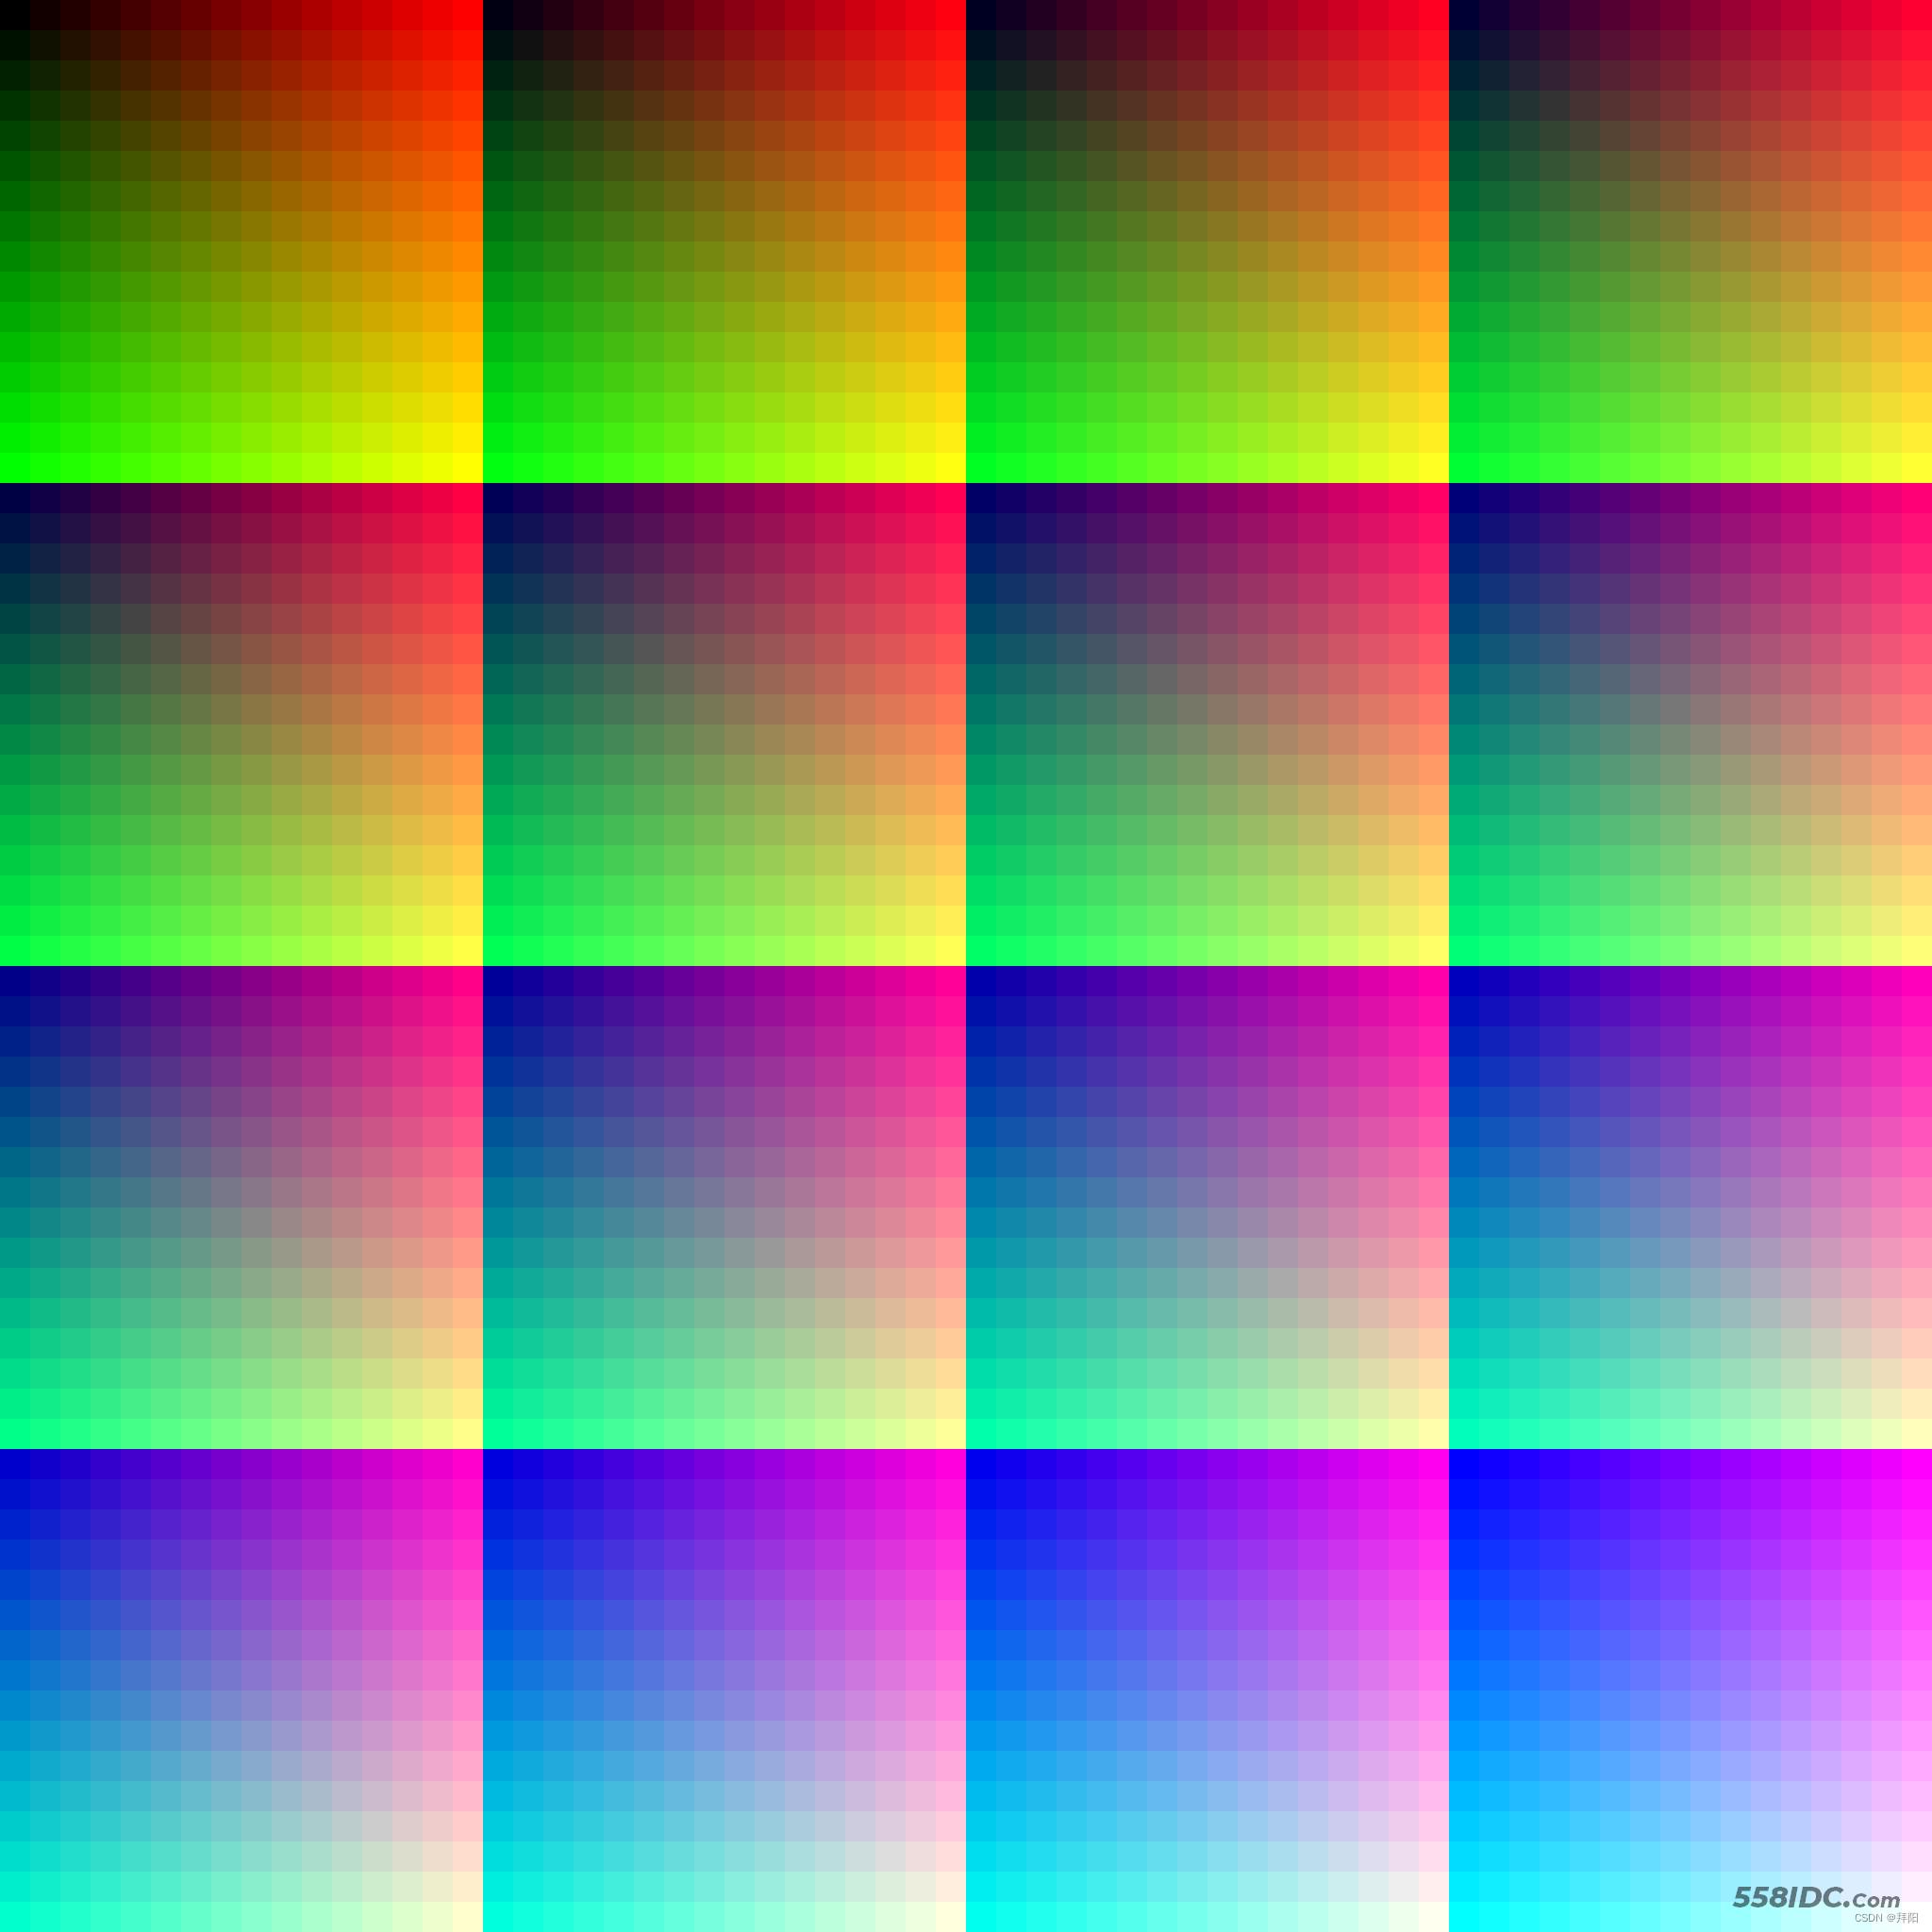
格子颜色表
这里需要注意,当划分的颜色数量比较少时,最好把一个颜色像素扩展成为一个格子,不然的话整个图看起来就太小了。
# -*- coding: utf-8 -*-
import cv2
import numpy as np


def generate_color_chart(block_num=18,
                         block_columns=6,
                         grid_width=32,
                         grid_height=None):
    """
    Generate color chart by uniformly distributed color indexes, only support
    8 bit (uint8).

    Parameters
    ----------
    block_num: Block number of color chart, also the number of color indexes.
    block_columns: Column number of color chart. Row number is computed by
        block_num / block_columns
    grid_width: Width of color grid
    grid_height: Height of color grid. If not set, it will equal to grid_width.
    """
    color_index = np.linspace(0, 255, block_num)
    color_index = np.uint8(np.round(color_index))

    if grid_height is None:
        grid_height = grid_width

    # compute sizes
    block_rows = np.int_(np.ceil(block_num / block_columns))
    block_width = grid_width * block_num
    block_height = grid_height * block_num
    width = block_width * block_columns
    height = block_height * block_rows
    result = np.zeros((height, width, 3), dtype=np.uint8)

    # compute red-green block, (blue will be combined afterward)
    red_block, green_block = np.meshgrid(color_index, color_index)
    red_block = expand_pixel_to_grid(red_block, grid_width, grid_height)
    green_block = expand_pixel_to_grid(green_block, grid_width, grid_height)
    rg_block = np.concatenate([red_block, green_block], axis=2)

    # combine blue channel
    for i in range(block_num):
        blue = np.ones_like(rg_block[..., 0], dtype=np.uint8) * color_index[i]
        color_block = np.concatenate([rg_block, blue[..., np.newaxis]], axis=2)
        # compute block index
        block_row = i // block_columns
        block_column = i % block_columns
        xmin = block_column * block_width
        ymin = block_row * block_height
        xmax = xmin + block_width
        ymax = ymin + block_height
        result[ymin:ymax, xmin:xmax, :] = color_block

    result = result[..., ::-1]  # convert from rgb to bgr
    return result


def expand_pixel_to_grid(matrix, grid_width, grid_height):
    """
    Expand a pixel to a grid. Inside the grid, every pixel have the same value
    as the source pixel.

    Parameters
    ----------
    matrix: 2D numpy array
    grid_width: width of grid
    grid_height: height of grid
    """
    height, width = matrix.shape[:2]
    new_heigt = height * grid_height
    new_width = width * grid_width
    repeat_num = grid_width * grid_height

    matrix = np.expand_dims(matrix, axis=2).repeat(repeat_num, axis=2)
    matrix = np.reshape(matrix, (height, width, grid_height, grid_width))
    # put `height` and `grid_height` axes together;
    # put `width` and `grid_width` axes together.
    matrix = np.transpose(matrix, (0, 2, 1, 3))
    matrix = np.reshape(matrix, (new_heigt, new_width, 1))
    return matrix


if __name__ == '__main__':
    color_chart16 = generate_color_chart(block_num=16,
                                         grid_width=32,
                                         block_columns=4)
    color_chart18 = generate_color_chart(block_num=18,
                                         grid_width=32,
                                         block_columns=6)
    color_chart36 = generate_color_chart(block_num=36,
                                         grid_width=16,
                                         block_columns=6)
    color_chart52 = generate_color_chart(block_num=52,
                                         grid_width=8,
                                         block_columns=13)
    color_chart256 = generate_color_chart(block_num=256,
                                          grid_width=1,
                                          block_columns=16)

    cv2.imwrite('color_chart16.png', color_chart16)
    cv2.imwrite('color_chart18.png', color_chart18)
    cv2.imwrite('color_chart36.png', color_chart36)
    cv2.imwrite('color_chart52.png', color_chart52)
    cv2.imwrite('color_chart256.png', color_chart256)
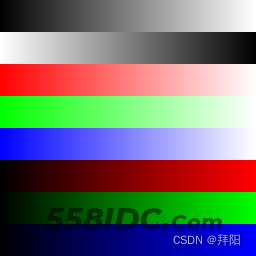
渐变色带
# -*- coding: utf-8 -*-
import cv2
import numpy as np


def generate_color_band(left_colors, right_colors, grade=256, height=32):
    """
    Generate color bands by uniformly changing from left colors to right
    colors. Note that there might be multiple bands.

    Parameters
    ----------
    left_colors: Left colors of the color bands.
    right_colors: Right colors of the color bands.
    grade: how many colors are contained in one color band.
    height: height of one color band.
    """
    # check and process color parameters, which should be 2D list
    # after processing
    if not isinstance(left_colors, (tuple, list)):
        left_colors = [left_colors]
    if not isinstance(right_colors, (tuple, list)):
        right_colors = [right_colors]

    if not isinstance(left_colors[0], (tuple, list)):
        left_colors = [left_colors]
    if not isinstance(right_colors[0], (tuple, list)):
        right_colors = [right_colors]

    # initialize channel, and all other colors should have the same channel
    channel = len(left_colors[0])

    band_num = len(left_colors)
    result = []
    for i in range(band_num):
        left_color = left_colors[i]
        right_color = right_colors[i]
        if len(left_color) != channel or len(right_color) != channel:
            raise ValueError("All colors should have same channel number")

        color_band = np.linspace(left_color, right_color, grade)
        color_band = np.expand_dims(color_band, axis=0)
        color_band = np.repeat(color_band, repeats=height, axis=0)
        color_band = np.clip(np.round(color_band), 0, 255).astype(np.uint8)
        result.append(color_band)
    result = np.concatenate(result, axis=0)
    result = np.squeeze(result)
    return result


if __name__ == '__main__':
    black = [0, 0, 0]
    white = [255, 255, 255]
    red = [0, 0, 255]
    green = [0, 255, 0]
    blue = [255, 0, 0]

    gray_band = generate_color_band([[0], [255]], [[255], [0]])
    color_band8 = generate_color_band(
        [black, white, red, green, blue, black, black, black],
        [white, black, white, white, white, red, green, blue]
    )

    cv2.imwrite('gray_band.png', gray_band)
    cv2.imwrite('color_band8.png', color_band8)
到此这篇关于利用Python实现生成颜色表(color chart)的文章就介绍到这了,更多相关Python颜色表内容请搜索自由互联以前的文章或继续浏览下面的相关文章希望大家以后多多支持自由互联!