目录
1、二维散点图
2、调整坐标轴刻度范围
3、2D散点图颜色
4、三维点图
5、使用标签
6、更新
全局定义
import timeimport cv2import visdomimport numpy as npviz visdom.Visdom(env"scatter test")
效果

1、二维散点图
4种颜色X为平面坐标(x,y)Y为颜色索引。
colors np.random.randint(0, 255, (4, 3,)) # (4,3)4种颜色win viz.scatter(Xnp.random.rand(255, 2), # (255, 2), 值域0~1, 表示要展示的散点数据Ynp.random.randint(1, 5, (255)), # (255,), 值域1~4, 每一个数据的类别将以其对应的colors中的颜色来显示optsdict(markersize5,markercolorcolors,legend[1, 2, 3, 4],markersymbolcross-thin-open),)
结果

2、调整坐标轴刻度范围
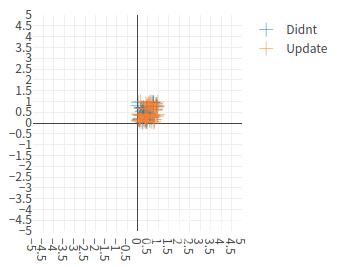
1设置刻度不合理
viz visdom.Visdom(env"scatter test")# scatter plotsY np.random.rand(100)old_scatter viz.scatter(Xnp.random.rand(100, 2), # (100, 2)Y(Y[Y > 0] 1.5).astype(int), # (100,)optsdict(legend[Didnt, Update],xtickmin-5,xtickmax5,xtickstep0.5,ytickmin-5,ytickmax5,ytickstep0.5,markersymbolcross-thin-open,),)
结果

2调整刻度
viz.update_window_opts(winold_scatter,optsdict(legend[Apples, Pears],xtickmin0,xtickmax1,xtickstep0.5,ytickmin0,ytickmax1,ytickstep0.5,markersymbolcross-thin-open,),)
结果

3、2D散点图颜色
1每个label自定义颜色一
# 2D scatterplot with custom intensities (red channel)viz.scatter(Xnp.random.rand(255, 2),Y(np.random.rand(255) 1.5).astype(int),optsdict(markersize10,markercolornp.random.randint(0, 255, (2, 3,)), # (2, 3)),)
结果

2每个label自定义颜色二
# 2D scatter plot with custom colors per label:viz.scatter(Xnp.random.rand(255, 2),Y(np.random.randn(255) > 0) 1,optsdict(markersize10,markercolornp.floor(np.random.random((2, 3)) * 255), # (2, 3)markerborderwidth0,),)
结果

3每个点一个颜色三
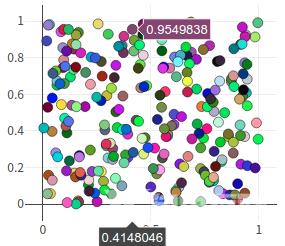
win viz.scatter(Xnp.random.rand(255, 2), # (255, 2)optsdict(markersize10,markercolornp.random.randint(0, 255, (255, 3,)), # (255, 3)),)
结果

添加点
# assert that the window existsassert viz.win_exists(win), Created window marked as not existing# add new trace to scatter plotviz.scatter(Xnp.random.rand(255),Ynp.random.rand(255),winwin,namenew_trace,updatenew)
结果

4、三维点图
# 3d scatterplot with custom labels and rangesY np.random.rand(100)viz.scatter(Xnp.random.rand(100, 3), # (100, 3)Y(Y 1.5).astype(int), # (100,)optsdict(legend[Men, Women],markersize5,xtickmin0,xtickmax2,xlabelArbitrary,xtickvals[0, 0.75, 1.6, 2],ytickmin0,ytickmax2,ytickstep0.5,ztickmin0,ztickmax1,ztickstep0.5,))
结果

5、使用标签
# 2D scatter plot with text labels:viz.scatter(Xnp.random.rand(10, 2),optsdict(textlabels[Label %d % (i 1) for i in range(10)]))
结果

彩色标签
viz.scatter(Xnp.random.rand(10, 2),Y[1] * 5 [2] * 3 [3] * 2, # [1, 1, 1, 1, 1, 2, 2, 2, 3, 3]颜色indexoptsdict(legend[A, B, C],textlabels[Label %d % (i 1) for i in range(10)]))
结果

6、更新
colors np.random.randint(0, 255, (2, 3,))win viz.scatter(Xnp.random.rand(255, 2),Y(np.random.rand(255) 1.5).astype(int), # color index, 1 or 2optsdict(markersize10,markercolorcolors,legend[1, 2]),)
结果

2添加
# 添加颜色1viz.scatter(Xnp.random.rand(255),Ynp.random.rand(255),optsdict(markersize10,markercolorcolors[0].reshape(-1, 3), # 取颜色1),name1,updateappend,winwin)# 随机添加viz.scatter(Xnp.random.rand(255, 2),Y(np.random.rand(255) 1.5).astype(int),optsdict(markersize10,markercolorcolors,),updateappend,winwin)
visdom可视化系列文章目录
1、visdom介绍一
2、visdom文件下载慢问题处理 downloading scripts, this may take a little while
3、visdom line画曲线二
4、visdom text显示文本三
5、visdom image显示图像四
6、visdom scatter散点图五
7、visdom bar柱状图六
8、visdom other七-直方图、热力图、饼图、逐像素
【文章转自日本多IP服务器 http://www.558idc.com/japzq.html提供,感恩】