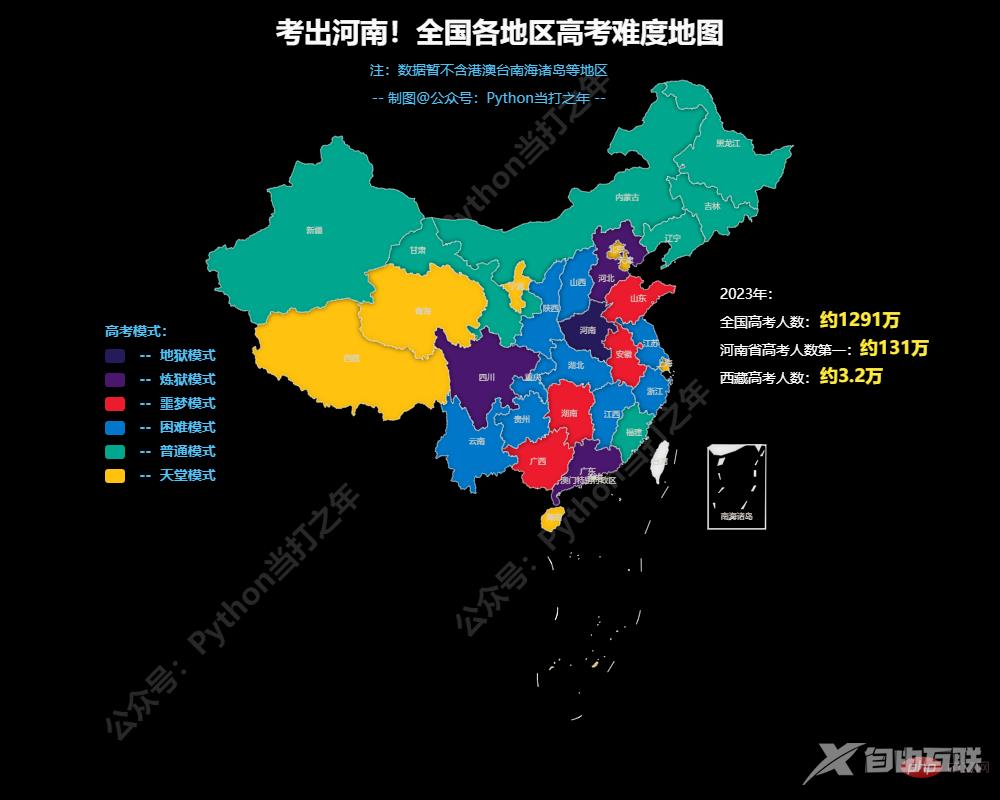
本期根据 2023年全国各地区高考人数,利用python的pyecharts库绘制相应考试难度地图,希望对大家有所帮助,如有疑问或者需要改进的地方可以联系小编。 1. 数据 df = pd.read_excel(2023各省高
df = pd.read_excel('2023各省高考人数.xlsx')2.1 底图
def get_map():
my_map = (
Map(init_opts=opts.InitOpts(width='1000px', height='800px',bg_color='#000000'))
.add('',
[list(z) for z in zip(x_data, y_data)],
maptype='china',
)
.set_global_opts(
title_opts=opts.TitleOpts(
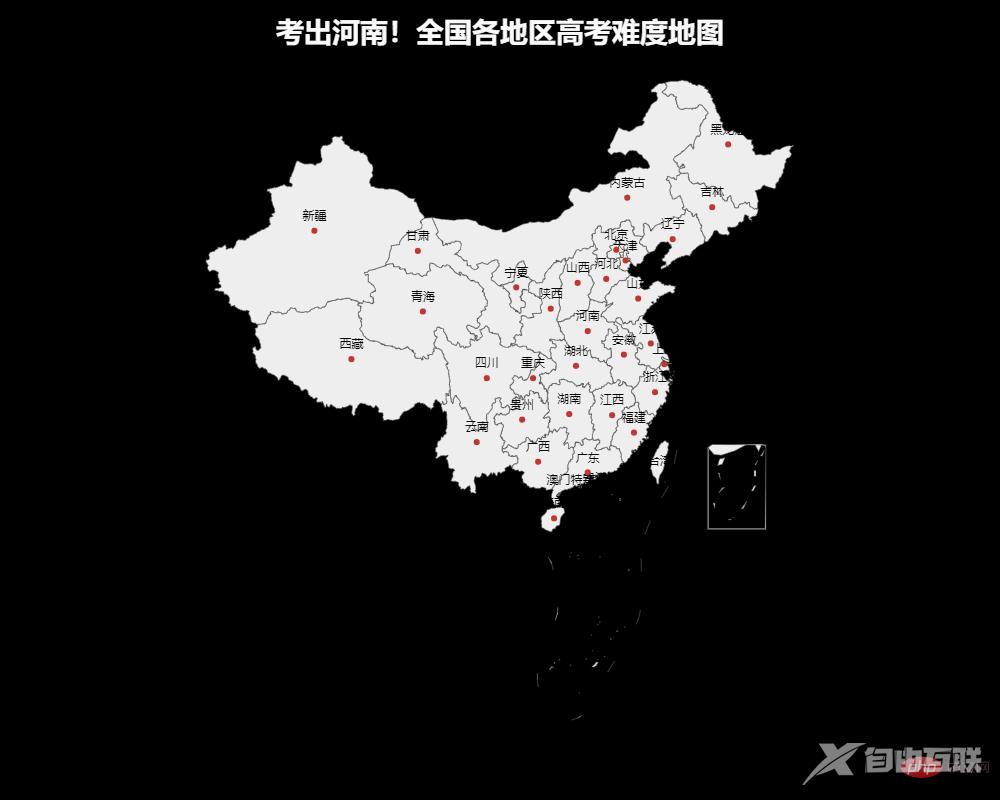
title='考出河南!全国各地区高考难度地图',
pos_top='2%',pos_left="center",
title_textstyle_opts=opts.TextStyleOpts(color='#FAFAFA',font_size=28),
),
)
)
2.2 添加热图分组
visualmap_opts=opts.VisualMapOpts(
    is_show=True,
    is_piecewise=True,
    split_number = 6,
    max_=130
)children=[
opts.GraphicText(
graphic_item=opts.GraphicItem(left="center", top="middle", z=100),
graphic_textstyle_opts=opts.GraphicTextStyleOpts(
text_align='right',
text='-- 制图@公众号:Python当打之年 --',
font="14px bold",
graphic_basicstyle_opts=opts.GraphicBasicStyleOpts(fill='#fff'),
),
),
]