二进制安装Prometheus 服务器列表: 服务器名称 操作系统 IP地址 服务 test03 Ubuntu 16.04.4 192.168.1.58 Prometheus, Alertmanager,grafana test02 Ubuntu 16.04.4 192.168.1.57 Node_exporter 1、安装prometheus Prometheus官网
服务器列表:
1、安装prometheus
-
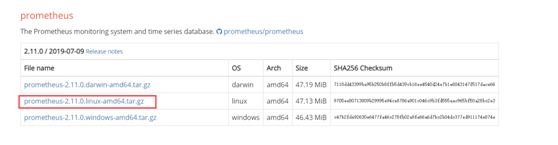
Prometheus官网下载地址:https://prometheus.io/download/

-
下载prometheus
[email protected]:~# wget https://github.com/prometheus/prometheus/releases/download/v2.11.0/prometheus-2.11.0.linux-amd64.tar.gz
-
解压prometheus
[email protected]:~# tar xf prometheus-2.11.0.linux-amd64.tar.gz -
移动到/usr/local/prometheus目录
[email protected]:~# mv prometheus-2.11.0.linux-amd64 /usr/local/prometheus - 设置prometheus后台服务启动
[email protected]:~# cat  /lib/systemd/system/prometheus.service
[Unit]
Description=https://prometheus.io

[Service]
ExecStart=/usr/local/prometheus/prometheus --config.file="/usr/local/prometheus/prometheus.yml"

[Install]
WantedBy=multi-user.target
-
创建prometheus服务
[email protected]:~# systemctl enable prometheus.service
Created symlink from /etc/systemd/system/multi-user.target.wants/prometheus.service to /lib/systemd/system/prometheus.service.
-
启动prometheus服务
[email protected]:~# systemctl start prometheus.service -
查看promethues服务状态
[email protected]:~# systemctl status prometheus.service
● prometheus.service - https://prometheus.io
Loaded: loaded (/lib/systemd/system/prometheus.service; enabled; vendor preset: enabled)
Active: active (running) since Wed 2019-07-10 11:10:45 CST; 4s ago
Main PID: 818 (prometheus)
......
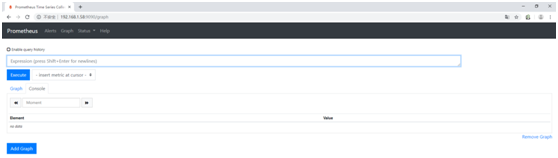
- 访问:http://192.168.1.58:9090
2、安装Grafana
-
docker 安装
[email protected]:~# docker run -d -p 3000:3000 grafana/grafana
[email protected]:~# docker ps
CONTAINER ID        IMAGE               COMMAND             CREATED             STATUS              PORTS                    NAMES
a6ff7bd88b42        grafana/grafana     "/run.sh"           43 seconds ago      Up 41 seconds       0.0.0.0:3000->3000/tcp   peaceful_brattain
-
访问:http://192.168.1.58:3000
登录gafana界面:
默认账号是:admin
默认密码是:admin
第一次登录后,提示重新设置密码 -
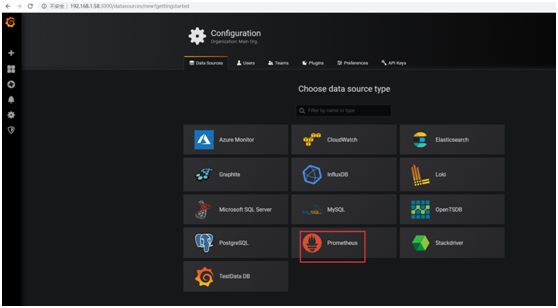
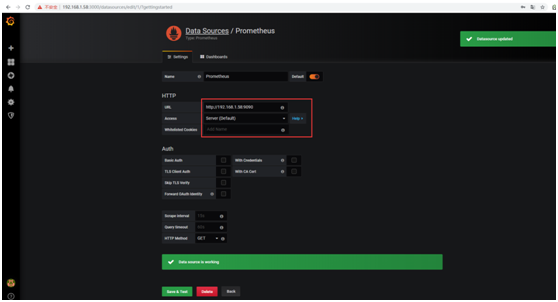
添加数据源
- 输入Prometheus地址

3、监控Linux服务器
- 安装node_exporter并启动
[email protected]:~# wget https://github.com/prometheus/node_exporter/releases/download/v0.18.1/node_exporter-0.18.1.linux-amd64.tar.gz
[email protected]:~# tar xf node_exporter-0.18.1.linux-amd64.tar.gz
[email protected]:~# mv node_exporter-0.18.1.linux-amd64 /usr/local/node_exporter
[email protected]:~# cd /usr/local/node_exporter
[email protected]:/usr/local/node_exporter# cat /lib/systemd/system/node_exporter.service
[Unit]
Description=https://prometheus.io/docs/guides/node-exporter/

[Service]
ExecStart=/usr/local/node_exporter/node_exporter

[Install]
WantedBy=multi-user.target

[email protected]:/usr/local/node_exporter# systemctl enable node_exporter.service
Created symlink from /etc/systemd/system/multi-user.target.wants/node_exporter.service to /lib/systemd/system/node_exporter.service.
[email protected]:/usr/local/node_exporter# systemctl start node_exporter.service
[email protected]:/usr/local/node_exporter# systemctl status node_exporter.service
● node_exporter.service - https://prometheus.io/docs/guides/node-exporter/
   Loaded: loaded (/lib/systemd/system/node_exporter.service; enabled; vendor preset: enabled)
   Active: active (running) since Wed 2019-07-10 14:23:35 CST; 5s ago
 Main PID: 774 (node_exporter)
   CGroup: /system.slice/node_exporter.service
           └─774 /usr/local/node_exporter/node_exporter
-
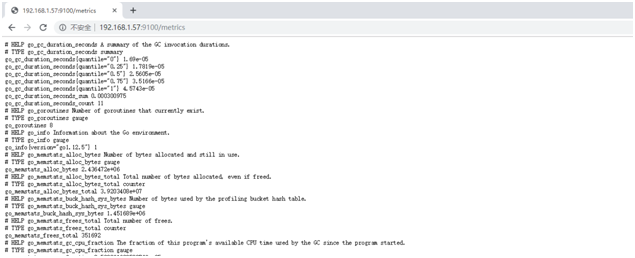
访问:http://192.168.1.57:9100/metrics,可查看node_exporter收集的数据
- 配置服务发现
cat /usr/local/prometheus/prometheus.yml
# my global config
global:
  scrape_interval:     15s # Set the scrape interval to every 15 seconds. Default is every 1 minute.
  evaluation_interval: 15s # Evaluate rules every 15 seconds. The default is every 1 minute.
  # scrape_timeout is set to the global default (10s).

# Alertmanager configuration
alerting:
  alertmanagers:
  - static_configs:
    - targets:
      # - alertmanager:9093

# Load rules once and periodically evaluate them according to the global ‘evaluation_interval‘.
rule_files:
  # - "first_rules.yml"
  # - "second_rules.yml"

# A scrape configuration containing exactly one endpoint to scrape:
# Here it‘s Prometheus itself.
scrape_configs:
  # The job name is added as a label `job=<job_name>` to any timeseries scraped from this config.
  - job_name: ‘prometheus‘

    # metrics_path defaults to ‘/metrics‘
    # scheme defaults to ‘http‘.

    static_configs:
    - targets: [‘localhost:9090‘]
  - job_name: ‘host‘
    file_sd_configs:
      - files: [‘/usr/local/prometheus/sd_config/host.yml‘]
        refresh_interval: 5s
- 创建host.yaml文件
[email protected]:/usr/local/prometheus/sd_config# cat /usr/local/prometheus/sd_config/host.yml
- targets:
  - 192.168.1.57:9100
-
重载配置文件
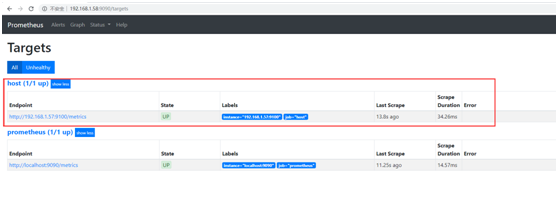
prometheus_id=`ps -ef |grep prometheus.yml|grep -v grep|awk ‘{print $2}‘` kill -hup $prometheus_id - 查看Targets host,host组,已存在192.168.1.57被监控端
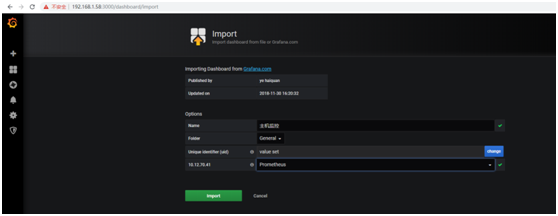
- grafana导入linux基础监控模:9276
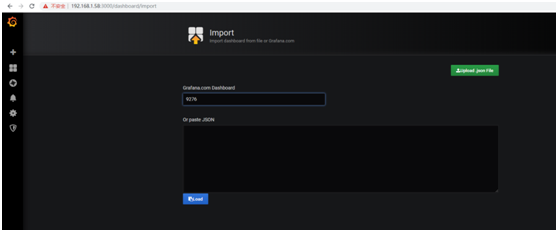
- 输入9276后,等待几秒自动加载模板
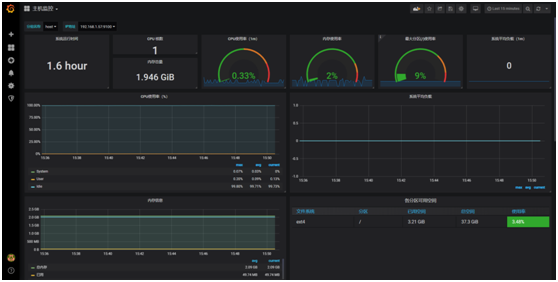
- 查看主机资源展示
4、安装Alertmanager
- 下载Alertmanager
[email protected]:~# wget https://github.com/prometheus/alertmanager/releases/download/v0.18.0/alertmanager-0.18.0.linux-amd64.tar.gz
- 解压alertmanager-0.18.0.linux-amd64.tar.gz 并移动到/usr/local/alertmanager
[email protected]:~# tar xf alertmanager-0.18.0.linux-amd64.tar.gz
[email protected]:~# mv alertmanager-0.18.0.linux-amd64 /usr/local/alertmanager
- 配置alertmanager后台启动
[email protected]:~# cd /usr/local/alertmanager
[email protected]:/usr/local/alertmanager# cat /lib/systemd/system/alertmanager.service
[Unit]
Description=https://prometheus.io/docs/prometheus/latest/configuration/alerting_rules/

[Service]
ExecStart=/usr/local/alertmanager/alertmanager --config.file=/usr/local/alertmanager/alertmanager.yml

[Install]
WantedBy=multi-user.target
- 配置邮件告警
[email protected]:/usr/local/alertmanager# cat /usr/local/alertmanager/alertmanager.yml
global:
  resolve_timeout: 5m
  smtp_smarthost: ‘smtp.163.com:25‘
  smtp_from: ‘[email protected]‘
  smtp_auth_username: ‘[email protected]‘
  smtp_auth_password: ‘xxxxxx‘
  smtp_require_tls: false
route:
  group_by: [‘alertname‘]
  group_wait: 10s
  group_interval: 10s
  repeat_interval: 1m
  receiver: ‘mail‘
receivers:
- name: ‘mail‘
  email_configs:
  - to: ‘[email protected]‘
- 启动alertmanager
[email protected]:/usr/local/alertmanager# systemctl enable alertmanager.service
Created symlink from /etc/systemd/system/multi-user.target.wants/alertmanager.service to /lib/systemd/system/alertmanager.service.
[email protected]:/usr/local/alertmanager# systemctl start alertmanager.service

[email protected]:/usr/local/alertmanager# systemctl status alertmanager.service
● alertmanager.service - https://prometheus.io/docs/prometheus/latest/configuration/alerting_rules/
   Loaded: loaded (/lib/systemd/system/alertmanager.service; enabled; vendor preset: enabled)
   Active: active (running) since Wed 2019-07-10 16:28:20 CST; 2min 15s ago
 Main PID: 19847 (alertmanager)
    Tasks: 9
   Memory: 9.0M
      CPU: 290ms
   CGroup: /system.slice/alertmanager.service
           └─19847 /usr/local/alertmanager/alertmanager --config.file=/usr/local/alertmanager/alertmanager.yml
- 配置告警信息
# Alertmanager configuration
alerting:
alertmanagers:
- static_configs:
- targets:
- 127.0.0.1:9093
# Load rules once and periodically evaluate them according to the global ‘evaluation_interval‘.
rule_files:
- "rules/*.yml"
[email protected]:/usr/local/prometheus/rules# cat /usr/local/prometheus/rules/targets.yml
groups:
- name: targets
rules:
# Alert for any instance that is unreachable for >5 minutes.
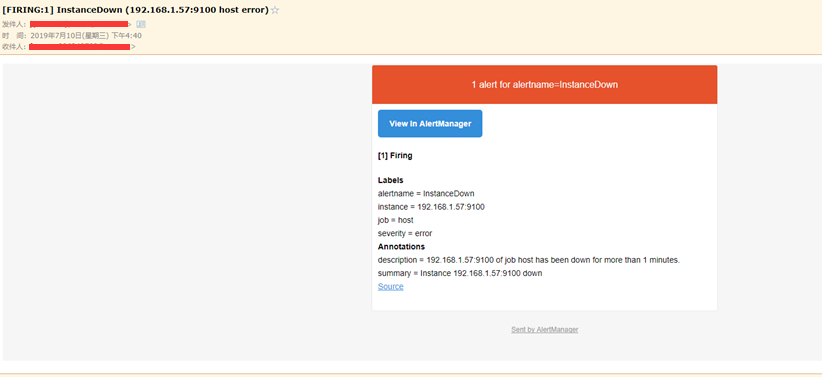
- alert: InstanceDown
expr: up == 0
for: 1m
labels:
severity: error
annotations:
summary: "Instance {{ $labels.instance }} down"
description: "{{ $labels.instance }} of job {{ $labels.job }} has been down for more than 1 minutes."
- 重载Prometheus服务文件,根据Prometheus进程号818发送信号
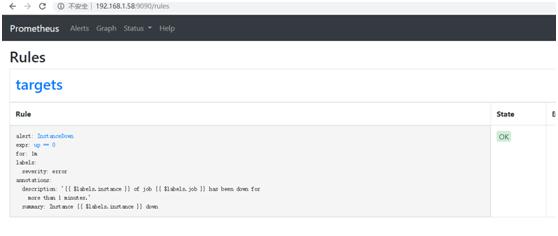
prometheus_id=`ps -ef |grep prometheus.yml|grep -v grep|awk ‘{print $2}‘` kill -hup $prometheus_id - 查看告警规则
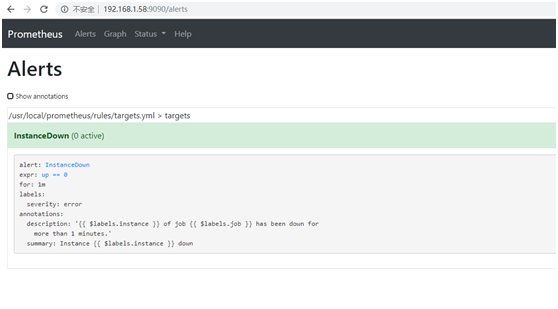
- 查看告警状态,(active)表示:活动
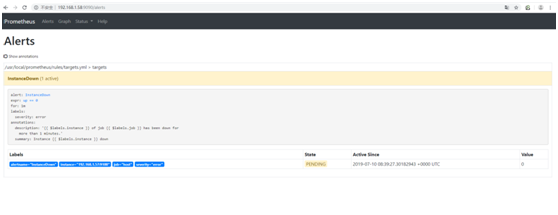
- 测试节点停止
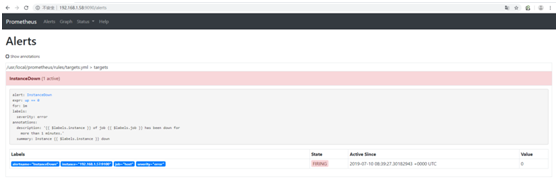
[email protected]:~# systemctl stop node_exporter.service - Pending:已触发阈值,但未满足告警持续时间
- Firing:已触发阈值且满足告警持续时间。警报发送给接收者。*
- 收到告警邮件
 *
*