QCustomPlot开发笔记系列整理集合,这是目前使用最为广泛的Qt图表类(Qt的QWidget代码方向只有QtCharts,Qwt,QCustomPlot),使用多年,系统性的整理,过目并整理了原有文档,本系列旨在系统解说并逐步更新其各种Demo示例。
多年前文章 (本篇不再整理了)
《Qt开发笔记之QCustomPlot:QCustomPlot介绍、编译与使用》
QCustomPlot是一个小型的qt画图标类,效果可以,易用,只需要在项目中加入头文件qcustomplot.h和qcustomplot.cpp文件,然后使一个widget提升为QCustomPlot类,即可使用。
QCustomPlot 可以导出为各种格式,如矢量化 PDF 文件和光栅化图像,如 PNG、JPG 和 BMP。QCustomPlot 是在应用程序内显示实时数据以及为其他媒体生成高质量绘图的解决方案。
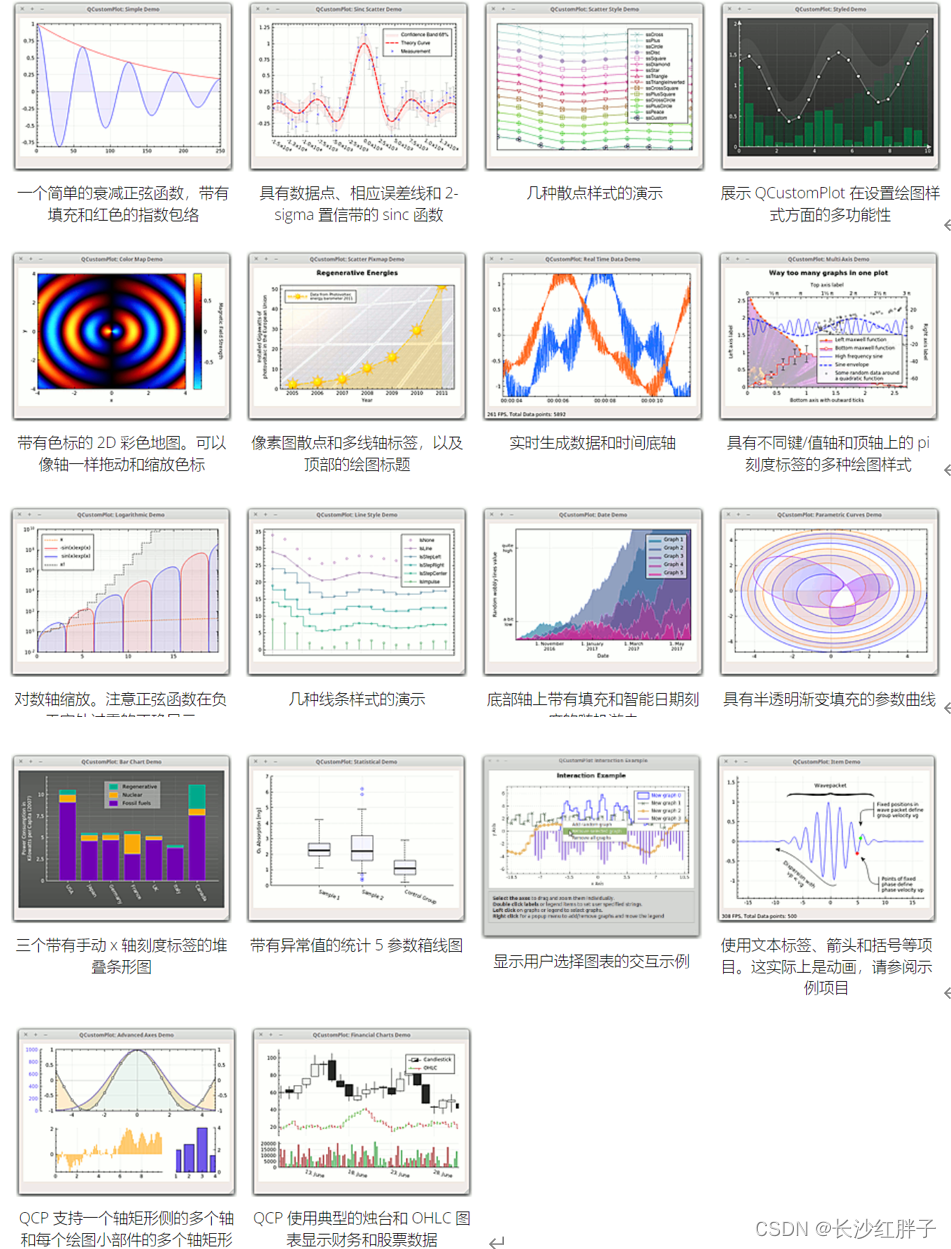
下图显示了使用 QCustomPlot 仅用几行可以实现的功能。要查看代码,请单击相应的图像。所有代码也可在完整包中找到。
QCustomPlot是一个比较完善的框架,其框架和缓存化的处理使其处理性能大幅度提升(设置笔宽为1,可撑起几百万点),而QtCharts只是一个半成品,不论是否有bug,QtCharts在两千个点以内是可以使用的,超过两千个点就存在刷新卡顿的问题(很大可能)。
从定制化角度QCustomPlot修改源码因为其是一步一步继承过来的,修改起来是比较麻烦的,还需要反复调试以防止修改了代码出现了其他问题,入添加一个少则半天一天,多则几天,所以如果需要定制修改QCustomoPlot源码的需求,是需要进一步仔细评估是否值得这么做。
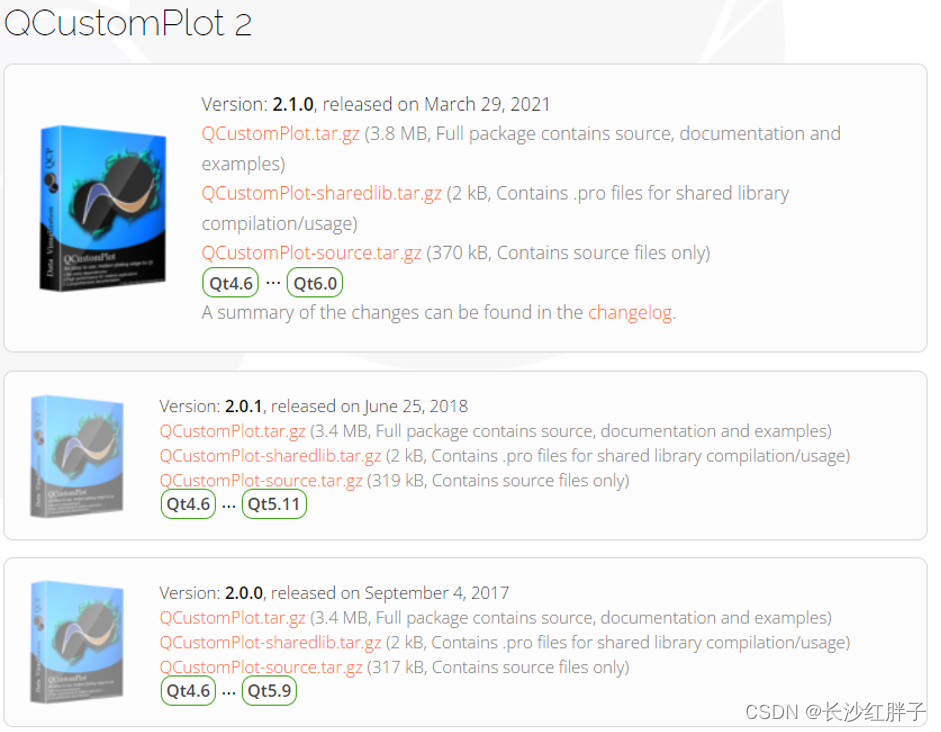
下载地址 最新版本:2.1.0
官网:https://www.qcustomplot.com/index.php/introduction
CSDN粉丝零积分下载:https://download.csdn.net/download/qq21497936/85250427
QQ群:1047134658(点击“文件”搜索“qcustomplot”,群内与博文同步更新)
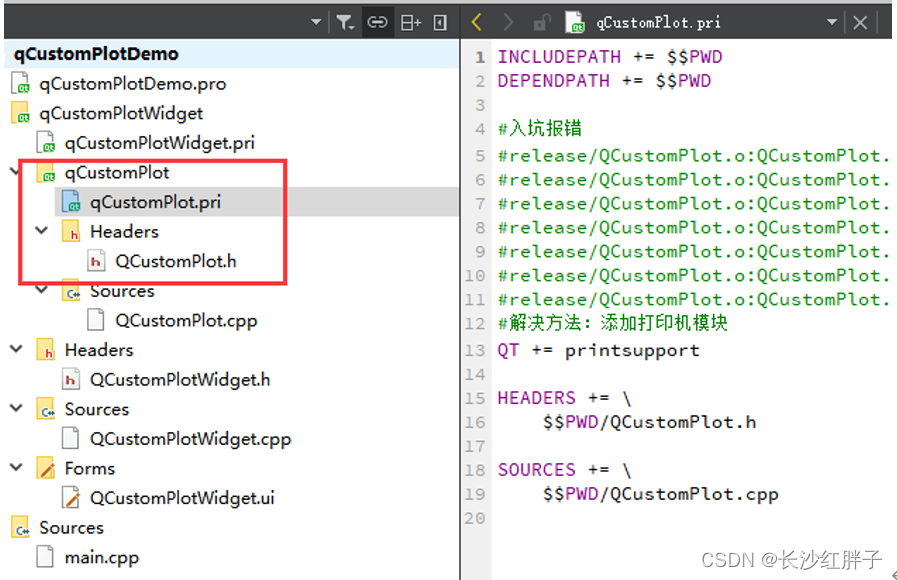
直接下载后,将其中的qcstomplot.h和qcustomplot.cpp当作项目文件添加即可:

更好的方式是模块化部署,如下图;
(注意:以下示例使用customPlot作为指向QCustomPlot实例的指针。在QtCreator中升级了一个小部件,可能会通过ui->customPlot(或者给小部件起的任何名字)访问相应的小部件。)
添加图形 可以通过customPlot->addGraph()在绘图中创建新的图形。然后为图形指定一些数据点,例如通过customPlot->graph(0)->setData(…),例如,以两个QVector< double >的形式表示x和y(键和值)。QCustomPlot使用术语键和值而不是x和y的原因是,在指定哪个轴具有什么角色时允许更大的灵活性。
因此,如果将左轴定义为“关键轴”,将底部定义为“值轴”,则可以绘制一个竖立在绘图左侧的图形。默认情况下,QCustomPlot小部件有四个轴:customPlot->xAxis、yAxis、xAxis2和QCPAxis类型的yAxis2,对应于底部、左侧、顶部和右侧轴。它们的范围定义了绘图的当前可见部分:customPlot->xAxis->setRange(-1,1)。
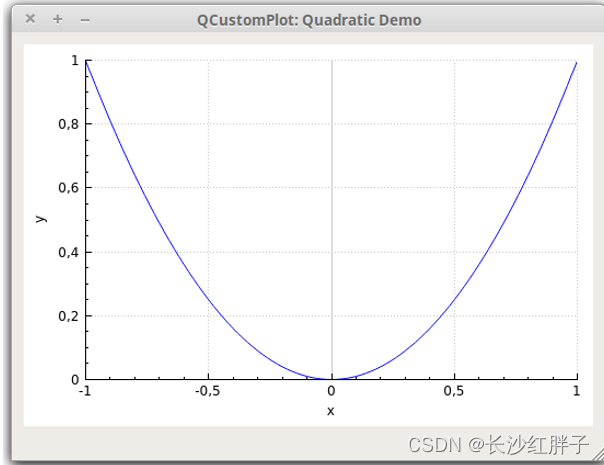
// generate some data:
QVector<double> x(101), y(101); // initialize with entries 0..100
for (int i=0; i<101; ++i)
{
  x[i] = i/50.0 - 1; // x goes from -1 to 1
  y[i] = x[i]*x[i]; // let's plot a quadratic function
}
// create graph and assign data to it:
customPlot->addGraph();
customPlot->graph(0)->setData(x, y);
// give the axes some labels:
customPlot->xAxis->setLabel("x");
customPlot->yAxis->setLabel("y");
// set axes ranges, so we see all data:
customPlot->xAxis->setRange(-1, 1);
customPlot->yAxis->setRange(0, 1);
customPlot->replot();
轴当前使用的轴标记器会自动选择标记步骤和标签。这是QCPAxisTicker类型的实例,可以通过xAxis->ticker() 访问。可以通过xAxis->ticker()->setTickCount(6) 调整ticker尝试创建的大致刻度数。默认的轴标记器非常适合简单的数字显示,但是有专门的类别,例如时间跨度、日历日期、类别、pi(或其他符号单位)和对数轴。参阅QCPAxisTicker文档。
轴的刻度标签(数字)永远不会到达小部件边界之外,即使它们变宽了。这是由于默认情况下启用了自动保证计算。如果记号标签和轴标签需要更多空间,它会使轴矩形收缩。如果不希望自动确定边距,请通过调用customPlot->axisRect()->setAutoMargins(QCP::msNone) 禁用该行为。然后可以通过customPlot->axisRect()->setMargins(…) 手动调整边距。
图形的外观由许多因素决定,所有这些因素都可以修改。以下是最重要的:
- 线型:调用graph->setLineStyle(…)。有关所有可能的线条样式,请参阅QCPGraph::LineStyle文档或简介页面上的线条样式演示屏幕截图。
- 线条笔:QPainter 框架提供的所有笔都可用,例如实线、虚线、点线、不同的宽度、颜色、透明度等。通过 设置配置的笔graph->setPen(…)。
- 散点符号:调用 graph->setScatterStyle(…) 以更改散点符号的外观。对于所有可能的散布样式,请参阅QCPScatterStyle文档。如果不希望在数据点处显示任何散点符号,请将图形的散点样式设置为 QCPScatterStyle::ssNone
- 在图形下或两个图形之间填充:QPainter 框架提供的所有画笔都可以用于图形填充:实心、各种图案、纹理、渐变、颜色、透明度等,通过设置配置画笔graph->setBrush(…)。
轴的外观可以通过更改其绘制的笔及其标签使用的字体来修改。查看QCPAxis的文档应该是不言自明的。下面是最重要属性的快速总结:setBasePen、setTickPen、setTickLength、setSubTickLength、setSubTickPen、setTickLabelFont、setLabelFont、setTickLabelPadding、setLabelPadding。可以使用setRangeReversed反转轴(例如,使值从左到右减少而不是增加)。如果要在轴端进行装饰(如箭头),请使用setLowerEnding或SetPerEnding。
网格线 通过访问axis的相应QCPGrid实例来修改网格。例如,通过访问**customPlot->yAxis->grid()来更改与左轴相连的水平网格线的外观。网格线的外观基本上是用画笔绘制的,可以通过yAxis->grid()->setPen()进行设置。勾号0处的网格线可以使用其他笔绘制,也可以使用setZeroLinePen进行配置。如果不想用特殊的钢笔画零线,只需将其设置为Qt::NoPen,勾号0处的网格线将用普通的网格笔画出来。
默认情况下,子栅格线设置为不可见。可以使用grid()->setSubGridVisible(true)**使其可见。
两个图的简单图
下面是一个创建具有指数包络的衰减余弦函数图像的示例:
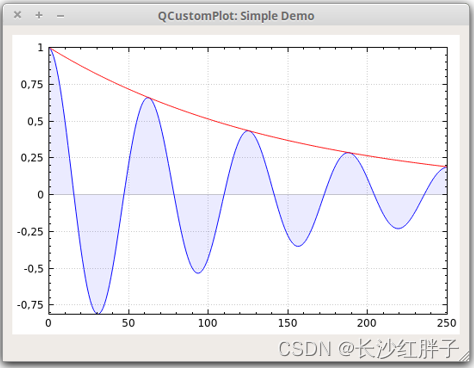
// add two new graphs and set their look:
customPlot->addGraph();
// line color blue for first graph
customPlot->graph(0)->setPen(QPen(Qt::blue));
// first graph will be filled with translucent blue
customPlot->graph(0)->setBrush(QBrush(QColor(0, 0, 255, 20)));
// line color blue for second graph
customPlot->addGraph();
// line color red for second graph
customPlot->graph(1)->setPen(QPen(Qt::red));
// generate some points of data (y0 for first, y1 for second graph):
QVector<double> x(251), y0(251), y1(251);
for (int i=0; i<251; ++i)
{
  x[i] = i;
  // exponentially decaying cosine
  y0[i] = qExp(-i/150.0)*qCos(i/10.0);
  // exponential envelope
  y1[i] = qExp(-i/150.0);
}
// configure right and top axis to show ticks but no labels:
// (see QCPAxisRect::setupFullAxesBox for a quicker method to do this)
customPlot->xAxis2->setVisible(true);
customPlot->xAxis2->setTickLabels(false);
customPlot->yAxis2->setVisible(true);
customPlot->yAxis2->setTickLabels(false);
// make left and bottom axes always transfer their ranges to right and top axes:
connect(customPlot->xAxis, SIGNAL(rangeChanged(QCPRange)), customPlot->xAxis2, SLOT(setRange(QCPRange)));
connect(customPlot->yAxis, SIGNAL(rangeChanged(QCPRange)), customPlot->yAxis2, SLOT(setRange(QCPRange)));
// pass data points to graphs:
customPlot->graph(0)->setData(x, y0);
customPlot->graph(1)->setData(x, y1);
// let the ranges scale themselves so graph 0 fits perfectly in the visible area:
customPlot->graph(0)->rescaleAxes();
// same thing for graph 1, but only enlarge ranges (in case graph 1 is smaller than graph 0):
customPlot->graph(1)->rescaleAxes(true