Loki收集Nginx日志并以grafana展示 背景 公司一直用的是ELK来收集Nginx日志的,对于服务器较少的用elk则显得太重了,于是调研了一番,用loki+Promtail+grafana来测试一下。Loki类似elasticsearch,用
公司一直用的是ELK来收集Nginx日志的,对于服务器较少的用elk则显得太重了,于是调研了一番,用loki+Promtail+grafana来测试一下。Loki类似elasticsearch,用于存储。Promtail类似fluent,用于收集,grafana类似kibana,用于展示
先放几张图来展示一下成果:
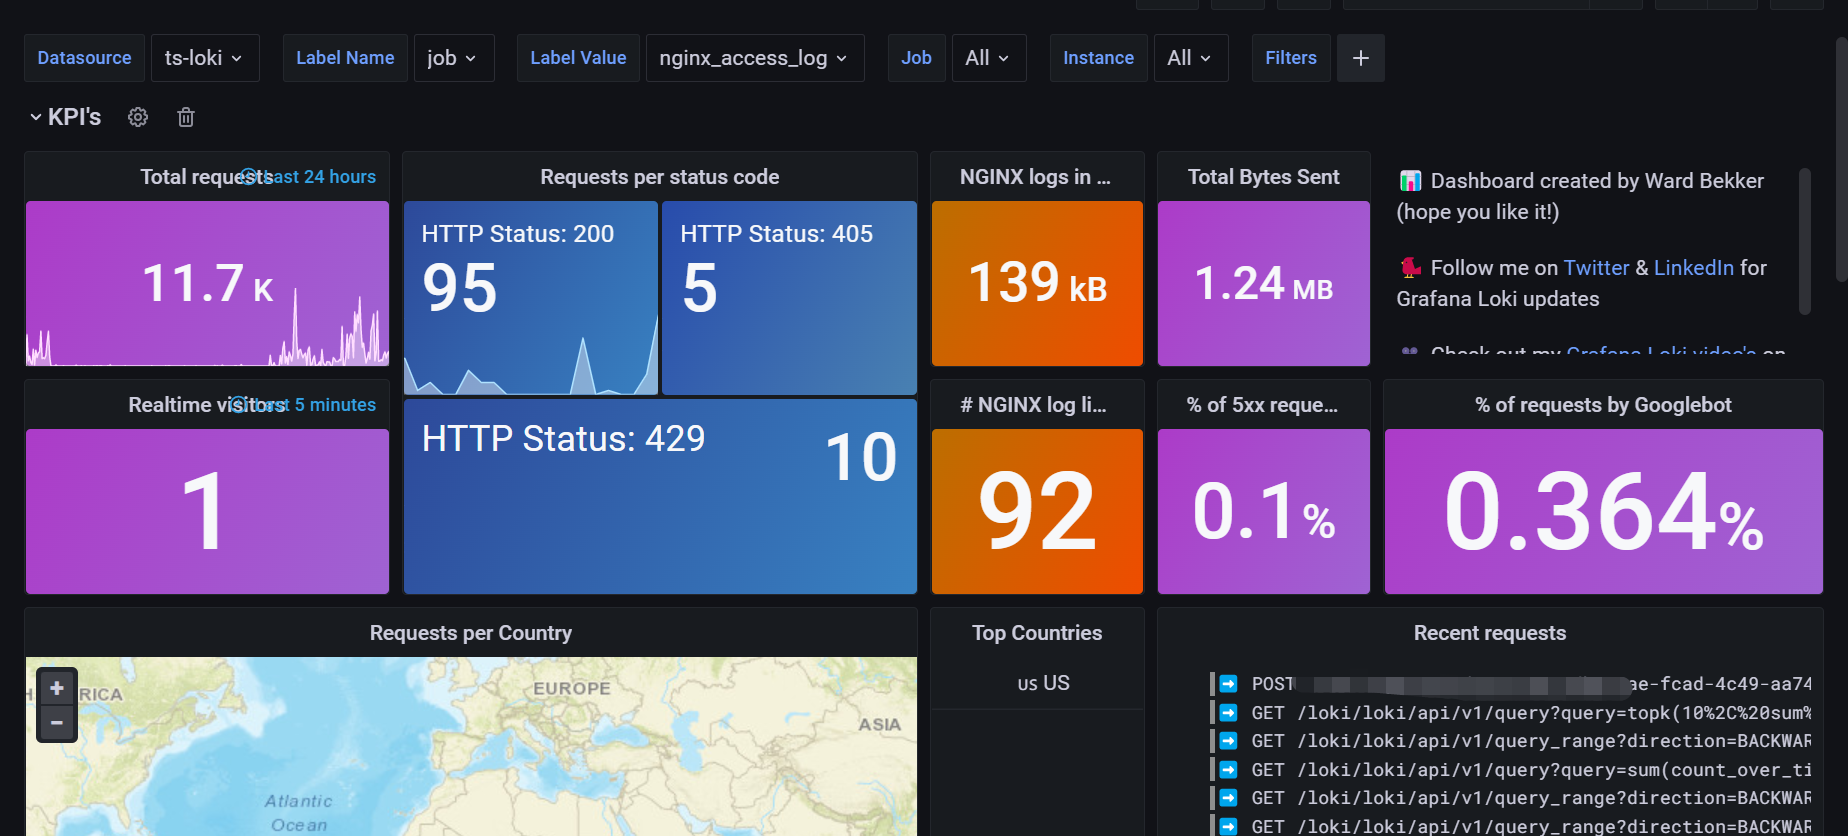
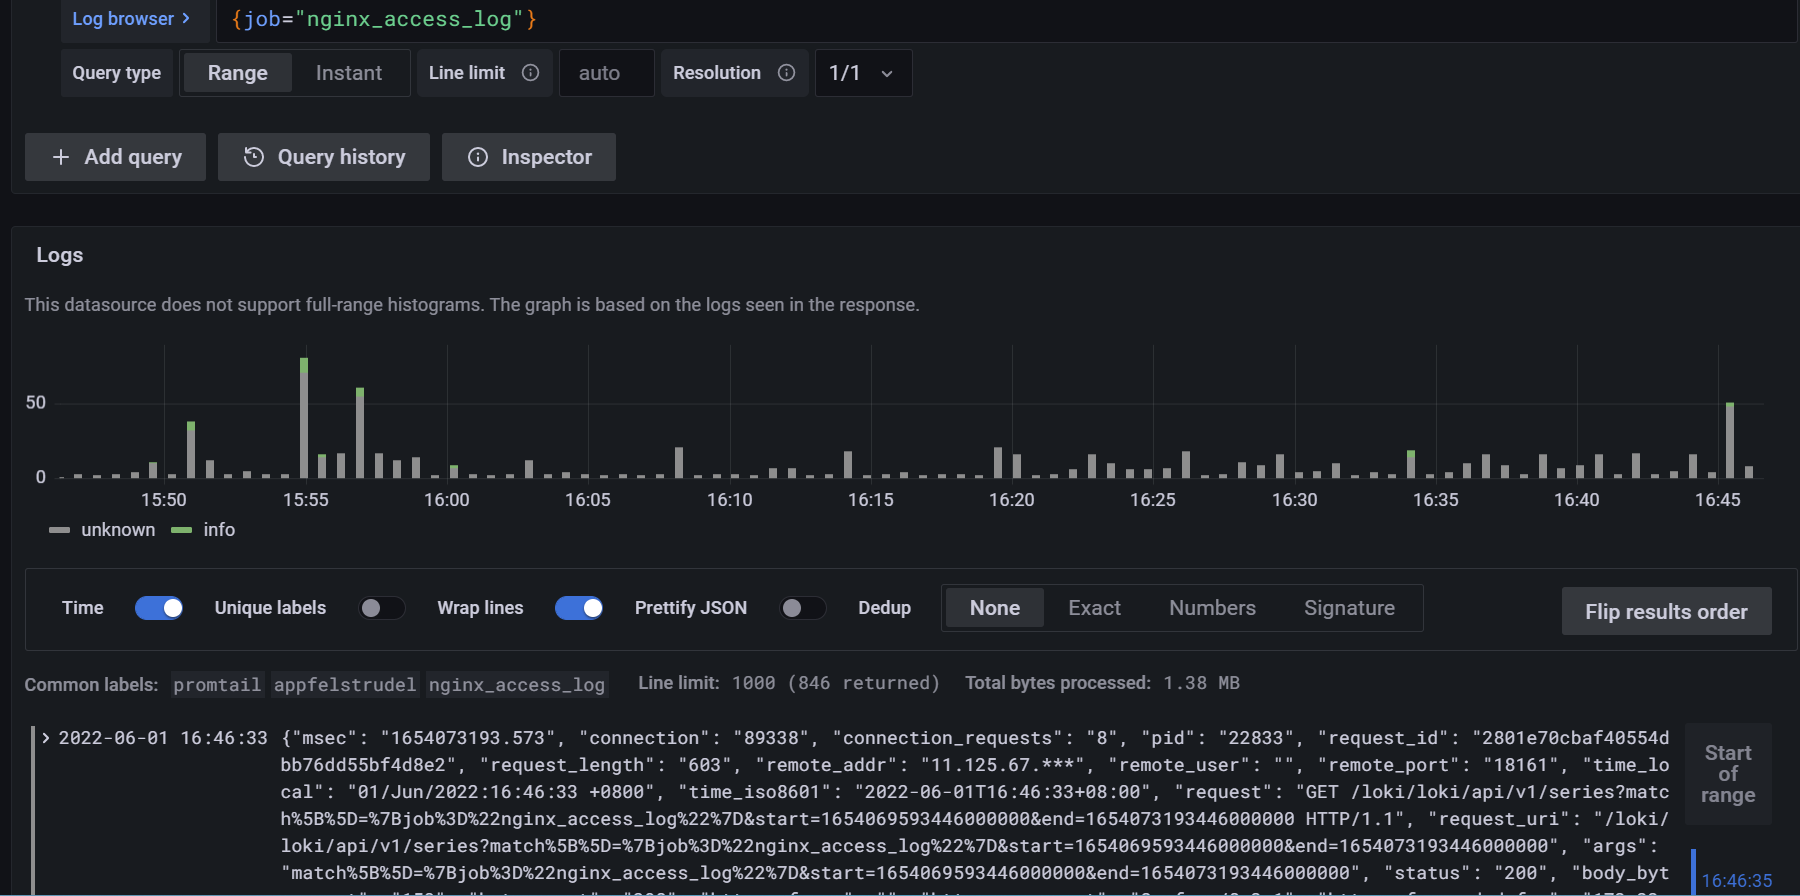
这里是用grafana查询日志
首先修改Nginx日志为json格式:
log_format json_analytics escape=json '{'
                            '"msec": "$msec", ' # request unixtime in seconds with a milliseconds resolution
                            '"connection": "$connection", ' # connection serial number
                            '"connection_requests": "$connection_requests", ' # number of requests made in connection
                    '"pid": "$pid", ' # process pid
                    '"request_id": "$request_id", ' # the unique request id
                    '"request_length": "$request_length", ' # request length (including headers and body)
                    '"remote_addr": "$remote_addr", ' # client IP
                    '"remote_user": "$remote_user", ' # client HTTP username
                    '"remote_port": "$remote_port", ' # client port
                    '"time_local": "$time_local", '
                    '"time_iso8601": "$time_iso8601", ' # local time in the ISO 8601 standard format
                    '"request": "$request", ' # full path no arguments if the request
                    '"request_uri": "$request_uri", ' # full path and arguments if the request
                    '"args": "$args", ' # args
                    '"status": "$status", ' # response status code
                    '"body_bytes_sent": "$body_bytes_sent", ' # the number of body bytes exclude headers sent to a client
                    '"bytes_sent": "$bytes_sent", ' # the number of bytes sent to a client
                    '"http_referer": "$http_referer", ' # HTTP referer
                    '"http_user_agent": "$http_user_agent", ' # user agent
                    '"http_x_forwarded_for": "$http_x_forwarded_for", ' # http_x_forwarded_for
                    '"http_host": "$http_host", ' # the request Host: header
                    '"server_name": "$server_name", ' # the name of the vhost serving the request
                    '"request_time": "$request_time", ' # request processing time in seconds with msec resolution
                    '"upstream": "$upstream_addr", ' # upstream backend server for proxied requests
                    '"upstream_connect_time": "$upstream_connect_time", ' # upstream handshake time incl. TLS
                    '"upstream_header_time": "$upstream_header_time", ' # time spent receiving upstream headers
                    '"upstream_response_time": "$upstream_response_time", ' # time spend receiving upstream body
                    '"upstream_response_length": "$upstream_response_length", ' # upstream response length
                    '"upstream_cache_status": "$upstream_cache_status", ' # cache HIT/MISS where applicable
                    '"ssl_protocol": "$ssl_protocol", ' # TLS protocol
                    '"ssl_cipher": "$ssl_cipher", ' # TLS cipher
                    '"scheme": "$scheme", ' # http or https
                    '"request_method": "$request_method", ' # request method
                    '"server_protocol": "$server_protocol", ' # request protocol, like HTTP/1.1 or HTTP/2.0
                    '"pipe": "$pipe", ' # "p" if request was pipelined, "." otherwise
                    '"gzip_ratio": "$gzip_ratio", '
                    '"http_cf_ray": "$http_cf_ray",'
                    '"geoip_country_code": "$geoip_country_code"'
                    '}';

 access_log /usr/local/nginx/logs/json_access.log json_analytics;
注意这里的geoip_country_code,用于展示哪个国家的哪个城市访问。需要在Nginx添加geoip的支持。
首先通过yum安装geoip及lib库
yum -y install GeoIP GeoIP-data GeoIP-devel
重新编译Nginx,加入--with-http_geoip_module进行添加模块
yum安装的geoip内置的数据较老,需要下载最新的数据
wget https://dl.miyuru.lk/geoip/dbip/country/dbip.dat.gz -O country.dat
wget https://dl.miyuru.lk/geoip/dbip/city/dbip.dat.gz -O city.dat
nginx.conf增加下面两行后 /usr/local/nginx/sbin/nginx -s reload
geoip_city /usr/local/nginx/html/ip/city.dat;
geoip_country /usr/local/nginx/html/ip/country.dat;
现在Nginx的日志是这样的:
{"msec": "1654072604.175", "connection": "92799", "connection_requests": "1", "pid": "4251", "request_id": "47e117ff2287fb32fb8382aff742334b", "request_length": "1105", "remote_addr": "11.125.67.88", "remote_user": "", "remote_port": "18154", "time_local": "01/Jun/2022:16:36:44 +0800", "time_iso8601": "2022-06-01T16:36:44+08:00", "request": "POST /xx/xx.html HTTP/1.1", "request_uri": "/xx/xx.html", "args": "", "status": "200", "body_bytes_sent": "146", "bytes_sent": "308", "http_referer": "http://172.16.124.225:8080/", "http_user_agent": "Mozilla/5.0 (iPhone; CPU iPhone OS 13_2_3 like Mac OS X) AppleWebKit/605.1.15 (KHTML, like Gecko) Version/13.0.3 Mobile/15E148 Safari/604.1", "http_x_forwarded_for": "172.16.124.225, 218.104.146.57", "http_host": "xx.com", "server_name": "xx.com", "request_time": "0.704", "upstream": "192.168.96.13:80", "upstream_connect_time": "0.000", "upstream_header_time": "0.700", "upstream_response_time": "0.700", "upstream_response_length": "135", "upstream_cache_status": "", "ssl_protocol": "", "ssl_cipher": "", "scheme": "http", "request_method": "POST", "server_protocol": "HTTP/1.1", "pipe": ".", "gzip_ratio": "", "http_cf_ray": "","geoip_country_code": "US"}
下载软件
wget https://github.com/grafana/loki/releases/download/v2.5.0/loki-linux-amd64.zip
unzip loki-linux-amd64.zip
mv loki-linux-amd64 loki
loki的配置文件
auth_enabled: false

server:
  http_listen_port: 3100
  grpc_listen_port: 9096

common:
  path_prefix: /data/loki
  storage:
    filesystem:
      chunks_directory: /data/loki/chunks
      rules_directory: /data/loki/rules
  replication_factor: 1
  ring:
    instance_addr: 127.0.0.1
    kvstore:
      store: inmemory

schema_config:
  configs:
    - from: 2020-10-24
      store: boltdb-shipper
      object_store: filesystem
      schema: v11
      index:
        prefix: index_
        period: 24h

ruler:
  alertmanager_url: http://localhost:9093
启动loki
nohup ./loki -config.file=loki-local-config.yaml &
下载软件
wget https://github.com/grafana/loki/releases/download/v2.5.0/promtail-linux-amd64.zip
unzip promtail-linux-amd64.zip
mv promtail-linux-amd64 promtail
配置文件
server:
  http_listen_port: 9080
  grpc_listen_port: 0

positions:
  filename: /tmp/positions.yaml

clients:
  - url: http://192.168.96.239:3100/loki/api/v1/push

scrape_configs:
- job_name: nginx
  pipeline_stages:
  - replace:
      expression: '(?:[0-9]{1,3}\.){3}([0-9]{1,3})'
      replace: '***'
  static_configs:
  - targets:
      - localhost
    labels:
      job: nginx_access_log
      host: appfelstrudel
      agent: promtail
      __path__: /usr/local/nginx/logs/json_access.log
启动
nohup ./promtail --config.file=promtail-local-config.yaml &
下载安装
wget https://mirrors.cloud.tencent.com/grafana/yum/rpm/grafana-8.5.3-1.x86_64.rpm
yum install -y grafana-8.5.3-1.x86_64.rpm
systemctl start grafana-server
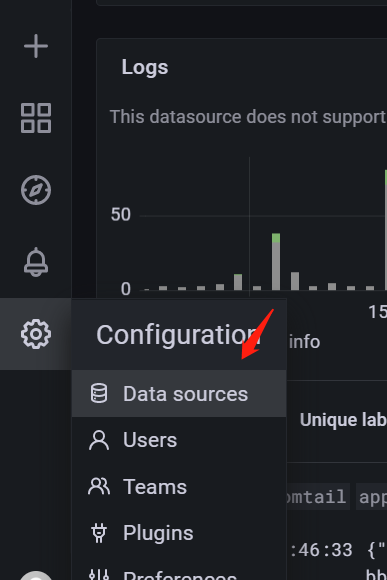
grafana添加数据源,选Loki。
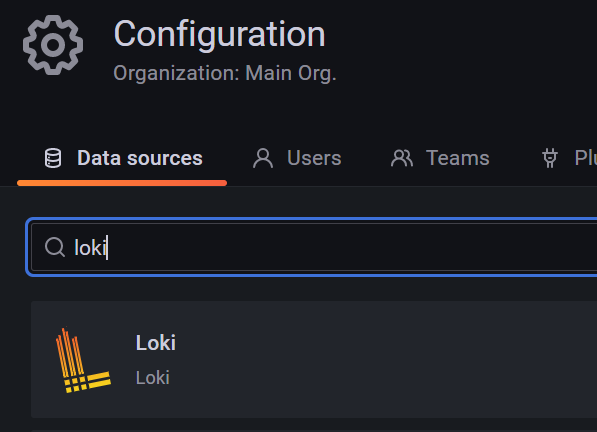
输入url:http://localhost:3100/loki 即可
然后导入 12559 模板即可