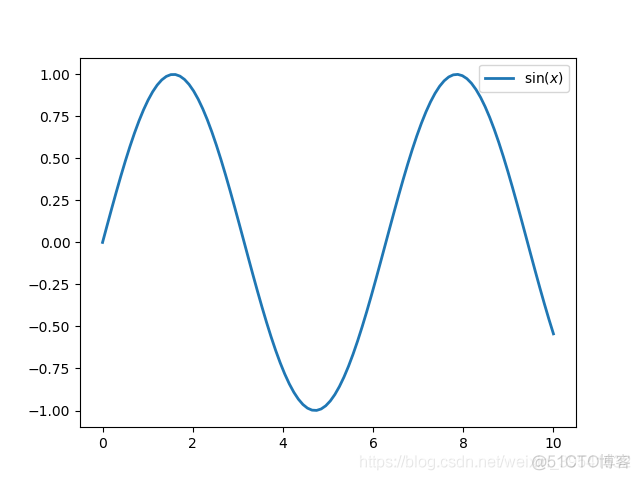
import matplotlib . pyplot as plt import numpy as np 函数plot()——展现变量的趋势变化。 def exercise1 (): """ :return: """ x = np . linspace ( 0 , 10.0 , 100 ) # 在0.5到3.5之间均匀地取100个数字 y = np . sin ( x ) #
import numpy as np
"""
:return:
"""
x = np.linspace(0, 10.0, 100) # 在0.5到3.5之间均匀地取100个数字
y = np.sin(x)
# y1 = np.random.randn(100) # 在标准正态分布中随机选取100个数字
# TeX进行文本渲染,实现印刷级文档效果
plt.plot(x, y, ls='-', lw=2, label=r"$\sin(x)$")
plt.legend() # plt.legend()函数主要的作用就是给图加上图例
plt.show()
"""
:return:
"""
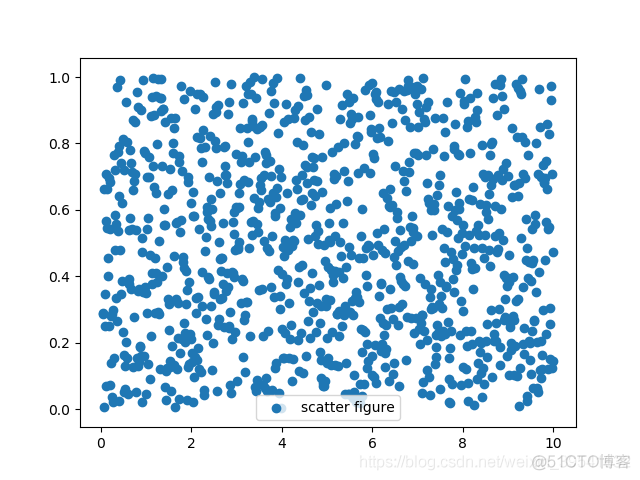
x = np.linspace(0.05, 10, 1000)
y = np.random.rand(1000)
plt.scatter(x, y, label='scatter figure')
plt.legend()
plt.show()
"""
:return:
"""
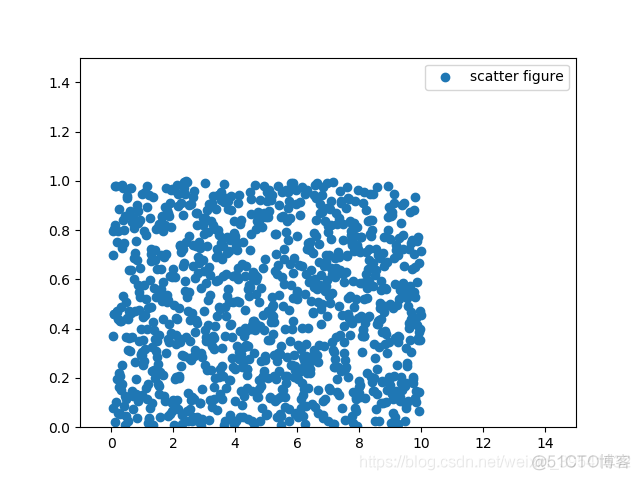
x = np.linspace(0.05, 10, 1000)
y = np.random.rand(1000)
plt.scatter(x, y, label='scatter figure')
plt.legend()
plt.xlim(-1, 15)
plt.ylim(0, 1.5)
plt.show()
"""
:return:
"""
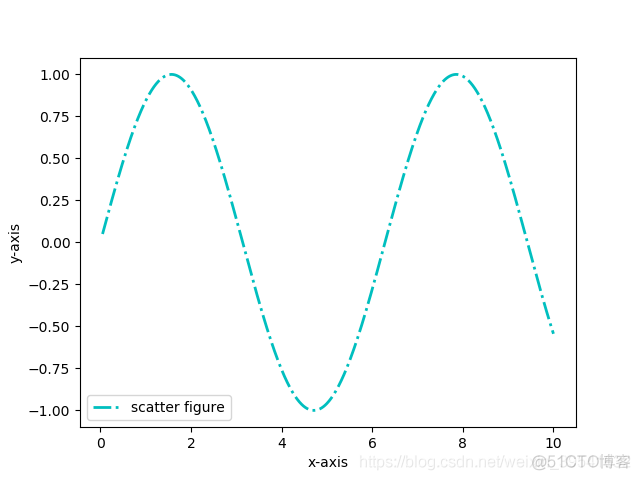
x = np.linspace(0.05, 10, 1000)
y = np.sin(x)
plt.plot(x, y, ls='-.', lw=2, c="c", label='plot figure')
plt.legend()
plt.xlabel("x-axis")
plt.ylabel("y-axis")
plt.show()
"""
:return:
"""
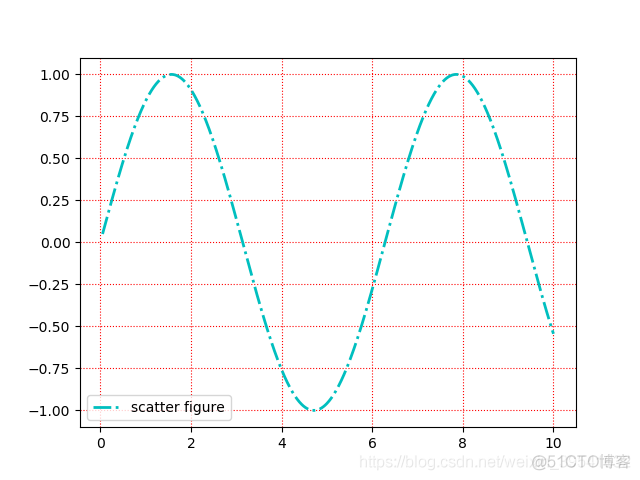
x = np.linspace(0.05, 10, 1000)
y = np.sin(x)
plt.plot(x, y, ls='-.', lw=2, c="c", label='scatter figure')
plt.legend()
plt.grid(linestyle=":", color='r')
plt.show()
"""
:return:
"""
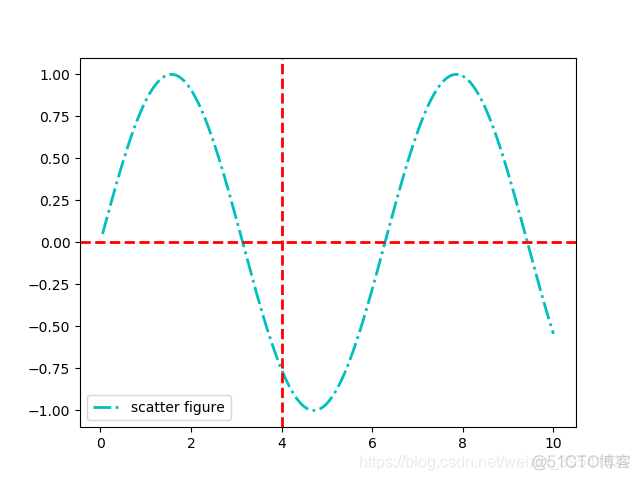
x = np.linspace(0.05, 10, 1000)
y = np.sin(x)
plt.plot(x, y, ls='-.', lw=2, c="c", label='plot figure')
"""
y: 水平参考线的出发点
c: 参考线的线条颜色
ls:参考线的线条风格
lw:参考线的线条宽度
"""
plt.legend()
plt.axhline(y=0.0, c="r", ls='--', lw=2)
plt.axvline(x=4.0, c='r', ls='--', lw=2)
plt.show()
"""
:return:
"""
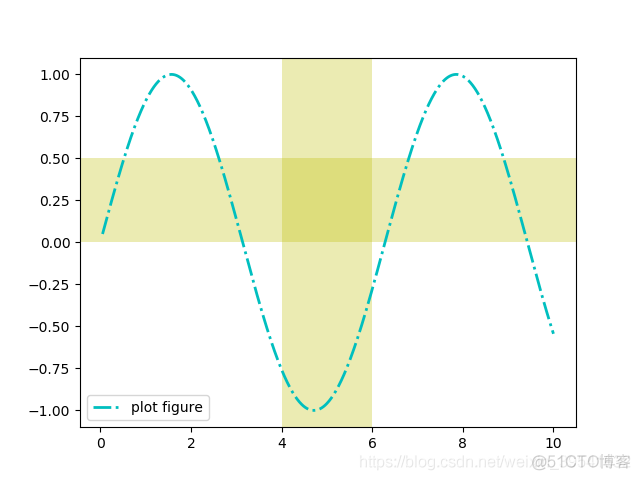
x = np.linspace(0.05, 10, 1000)
y = np.sin(x)
plt.plot(x, y, ls='-.', lw=2, c="c", label='plot figure')
plt.legend()
plt.axvspan(xmin=4.0,xmax=6.0,facecolor='y',alpha=0.3)
plt.axhspan(ymin=0.0,ymax=0.5,facecolor='y',alpha=0.3)
plt.savefig("exercise7.png")
plt.show()
"""
:return:
"""
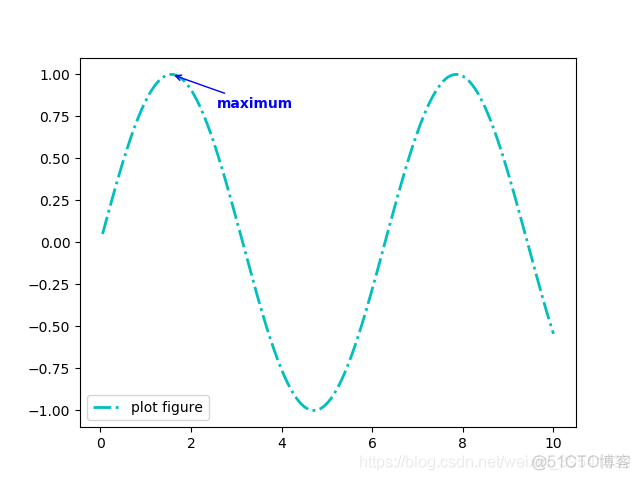
x = np.linspace(0.05, 10, 1000)
y = np.sin(x)
plt.plot(x, y, ls='-.', lw=2, c="c", label='plot figure')
plt.legend()
plt.annotate("maximum",xy=(np.pi/2,1.0),xytext=((np.pi/2)+1.0,.8),
weight="bold",color='b',arrowprops=dict(arrowstyle="->",
connectionstyle="arc3",color='b'))
plt.savefig("exercise8.png")
plt.show()
"""
:return:
"""
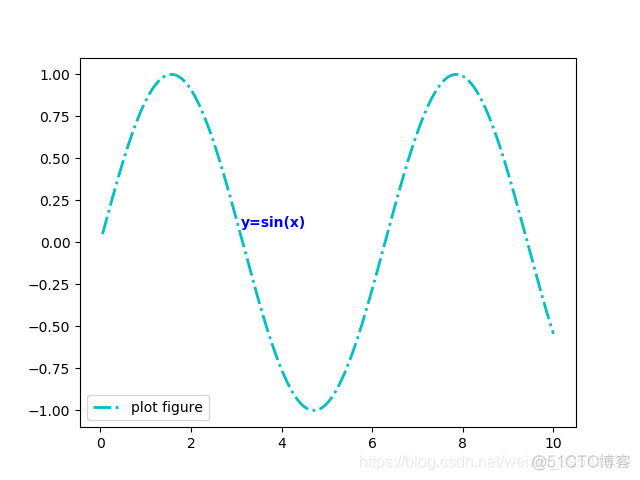
x = np.linspace(0.05, 10, 1000)
y = np.sin(x)
plt.plot(x, y, ls='-.', lw=2, c="c", label='plot figure')
plt.legend()
plt.text(3.10,0.09,"y=sin(x)",weight="bold",color="b")
plt.savefig("exercise9.png")
plt.show()
"""
:return:
"""
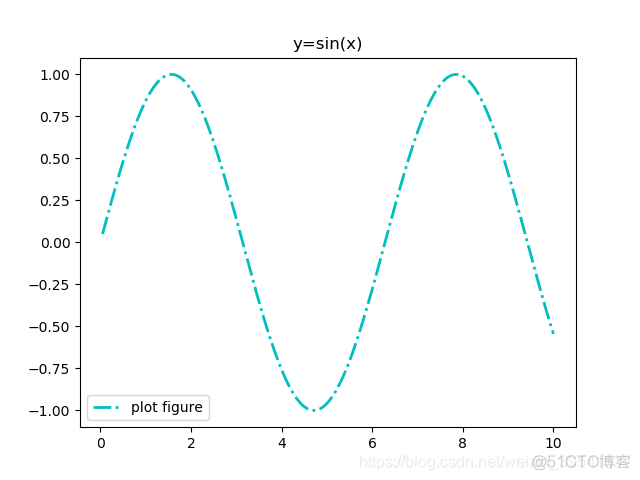
x = np.linspace(0.05, 10, 1000)
y = np.sin(x)
plt.plot(x, y, ls='-.', lw=2, c="c", label='plot figure')
plt.legend()
plt.title("y=sin(x)")
plt.savefig("exercise10.png")
plt.show()
"""
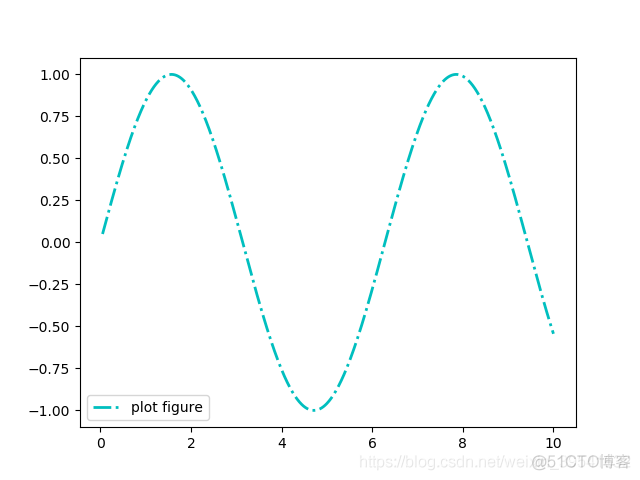
标识图例的位置
:return:
"""
x = np.linspace(0.05, 10, 1000)
y = np.sin(x)
plt.plot(x, y, ls='-.', lw=2, c="c", label='plot figure')
plt.legend(loc="lower left")
plt.savefig("exercise11.png")
plt.show()
"""
:return:
"""
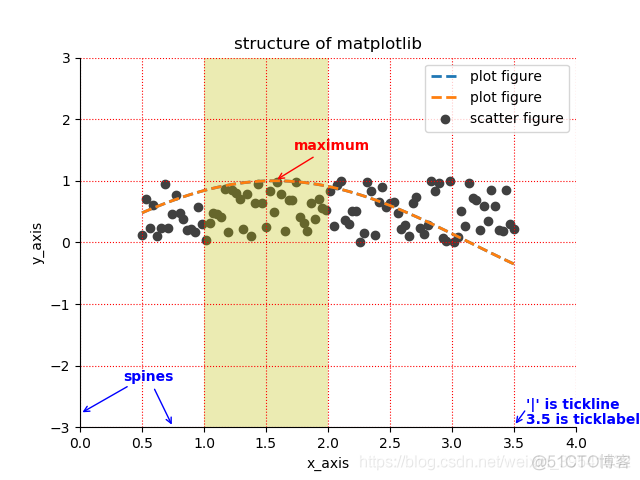
# define data
x = np.linspace(0.5,3.5,100)
y = np.sin(x)
y1=np.random.rand(100)
# scatter figure
plt.scatter(x,y1,c='0.25',label="scatter figure")
# plot figure
plt.plot(x,y,ls="--",lw=2,label="plot figure")
# plot figure
plt.plot(x,y,ls='--',lw=2,label="plot figure")
# some clean up(removing chartjunk)
# turn the top spine and the right spine off
for spine in plt.gca().spines.keys():
if spine == "top" or spine == "right":
plt.gca().spines[spine].set_color("none")
# turn bottom tick for x-axis on
plt.gca().xaxis.set_ticks_position("bottom")
# set tick_line position of bottom
# leave left ticks for y-axis on
plt.gca().yaxis.set_ticks_position("left")
# set tick_line position of left
# set x, yaxis limie
plt.xlim(0.0,4.0)
plt.ylim(-3.0,3.0)
# set axes labels
plt.ylabel("y_axis")
plt.xlabel("x_axis")
# set x,yaxis grid
plt.grid(True,ls=':',color='r')
# add a horizontal line across the axis
plt.axvspan(xmin=1.0,xmax=2.0,facecolor="y",alpha=.3)
# set annotation info
plt.annotate("maximum",xy=(np.pi/2,1.0),xytext=((np.pi/2)+0.15,1.5),
weight="bold",color='r',arrowprops=dict(arrowstyle="->",
connectionstyle='arc3',color='r'))
plt.annotate("spines",xy=(0.75,-3),xytext=(0.35,-2.25),weight="bold",
color='b',arrowprops=dict(arrowstyle="->",
connectionstyle='arc3',color='b'))
plt.annotate("", xy=(0, -2.78), xytext=(0.4, -2.32),
arrowprops=dict(arrowstyle="->",
connectionstyle='arc3',
color='b'))
plt.annotate("", xy=(3.5, -2.98), xytext=(3.6, -2.70), arrowprops=dict(arrowstyle="->",
connectionstyle='arc3',
color='b'))
# set text info
plt.text(3.6,-2.70,"'|' is tickline",weight="bold",color='b')
plt.text(3.6, -2.95, "3.5 is ticklabel", weight="bold", color='b')
# set title
plt.title('structure of matplotlib')
# set legend
plt.legend()
plt.savefig("exercise12.png")
plt.show()
- 本篇博文特别感谢刘大成的《Python数据可视化之matplotlib实践》
