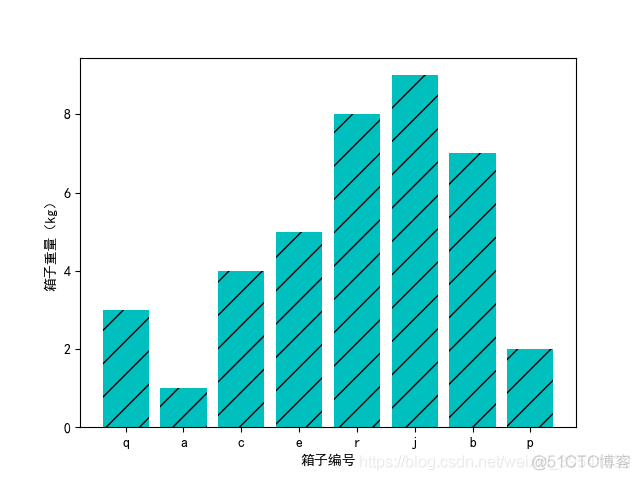
import matplotlib as mpl import matplotlib . pyplot as plt import numpy as np 绘制柱状图 def no1 (): """ :return: """ # 展示图表中的中文字体 mpl . rcParams [ "font.sans-serif" ] = [ "SimHei" ] # 不使用默认的"Unicode min
import matplotlib.pyplot as plt
import numpy as np
"""
:return:
"""
# 展示图表中的中文字体
mpl.rcParams["font.sans-serif"] = ["SimHei"]
# 不使用默认的"Unicode minus"模式来处理坐标轴轴线的刻度标签是负数的情况
# 一般使用"ASCII hyphen"模式来处理坐标轴轴线的负刻度值情况
mpl.rcParams["axes.unicode_minus"] = False
x = [1, 2, 3, 4, 5, 6, 7, 8]
y = [3, 1, 4, 5, 8, 9, 7, 2]
# x:柱状图中的柱体标签值
# y:柱状图中的柱体高度
# align:柱体对齐方式
# color: 柱体颜色
# tick_label:刻度标签值
# alpha:柱体的透明度
plt.bar(
x,
y,
align="center",
color='c',
tick_label=[
"q",
'a',
'c',
'e',
'r',
'j',
'b',
'p'],
hatch='/')
# hatch参数可以设置柱体的填充样式(/,\\,|,-等)
plt.xlabel("箱子编号")
plt.ylabel("箱子重量(kg)")
plt.savefig(r"E:\Programmer\PYTHON\Matplotlib实践\figure\Figure(Unit "
r"2)\no1.png")
plt.show()
"""
:return:
"""
mpl.rcParams["font.sans-serif"] = ["SimHei"]
mpl.rcParams["axes.unicode_minus"] = False
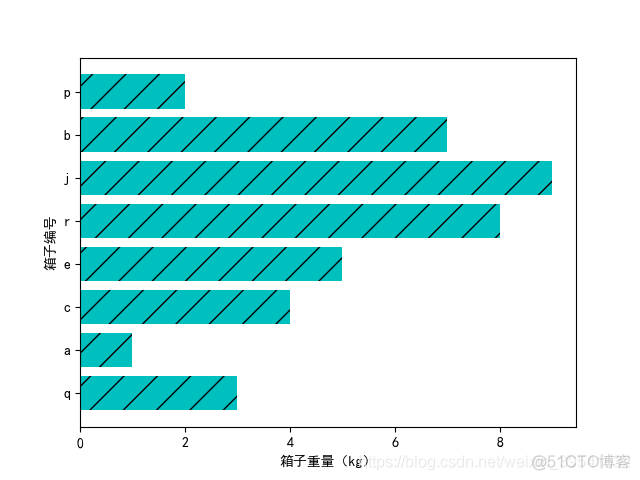
x = [1, 2, 3, 4, 5, 6, 7, 8]
y = [3, 1, 4, 5, 8, 9, 7, 2]
plt.barh(
x,
y,
align="center",
color='c',
tick_label=[
"q",
'a',
'c',
'e',
'r',
'j',
'b',
'p'],
hatch='/')
plt.xlabel("箱子重量(kg)")
plt.ylabel("箱子编号")
plt.savefig(r"E:\Programmer\PYTHON\Matplotlib实践\figure\Figure(Unit "
r"2)\no2.png")
plt.show()
"""
:return:
"""
mpl.rcParams["font.sans-serif"] = ["SimHei"]
mpl.rcParams["axes.unicode_minus"] = False
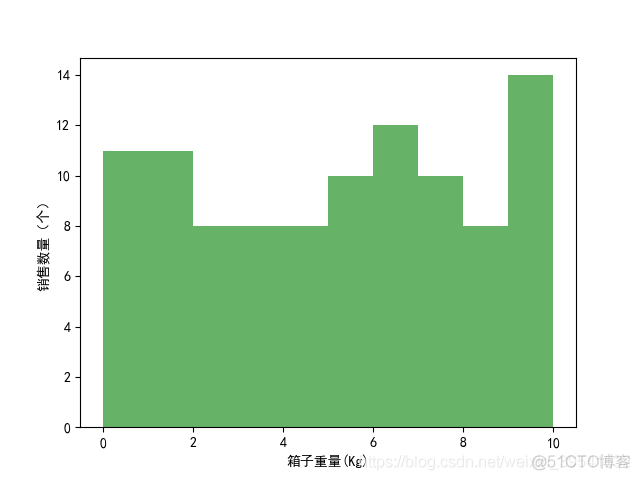
boxWeight = np.random.randint(0, 10, 100)
x = boxWeight
bins = range(0, 11, 1)
plt.hist(x, bins=bins, color='g', histtype="bar", rwidth=1, alpha=0.6)
plt.xlabel("箱子重量(Kg)")
plt.ylabel("销售数量(个)")
plt.savefig(r"E:\Programmer\PYTHON\Matplotlib实践\figure\Figure(Unit "
r"2)\no3.png")
plt.show()
"""
:return:
"""
mpl.rcParams["font.sans-serif"] = ["SimHei"]
mpl.rcParams["axes.unicode_minus"] = False
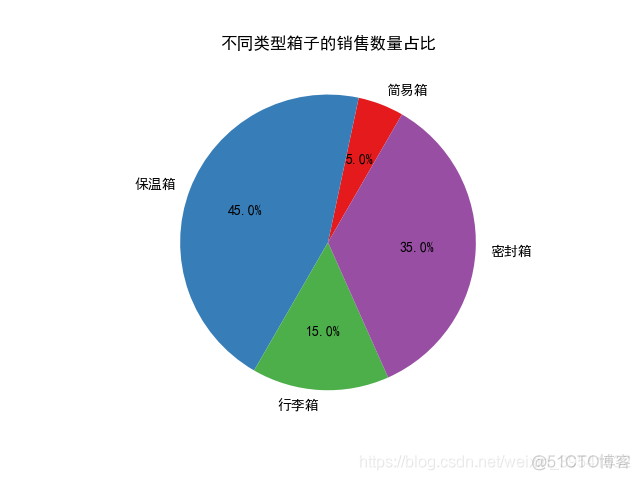
kinds = "简易箱", "保温箱", "行李箱", "密封箱"
colors = ["#e41a1c", "#377eb8", "#4daf4a", "#984ea3"]
soldNums = [0.05, 0.45, 0.15, 0.35]
plt.pie(soldNums, labels=kinds, autopct="%3.1f%%", startangle=60,
colors=colors)
plt.title("不同类型箱子的销售数量占比")
plt.savefig(r"E:\Programmer\PYTHON\Matplotlib实践\figure\Figure(Unit "
r"2)\no4.png")
plt.show()
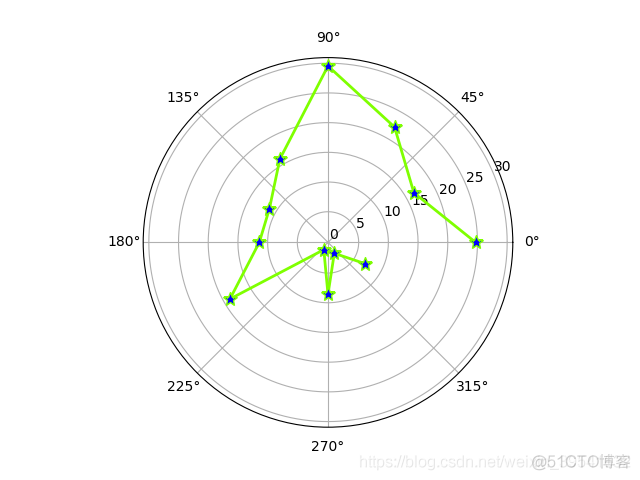
"""
:return:
"""
barSlices = 12
theta = np.linspace(0.0, 2 * np.pi, barSlices, endpoint=False)
r = 30 * np.random.rand(barSlices)
plt.polar(
theta,
r,
color='chartreuse',
linewidth=2,
marker="*",
mfc='b',
ms=10)
plt.savefig(r"E:\Programmer\PYTHON\Matplotlib实践\figure\Figure(Unit "
r"2)\no5.png")
plt.show()
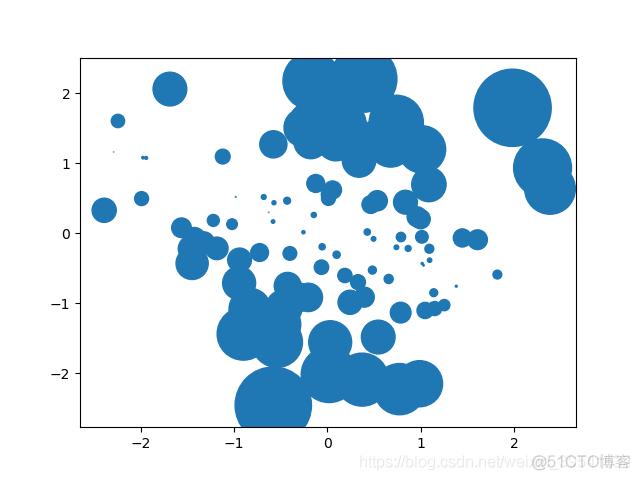
"""
:return:
"""
a = np.random.randn(100)
b = np.random.randn(100)
plt.scatter(
a,
b,
s=np.power(
10 * a + 20 * b,
2),
cmap=mpl.cm.RdYlBu,
marker='o')
plt.savefig(r"E:\Programmer\PYTHON\Matplotlib实践\figure\Figure(Unit "
r"2)\no6.png")
plt.show()
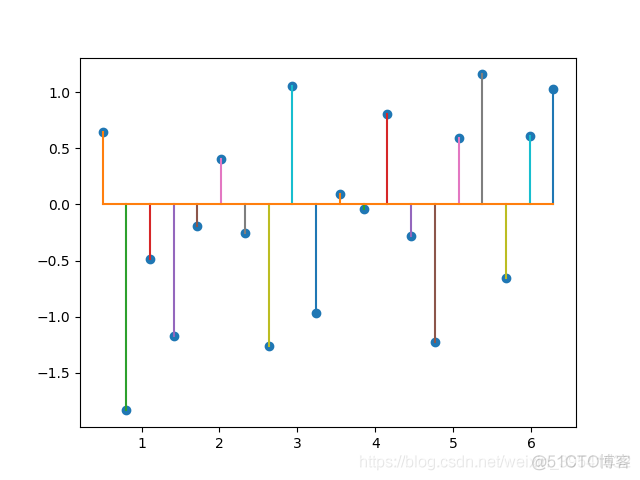
"""
:return:
"""
x = np.linspace(0.5, 2 * np.pi, 20)
y = np.random.randn(20)
plt.stem(x, y, linefmt='-', markerfmt='o', basefmt='-')
plt.savefig(r"E:\Programmer\PYTHON\Matplotlib实践\figure\Figure(Unit "
r"2)\no7.png")
plt.show()
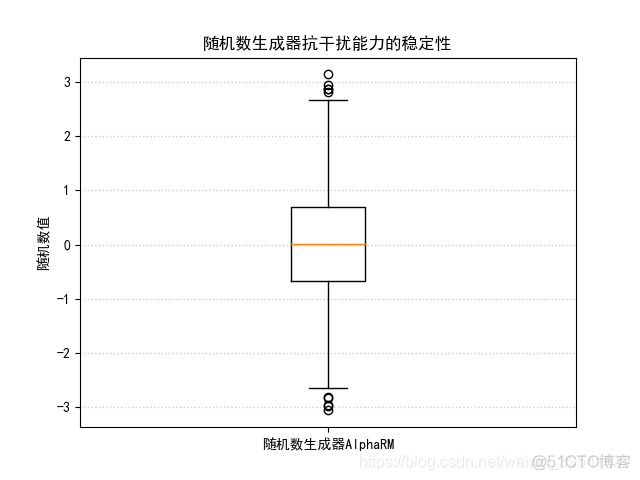
"""
:return:
"""
mpl.rcParams["font.sans-serif"] = ["SimHei"]
mpl.rcParams["axes.unicode_minus"] = False
x = np.random.randn(1000)
plt.boxplot(x)
plt.xticks([1], ["随机数生成器AlphaRM"])
plt.ylabel("随机数值")
plt.title("随机数生成器抗干扰能力的稳定性")
plt.grid(axis='y', ls=':', lw=1, color='gray', alpha=0.4)
plt.savefig(r"E:\Programmer\PYTHON\Matplotlib实践\figure\Figure(Unit "
r"2)\no8.png")
plt.show()
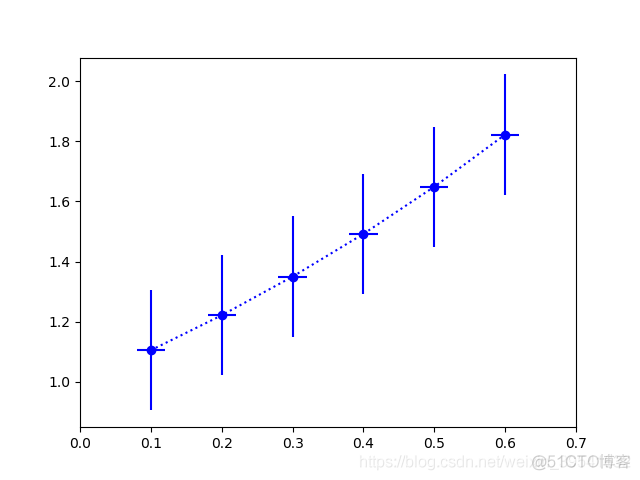
"""
:return:
"""
x = np.linspace(0.1, 0.6, 6)
y = np.exp(x)
plt.errorbar(x, y, fmt="bo:", yerr=0.2, xerr=0.02)
plt.xlim(0, 0.7)
plt.savefig(r"E:\Programmer\PYTHON\Matplotlib实践\figure\Figure(Unit "
r"2)\no9.png")
plt.show()
- 本篇博文特别感谢刘大成的《Python数据可视化之matplotlib实践》
