zabbix API以及grafana zabbix API 模拟用户登录获取token [root@zabbix ~]# curl -s -X POST -H 'Content-Type:application/json' -d ' { jsonrpc: 2.0, method: user.login, params: { user: Admin, password: zabbix }, id: 1, auth: null }' ht
zabbix API以及grafana
zabbix API
模拟用户登录获取token
[root@zabbix ~]# curl -s -X POST -H 'Content-Type:application/json' -d ' > { > "jsonrpc": "2.0", > "method": "user.login", > "params": { > "user": "Admin", > "password": "zabbix" > }, > "id": 1, > "auth": null > }' http://zabbix.wsh.com/api_jsonrpc.php {"jsonrpc":"2.0","result":"ae4638eaa9a14c923ccdd13439e0096e","id":1}添加主机
## 获取主机组ID curl -s -X POST -H 'Content-Type:application/json-rpc ' -d ' { "jsonrpc": "2.0", "method": "hostgroup.get", "params": { "output": "extend", "filter": { "name": [ "Linux servers" ] } }, "auth": "ae4638eaa9a14c923ccdd13439e0096e", "id": 1 }' http://zabbix.wsh.com/api_jsonrpc.php ## 获取模板的id curl -s -X POST -H 'Content-Type:application/json-rpc ' -d ' { "jsonrpc": "2.0", "method": "template.get", "params": { "output": "extend", "filter": { "host": [ "diy item by zls" ] } }, "auth": "ae4638eaa9a14c923ccdd13439e0096e", "id": 1 }' http://zabbix.wsh.com/api_jsonrpc.php curl -s -X POST -H 'Content-Type:application/json-rpc ' -d ' { "jsonrpc": "2.0", "method": "host.create", "params": { "host": "zls_xxx", "interfaces": [ { "type": 1, "main": 1, "useip": 1, "ip": "172.16.1.77", "dns": "", "port": "10050" } ], "groups": [ { "groupid": "2" } ], "templates": [ { "templateid": "10438" } ], "inventory_mode": 0, "inventory": { "macaddress_a": "01234", "macaddress_b": "56768" } }, "auth": "ae4638eaa9a14c923ccdd13439e0096e2", "id": 1 }' http://zabbix.wsh.com/api_jsonrpc.phpzabbix集成寡妇
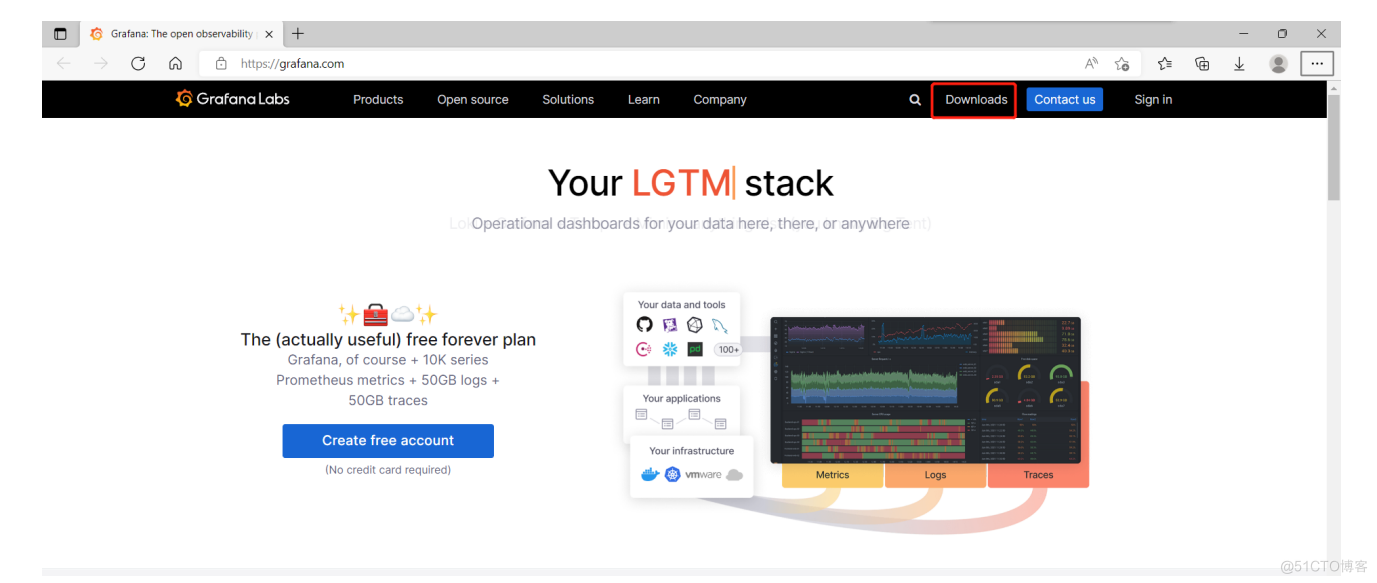
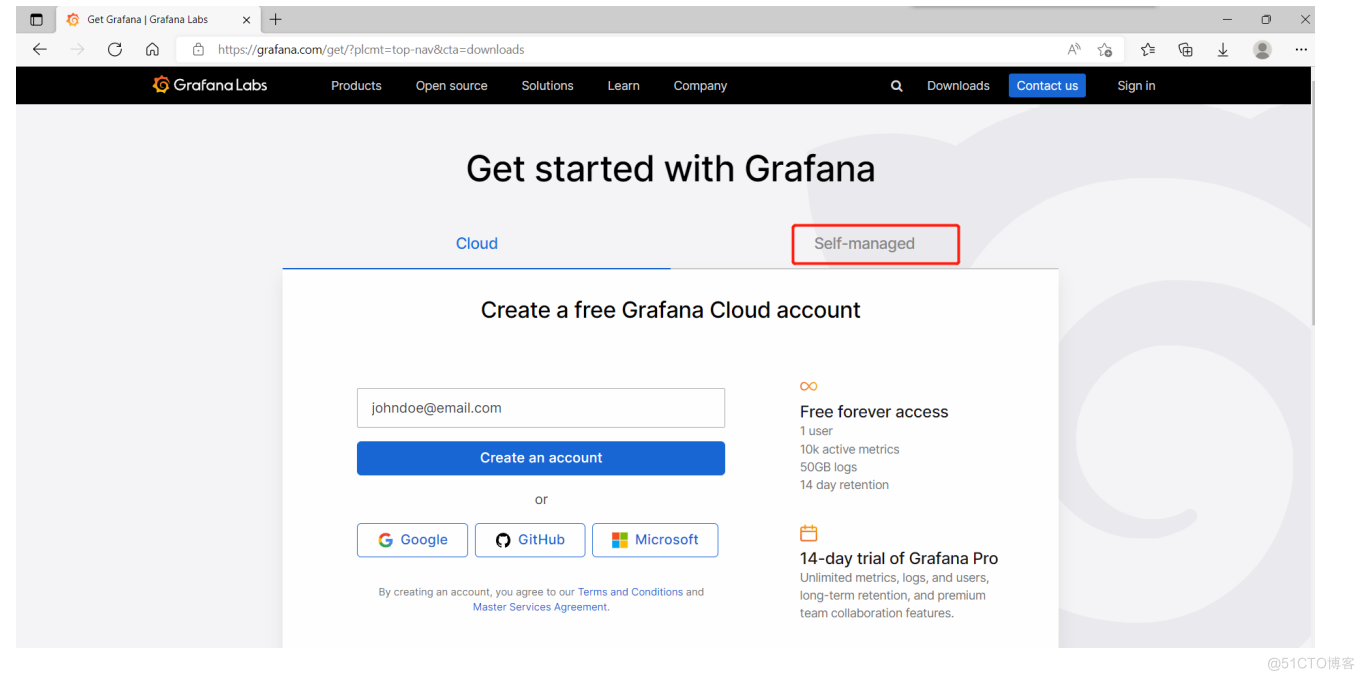
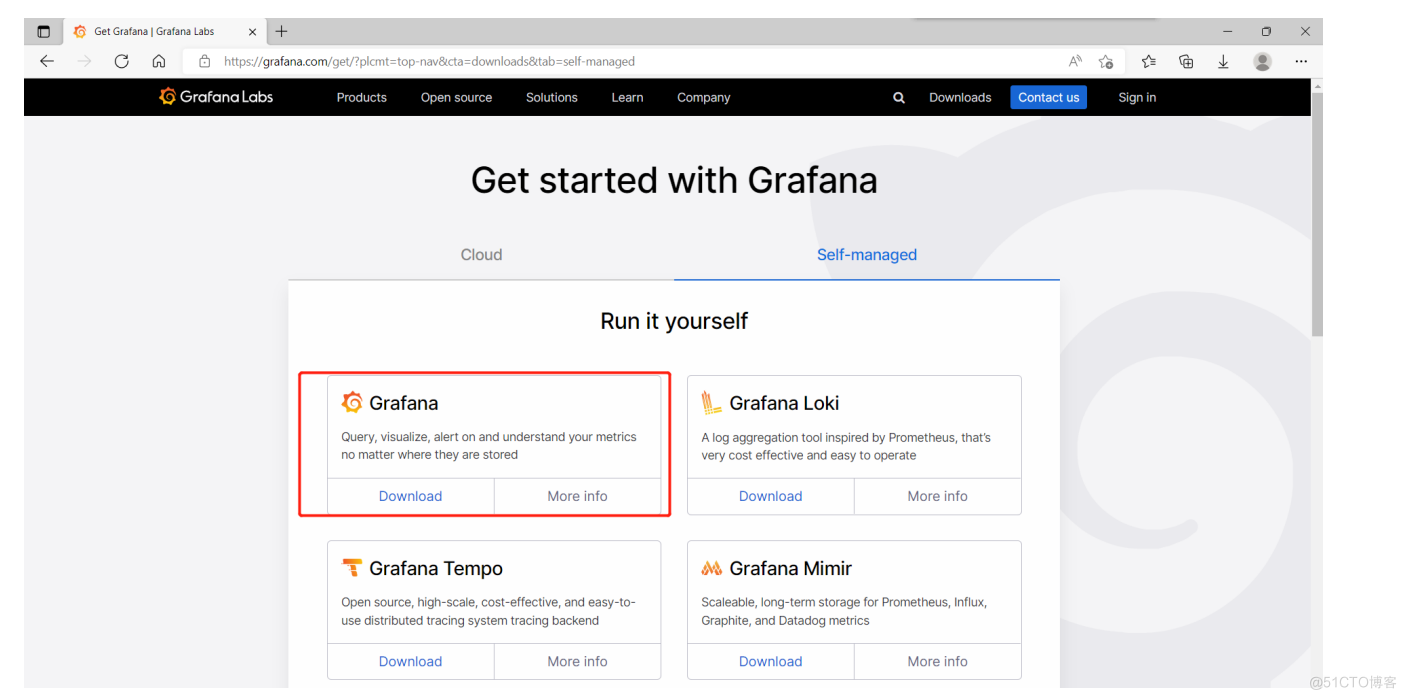
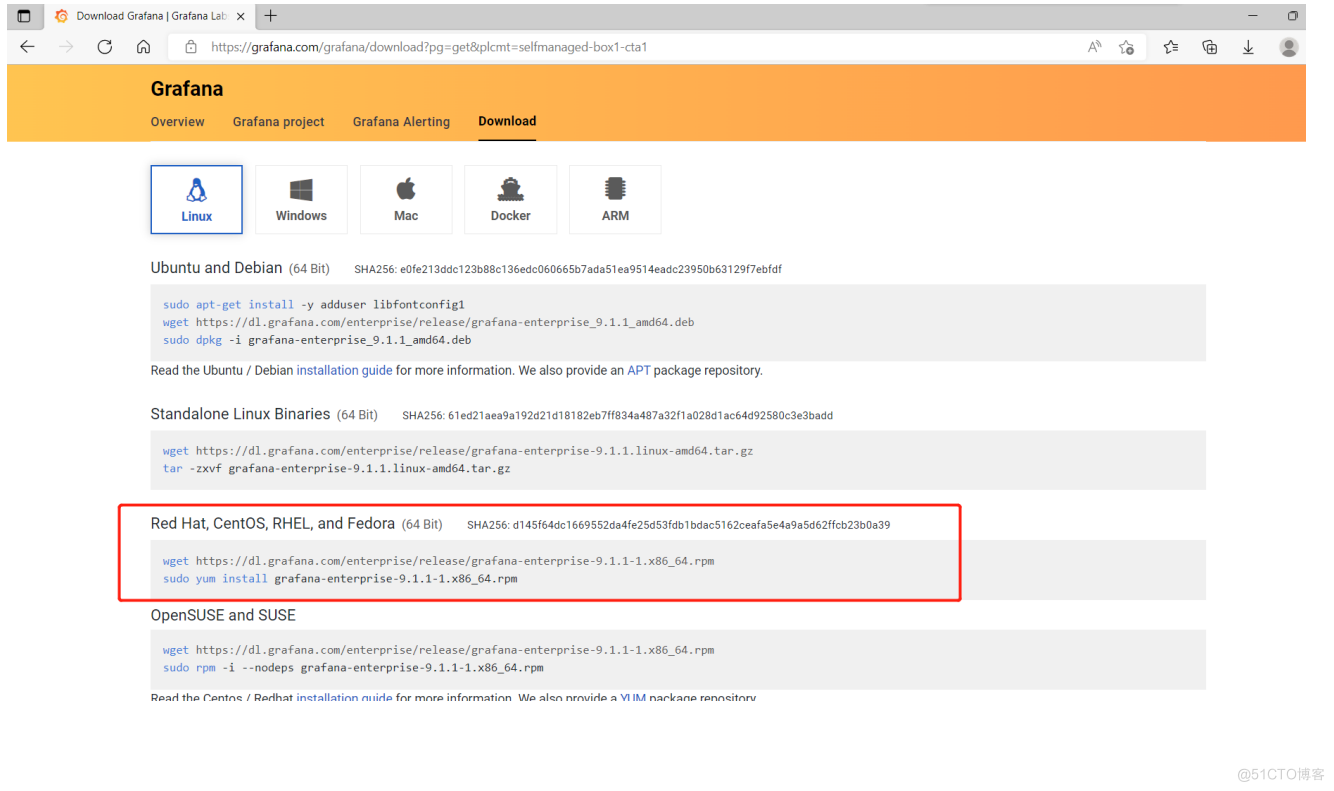
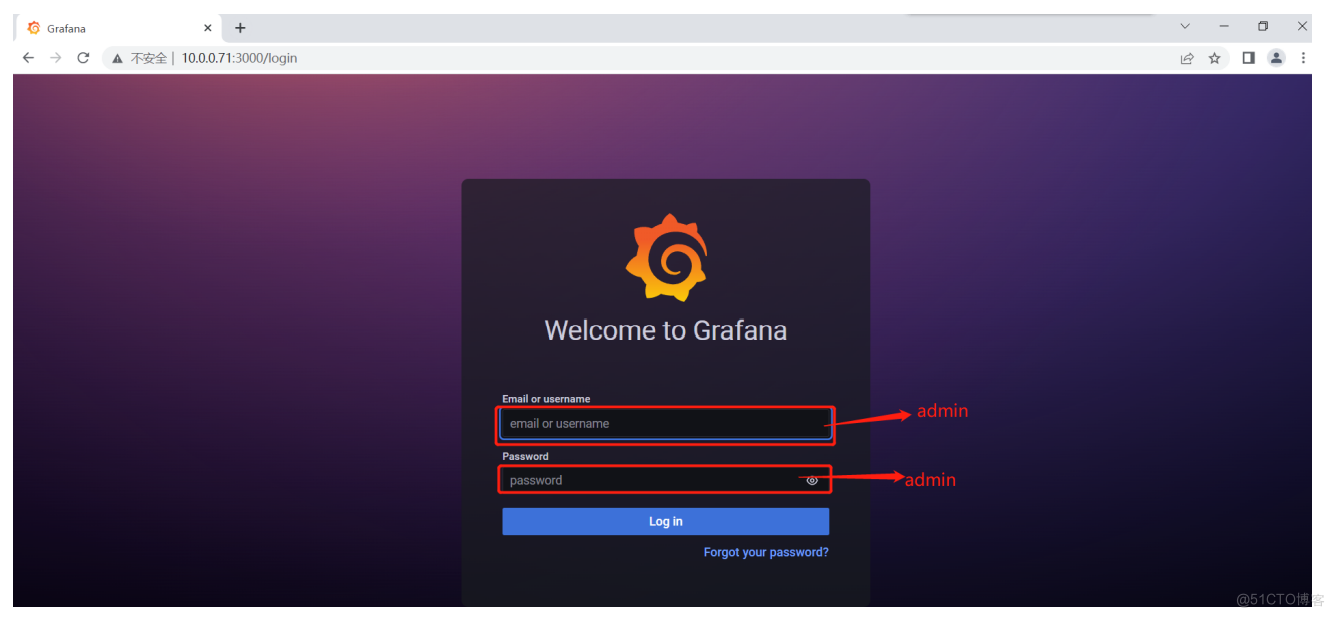
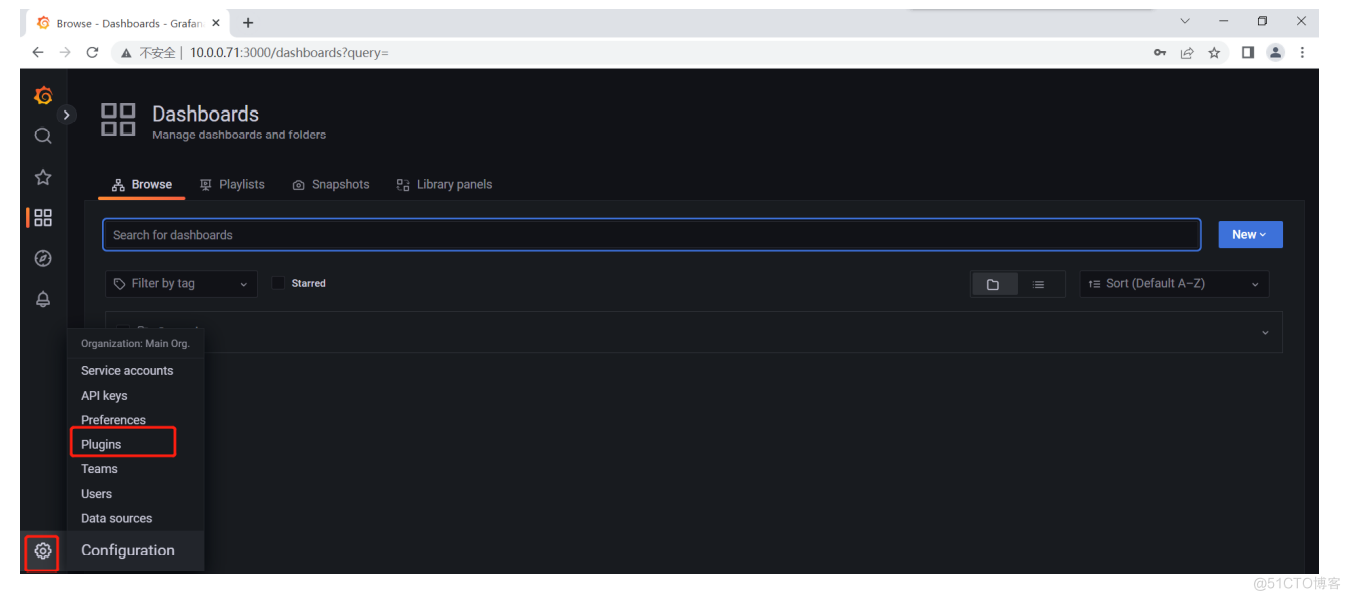
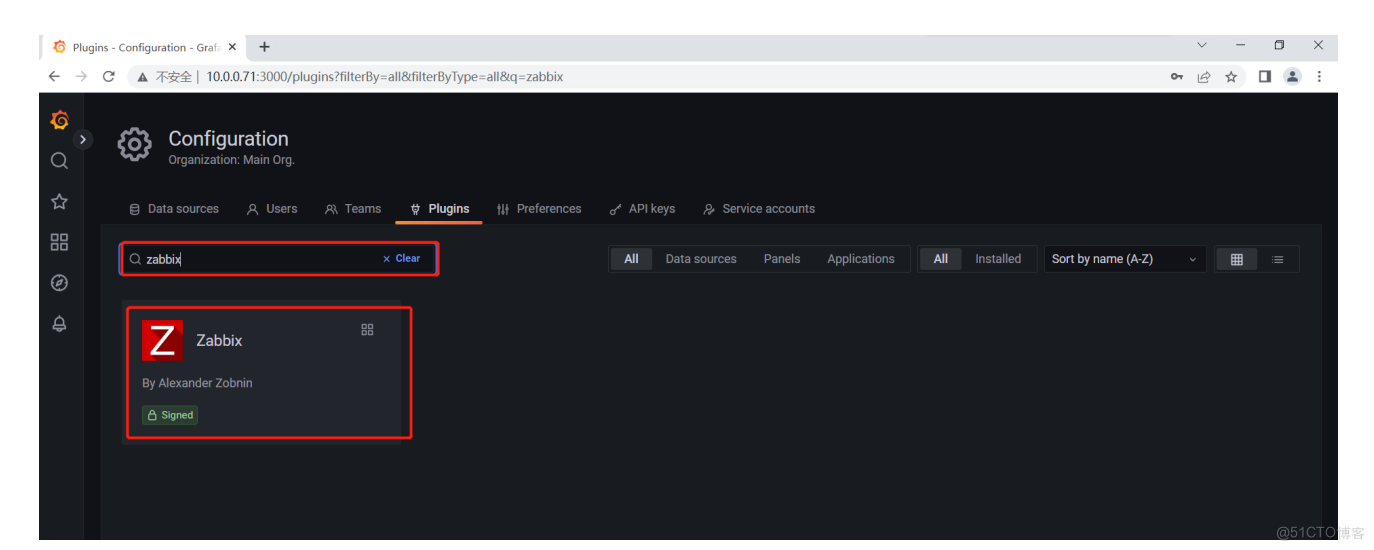
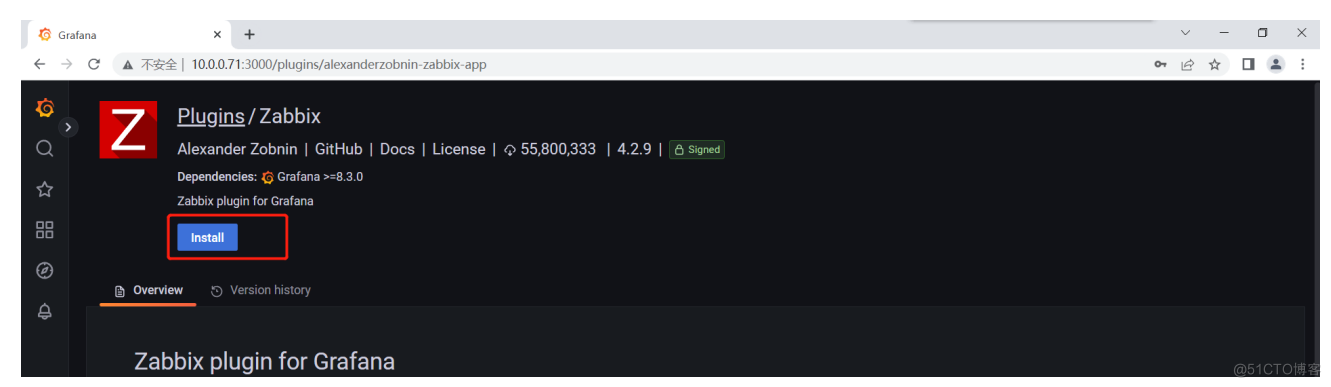
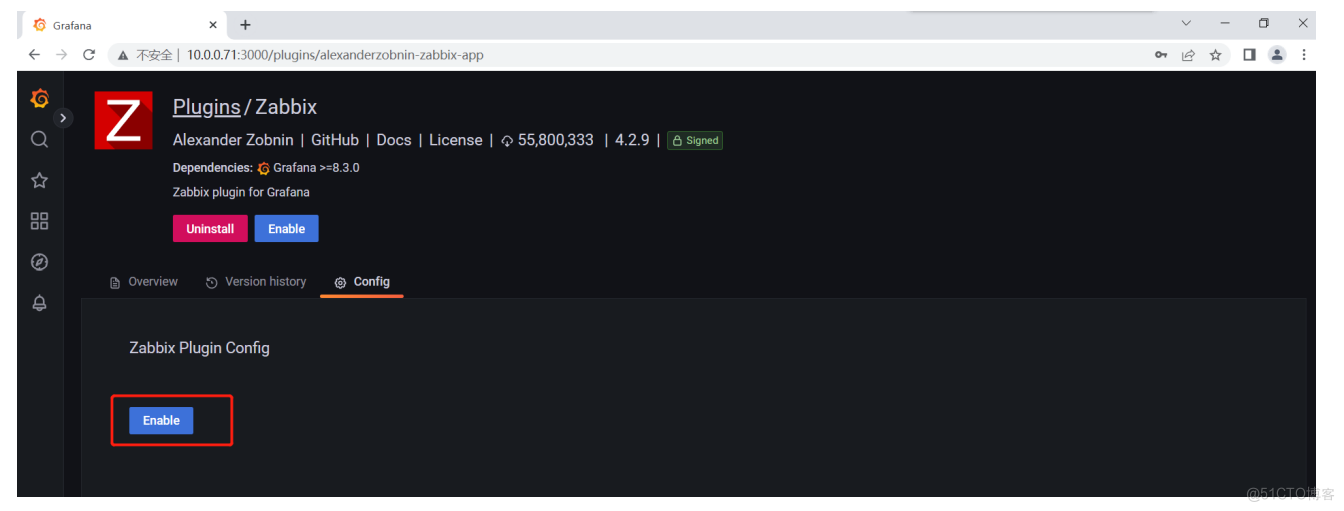
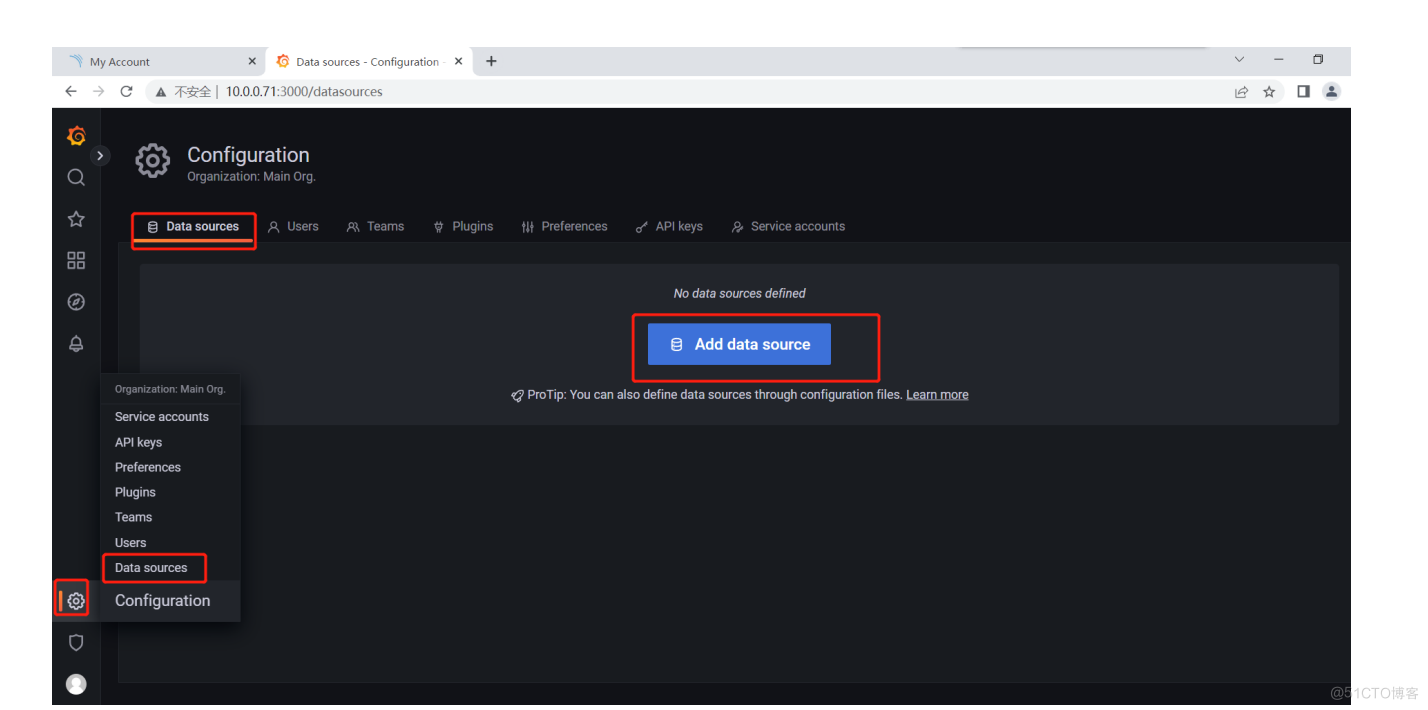
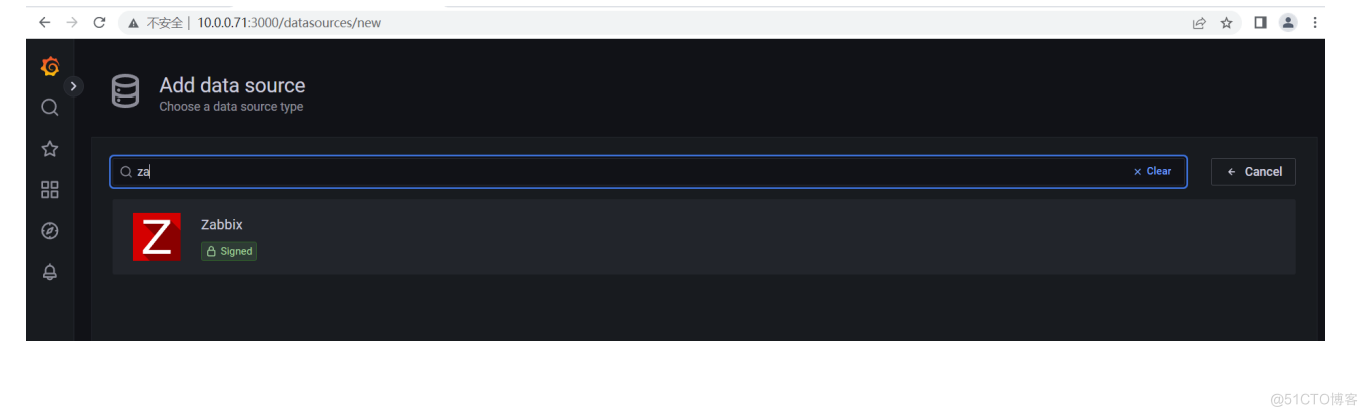
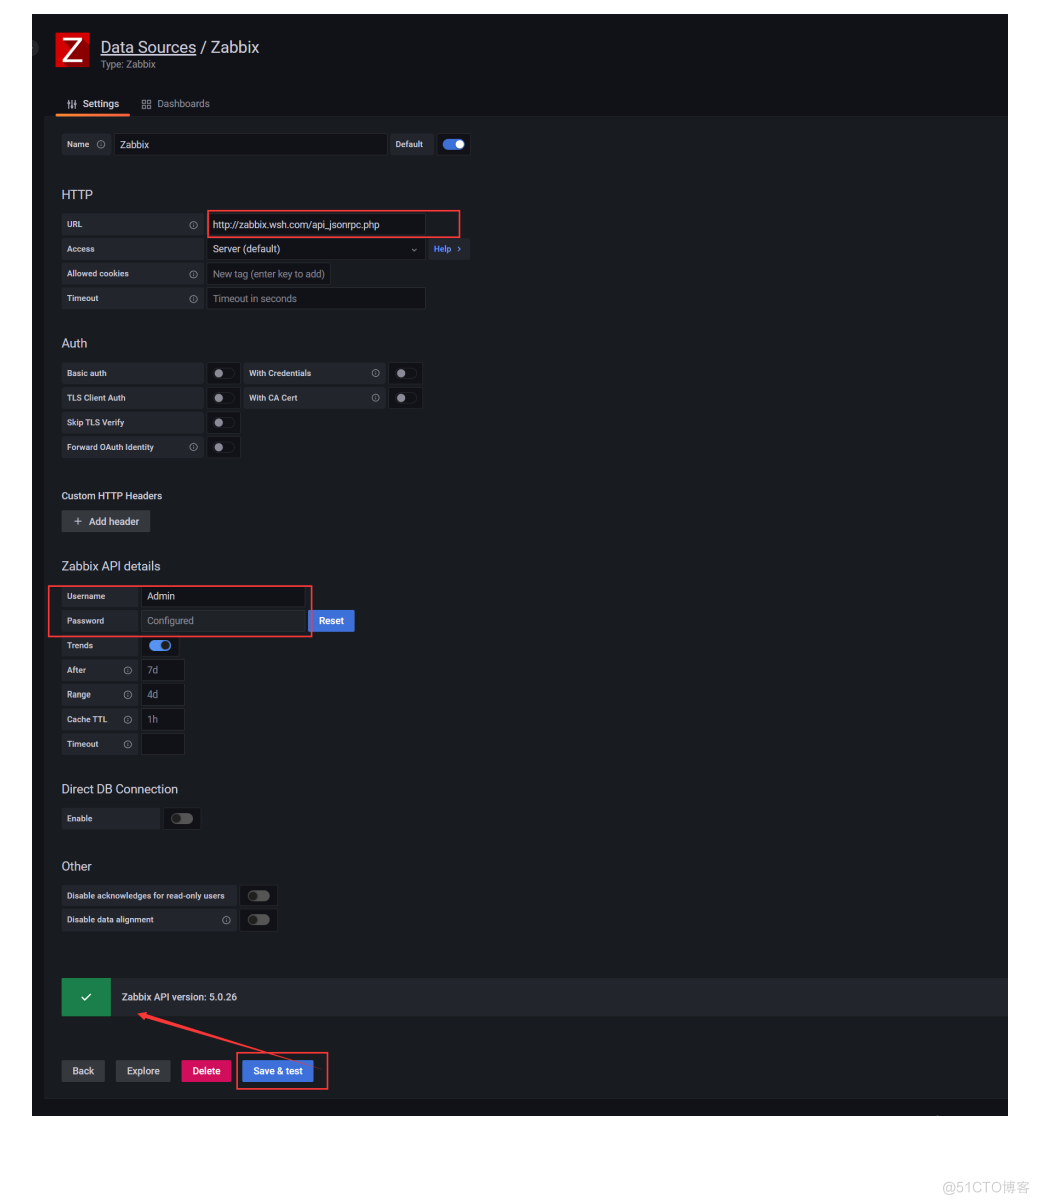
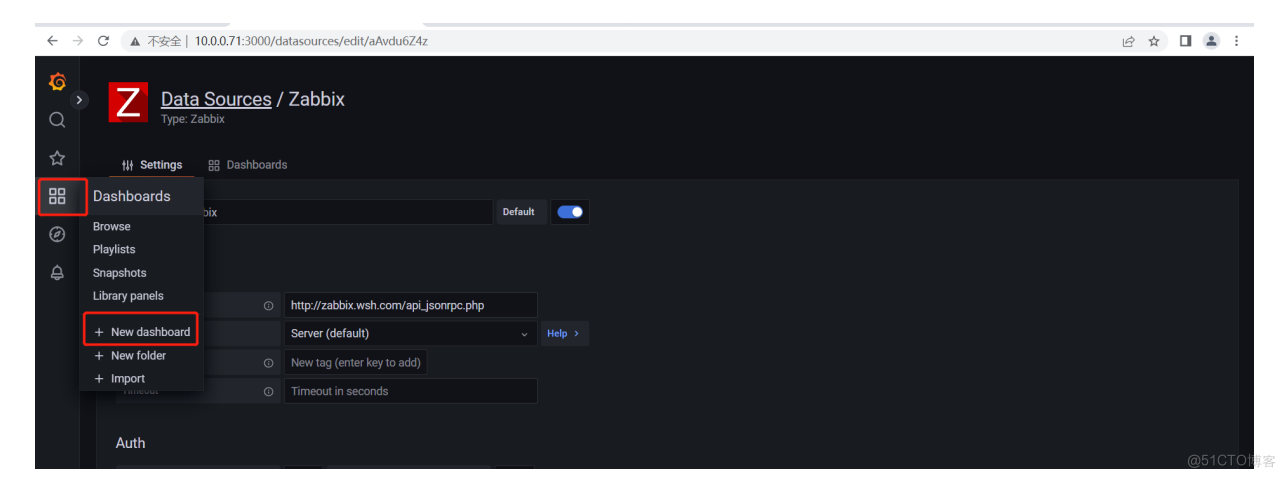
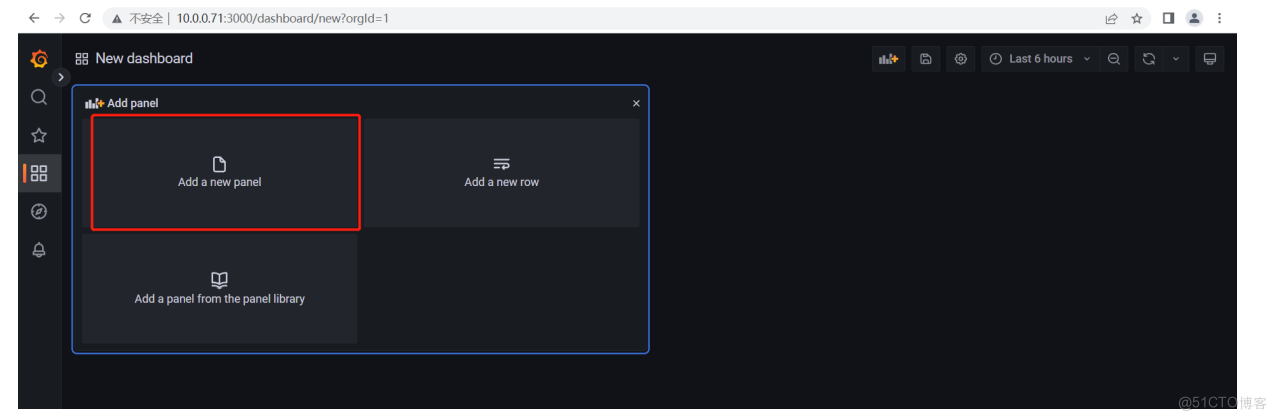
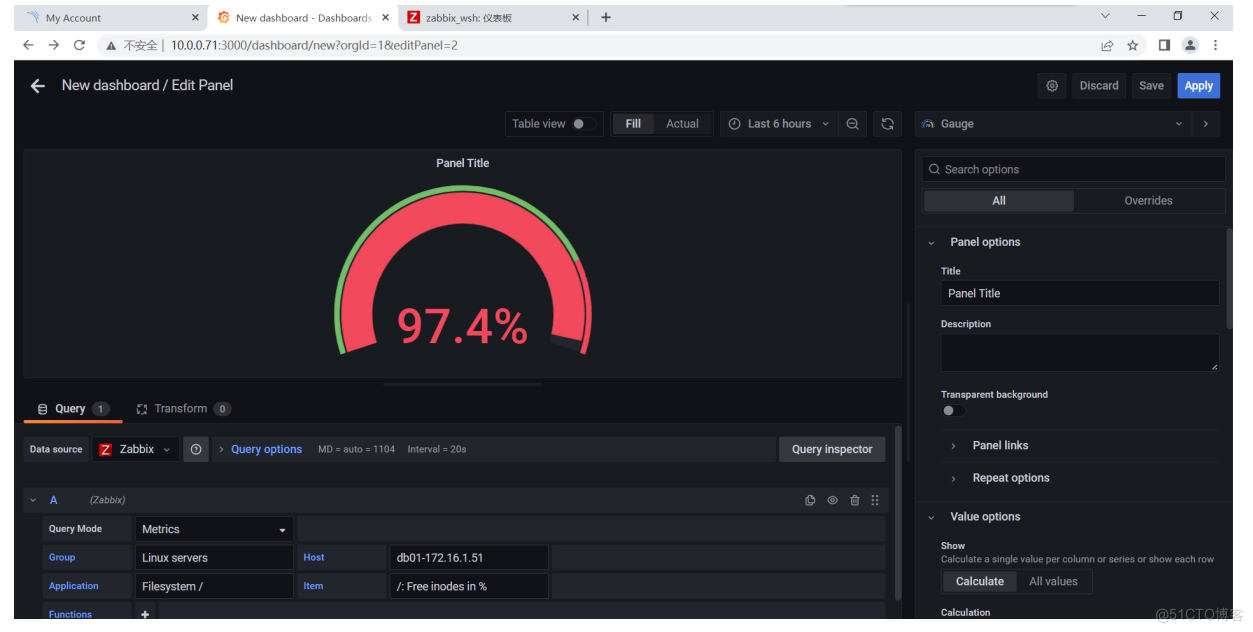
https://grafana.com/
zabbix性能调优
Zabbix属于写多读少的业务, 所以需要针对zabbix的MySQL进行拆分。MySQL一定要使用SSD固态盘
将Zabbix-Agent被动监控模式, 调整为主动监控模式。
使用zabbix-proxy分布式监控, 在大规模监控时用于缓解Zabbix-Server压力
去掉无用监控项, 增加监控项的取值间隔, 减少历史数据保存周期(由housekeeper进程定时清理)
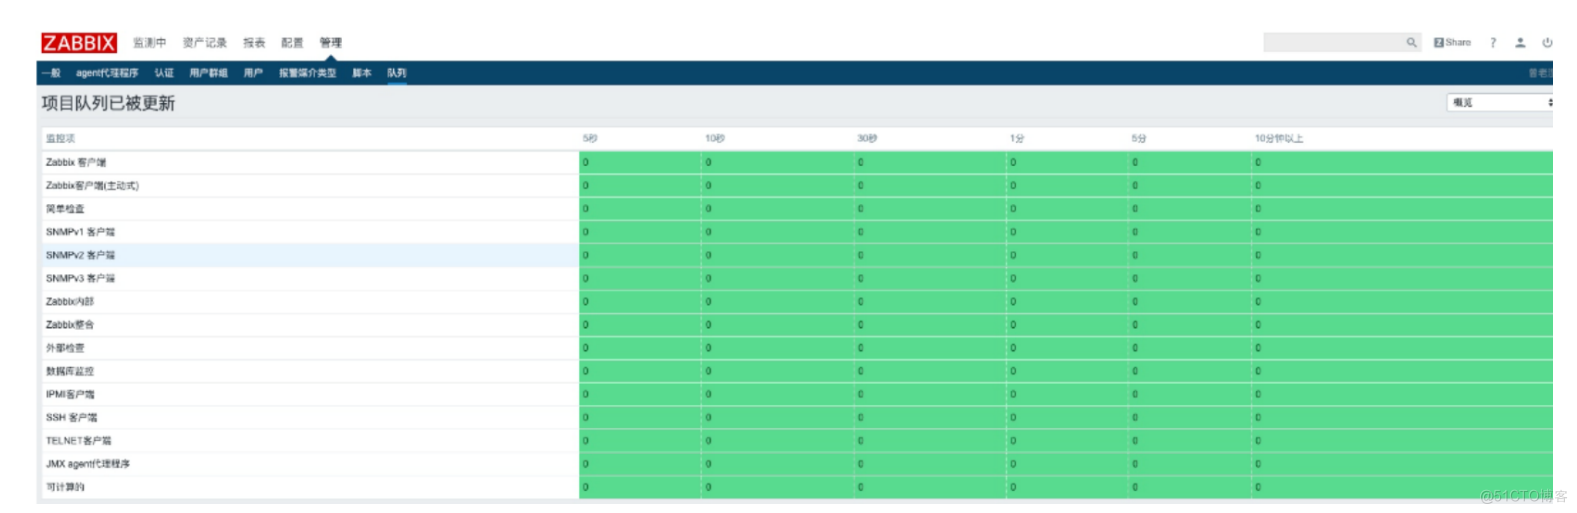
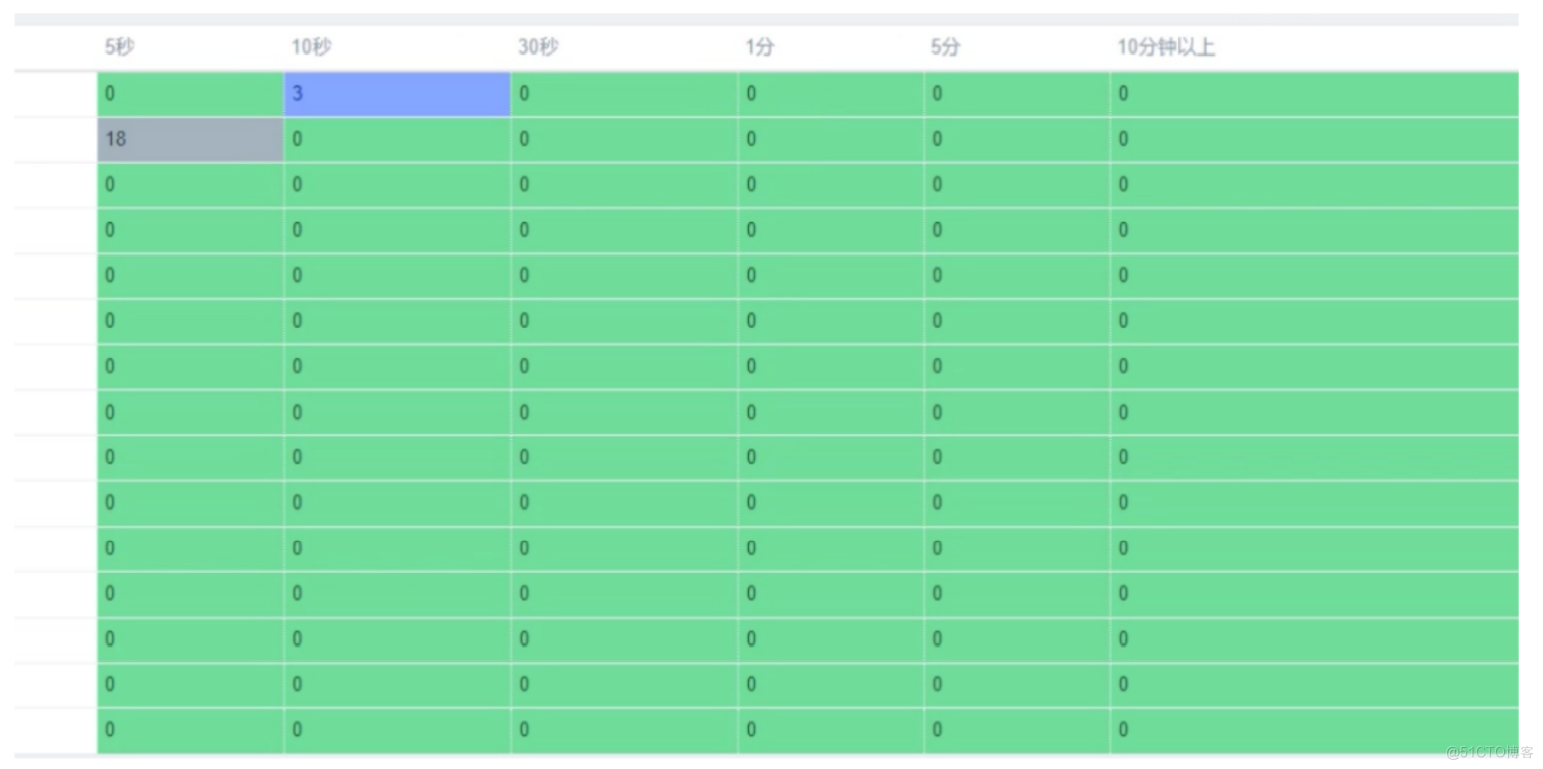
5)针对于Zabbix-server进程调优, 谁忙就加大谁的进程数量, 具体取决实际情况, 不是越大越好
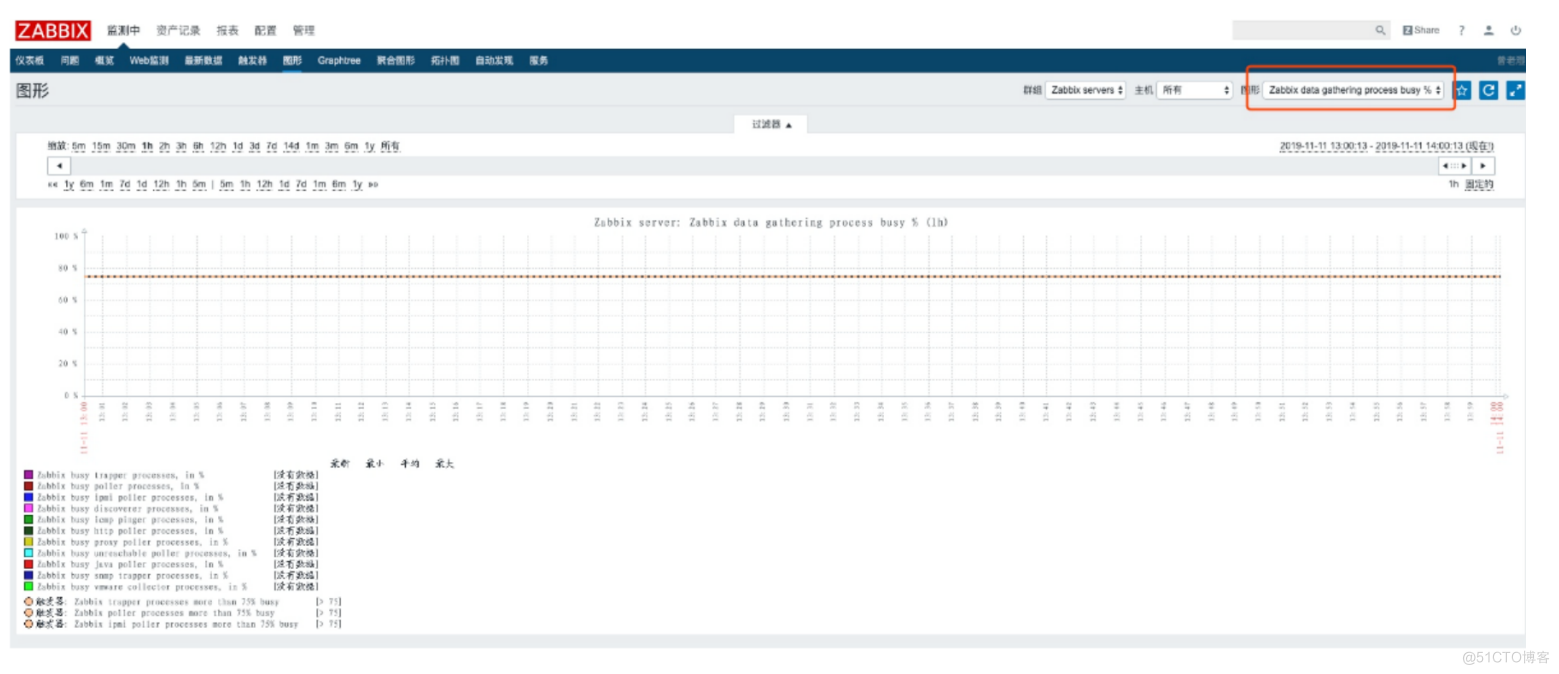
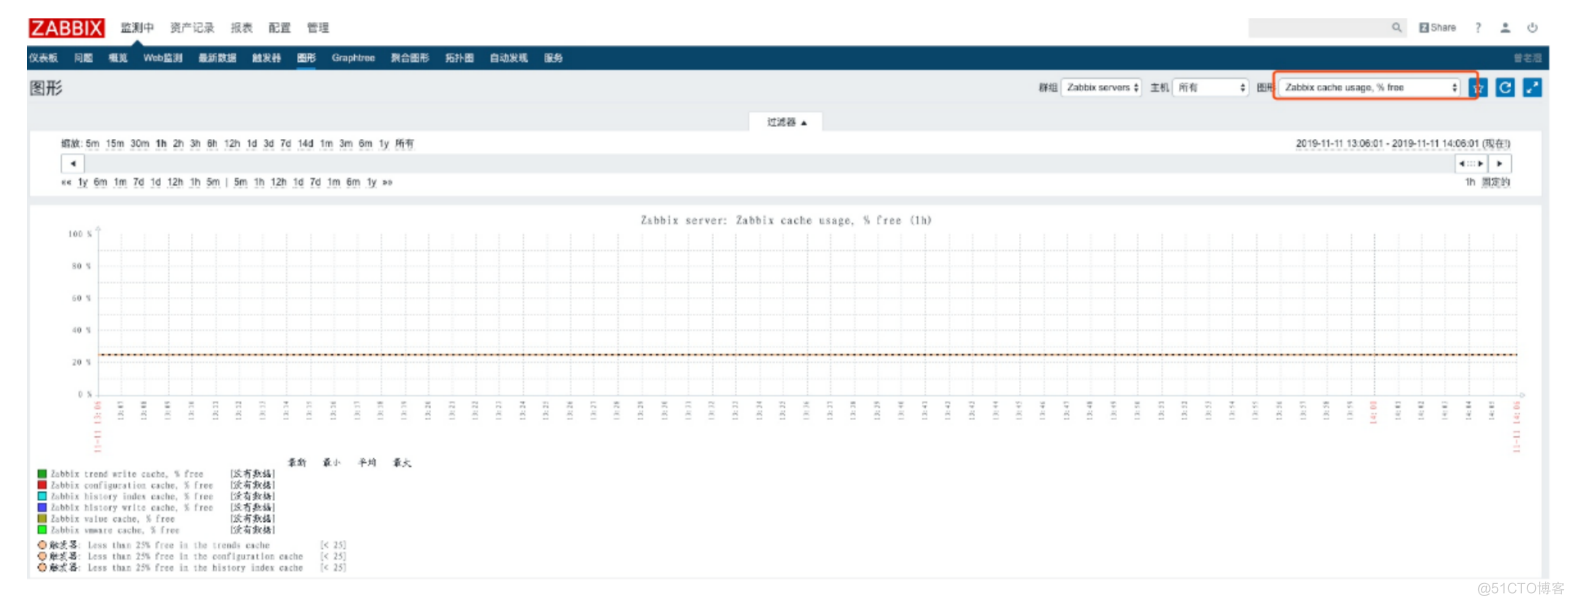
6)针对于Zabbix-server缓存调优, 谁的剩余内存少, 就加大它的缓存值(zabbix cache usage图表)