效果图 不显示折线图上的拐点方法 ,3个都可以使用,代码中有显示在什么位置使用。 symbolSize:0, symbol:none, showSymbol:false, 代码: var mess = ["00:00", "03:00", "06:00", "09:00", "12:00", "15:00", "1
效果图
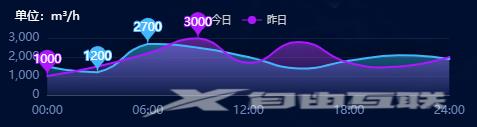
不显示折线图上的拐点方法 ,3个都可以使用,代码中有显示在什么位置使用。
symbolSize:0,
symbol:“none”,
showSymbol:false,
代码:
var mess = ["00:00", "03:00", "06:00", "09:00", "12:00", "15:00", "18:00", "21:00", "24:00"];
    var mess3 = preData;
    var mess4 = curData;
    var option = {
      legend: {
        show: true,
        itemWidth: 20,
        itemHeight: 10,
        itemGap: 10,
        textStyle: {
          fontSize: 10,
          color: "#ccc",
        },
      },
      tooltip: {
        trigger: "axis",
        axisPointer: {
          lineStyle: {
            color: {
              type: "linear",
              x: 0,
              y: 0,
              x2: 0,
              y2: 1,
              colorStops: [
                {
                  offset: 0,
                  color: "rgba(0, 255, 233,0)",
                },
                {
                  offset: 0.5,
                  color: "rgba(255, 255, 255,1)",
                },
                {
                  offset: 1,
                  color: "rgba(0, 255, 233,0)",
                },
              ],
              global: false,
            },
          },
        },
      },
      grid: {
        top: "25%",
        left: "10%",
        right: "5%",
        bottom: "25%",
      },
      xAxis: {
        data: mess,
        axisTick: {
          show: false,//是否显示坐标轴刻度。
        },
        boundaryGap: false,//x轴留白,默认是true,这时候刻度只是作为分隔线,标签和数据点都会在两个刻度之间的带(band)中间
        axisLine: {
          show: true,
          lineStyle: {
            color: "#414965",
          },
        },
        axisLabel: {
          interval: 1,
          textStyle: {
            color: "#7089ba",
            fontSize: 12,
          },
          margin: 10, //刻度标签与轴线之间的距离。
        },
      },
      yAxis: {
        name:unit,
        nameTextStyle: {
          color: "#fff",
        },
        splitLine: { //是否显示分隔线
          show: true,
          lineStyle: {
            color: "#414965",
            opacity: 0.3,
          },
        },
        axisTick: {
          show: false,
        },
        axisLine: {
          show: false,
        },
        axisLabel: {
          textStyle: {
            color: "#7089ba",
            fontSize: 12,
          },
        },
        splitNumber: 3//坐标轴的分割段数
      },
      series: [
        {
          name: "今日",
          type: "line",
          smooth: true, //是否平滑
          showAllSymbol: false,//不显示折线图的拐点
          symbol: "circle",
          symbolSize: 2,
          lineStyle: {
            normal: {
              color: "#44b6fe",
            },
          },
          itemStyle: {
            color: "#44b6fe",
          },
          tooltip: {
            show: true,
          },
          areaStyle: {
            normal: {
              color: new echarts.graphic.LinearGradient(0, 0, 0, 1,
                [
                  {
                    offset: 0,
                    color: "rgba(53,194,246,0.7)",
                  },
                  {
                    offset: 1,
                    color: "rgba(53,194,246,0.1)",
                  },
                ],
                false
              ),
              shadowBlur: 20,
            },
          },
          data: mess4,
          markPoint: {
            symbolSize: 30,
            data: [
              { type: "max", name: "最大值" },
              { type: "min", name: "最小值" },
            ],
          },
        },
        {
          name: "昨日",
          type: "line",
          smooth: true, //是否平滑
          showAllSymbol: false,
          symbol: "circle",
          symbolSize: 2,
          lineStyle: {
            normal: {
              color: "#ad16ff",
            },
          },
          itemStyle: {
            color: "#ad16ff",
          },
          tooltip: {
            show: true,
          },
          areaStyle: {
            normal: {
              color: new echarts.graphic.LinearGradient(0, 0, 0, 1,
                [
                  {
                    offset: 0,
                    color: "rgba(179,64,242,0.7)",
                  },
                  {
                    offset: 1,
                    color: "rgba(179,64,242,0.1)",
                  },
                ],
                false
              ),
              shadowColor: "rgba(179,64,242, 0)",
              shadowBlur: 20,
            },
          },
          data: mess3,
          markPoint: {
            symbolSize: 30,
            data: [
              { type: "max", name: "最大值" },
              { type: "min", name: "最小值" },
            ],
          },
        },
      ],
    };
到此这篇关于基于Echart实现折线图的绘制详解的文章就介绍到这了,更多相关Echart折线图内容请搜索自由互联以前的文章或继续浏览下面的相关文章希望大家以后多多支持自由互联!