目录 前言 折线图 1.title 2.tooltip 3.grid 4.legend 5.xAxis 6.yAxis 7.series 附:常见问题 1、自定义X轴文字(文字替换) 2、自定义X轴文字(文字换行) 3、自定义tooltip 总结 前言 本文主要讲解使
目录
- 前言
- 折线图
- 1.title
- 2.tooltip
- 3.grid
- 4.legend
- 5.xAxis
- 6.yAxis
- 7.series
- 附:常见问题
- 1、自定义X轴文字(文字替换)
- 2、自定义X轴文字(文字换行)
- 3、自定义tooltip
- 总结
前言
本文主要讲解使用Echarts时setOption里面的属性以及常见的问题,参数都是本人项目里的具体参数。设置内容都是在 setOption({ })中。
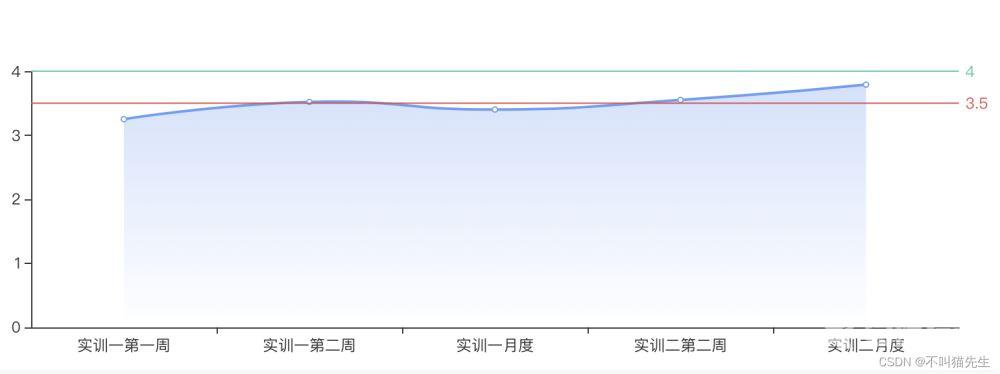
折线图
图示:
1.title
title:设置图标标题
- text:标题名称
- left:标题定位方向
- top、left:定位
- textStyle:标题样式
- color:标题颜色
   title: {
        text: '答辩评分趋势',
        left: 'left',
        top: 20,
        left: 20,
        textStyle: {
            color: '#679CF6'
             }
       }
2.tooltip
tooltip:提示框
- trigger:触发类型(axis:鼠标触摸到轴触发,item:鼠标触摸到折线点触发)
- showDelay:添加延迟时间,避免来回切换(单位ms)
- axisPointer:坐标轴指示器,坐标轴触发有效
- type:line/shadow(默认line,设置shadow时鼠标放上去有阴影)
- shadowStyle:当设置值为shadow时
   tooltip: {
             trigger: 'axis',
             // 显示延迟,添加显示延迟可以避免频繁切换,单位ms
             showDelay: 200,
             // 坐标轴指示器,坐标轴触发有效
             axisPointer: {
                  // 默认为直线,可选为:'line' | 'shadow'
                  type: 'show',
                  shadowStyle: {
                          shadowBlur: 1,
                          opacity: 0.3
                              }
                     },
           },
3.grid
grid:图表距离容器的位置
 grid: {
          left: '4%',
          right: '4%',
          bottom: '4%',
          top: '30%',
          containLabel: true
     },
- containLabel 为 false 的时候:
grid.left grid.right grid.top grid.bottom grid.width grid.height 决定的是由坐标轴形成的矩形的尺寸和位置。- containLabel 为 true 的时候:
grid.left grid.right grid.top grid.bottom grid.width grid.height 决定的是包括了坐标轴标签在内的所有内容所形成的矩形的位置。- 这常用于『防止标签溢出』的场景,标签溢出指的是,标签长度动态变化时,可能会溢出容器或者覆盖其他组件
4.legend
legend:图例
- data:图例的具体文字
- textStyle:图例的文字
- icon:图例的形状 (包括:circle,rect ,roundRect,triangle,diamond,pin,arrow,none)
  legend: {
         data: ['xx', 'xx', 'xx', 'xx'],
         right: '33%',
         top: '10%',
         textStyle: {
                 fontSize: 12,
                 color: '#666'
        },
           icon: "circle",
           itemWidth: 10,  // 设置宽度
           itemHeight: 10, // 设置高度
           itemGap: 40 // 设置间距
     },
5.xAxis
xAxis :x轴设置
- name:单位
- splitLine:网格线
- show:false (去除网格线)
- data:x轴坐标显示的数据,数组类型
- axisLine:设置x轴的轴线
- show:true(设置显示)
- lineStyle:设置轴线的样式
- color:颜色
- width:宽度
- type:线条类型
- axisLabel:设置x轴文字样式
- textStyle:文字样式,对象类型
- show:是否展示
- fontSize:字体大小
- color:文字颜色
- formatter:自定义文字,后面跟一个函数,默认会一个参数,x坐标的值
	xAxis: {
		type: "value",
			// x轴的名字,可以理解成单位
			name: "单位(K)",
				nameTextStyle: {
			// x轴的名字的样式相关
			color: "#BFBFBF",
				nameLocation: "start",
                    },
		splitLine: {
			//去除网格线
			show: false,
                    },
		//去除网格区域,否则会有一片区域
		splitArea: { show: false },
		data: [0, 5000, 10000, 15000, 20000, 25000, 30000, 35000],
			axisLine: {
			// 把x轴从实线变成虚线
			show: true,
				lineStyle: {
				// 设置x轴线条样式的颜色
				color: "#BDBDBD",
					width: 1,
						type: "solid",
                        },
		},
		axisLabel: {
			formatter: function (value) {
				return value >= 5000 ? parseInt(value / 1000) + "K" : value;
			},
			scale: true, // 设置数据自动缩放
        }
	},
6.yAxis
- yAxis:与x轴基本同理
7.series
series:图标系列,对象类型
- type:line(图标类型为线性图标)
- smooth:true(设置折线为光滑)
- name:图标名称
- areaStyle:图标区域的样式(本文中的图标设置的为渐进色)
- data:图标的数据
- markLine:基线
- symbol:none(去掉基线的箭头)
- lable:基线的文字设置
- position:基线文字位置(start,middle,end)
- show:是否显示基线文字
- formatter:基线文字内容
- data:设置基线(Array类型)
- silent:鼠标悬停(true/false)
- lineStyle:基线线条设置,对象类型
- type:solid(基线线条类型)
- color:基线线条颜色
- yAxis:y轴基线的值
 series: [
                    {
                        data: this.trendLineData.map(item => item.defenceScore),
                        type: 'line',
                        smooth: true,
                        name: "答辩评分",
                        areaStyle: {
                            normal: {
                                opacity: 0.3,
                                color: new this.$echarts.graphic.LinearGradient(0, 0, 0, 1, [{
                                    offset: 0,
                                    color: '#679CF6'
                                }, {
                                    offset: 1,
                                    color: '#fff'
                                }])
                            }
                        },
                        // 基线设置
                        markLine: {
                            symbol: "none",
                            data: [{
                                silent: false,
                                lineStyle: {
                                    type: "solid",
                                    color: "#E34949",
                                },
                                yAxis: 3.5
                            },
                            {
                                silent: false,
                                lineStyle: {
                                    type: "solid",
                                    color: "#3BC9A9",
                                },
                                yAxis: 4
                            }
                            ]
                        }
                    },
                ],
附:常见问题
1、自定义X轴文字(文字替换)
   axisLabel: {
        formatter: function (value) {
              return value >= 5000 ? parseInt(value / 1000) + "K" : value;
           },
     scale: true, // 设置数据自动缩放,要不然数据多的话就堆一块了
   }
2、自定义X轴文字(文字换行)
其中this.trendLineData为后端数据,其实就是将x轴的类目项文字可以动态换行
 		formatter: (value) => {
			if (this.trendLineData.length > 2) {
			    //拼接加\n返回的类目项
				var ret = "";
				//每项显示文字个数
				var maxLength = 12;
				//X轴类目项的文字个数
				var valLength = value.length;
				//类目项需要换行的行数
				var rowN = Math.ceil(valLength / maxLength);
				if (rowN > 1)
				{
					for (var i = 0; i < rowN; i++) {
					    //每次截取的字符串
						var temp = "";
						//开始截取的位置
						var start = i * maxLength;
						//结束截取的位置
						var end = start + maxLength;
						//这里也可以加一个是否是最后一行的判断
						temp = value.substring(start, end) + "\n";
						//拼接最终的字符串
						ret += temp;
					}
					return ret;
				}
				else {
					return value;
				}
			} else {
				return value;
			}
		}
3、自定义tooltip
	tooltip: {
		    trigger: 'axis',
		    // 显示延迟,添加显示延迟可以避免频繁切换,单位ms
			showDelay: 200,
			 // 坐标轴指示器,坐标轴触发有效
			axisPointer: {
			    // 默认为直线,可选为:'line' | 'shadow'
		     	type: 'shadow',
				shadowStyle: {
				shadowBlur: 1,
					opacity: 0.3
			    }
	     	},
		formatter: function (data) {
			var res = "<div style='display:flex;'>";
			res += "<div class='left' >"
			res += '答辩数' + '</br>'
			data.forEach(item => {
				item.value = item.value ? item.value : 0;
				if (item.seriesType == 'bar') {
					res += item.marker + item.seriesName + '答辩数' + ':' + item.value + '</br>';
				}
			});
			res += " </div>"
			res += "<div class='right' style='margin-left:20px'>"
			res += '分数' + '</br>'
			data.forEach(item => {
				item.value = item.value ? item.value : 0;
				if (item.seriesType == 'line') {
					res += item.marker + item.seriesName + (item.seriesName == '总体' ? '平均分' : '分数') + ':' + item.value + '</br>';
				}
			});
			res += " </div>"
			res += " </div>"
			return res
		}
	},
结果如图所示:

总结
到此这篇关于Echarts中常用的参数总结及参数自定义的文章就介绍到这了,更多相关Echarts常用参数及参数自定义内容请搜索自由互联以前的文章或继续浏览下面的相关文章希望大家以后多多支持自由互联!