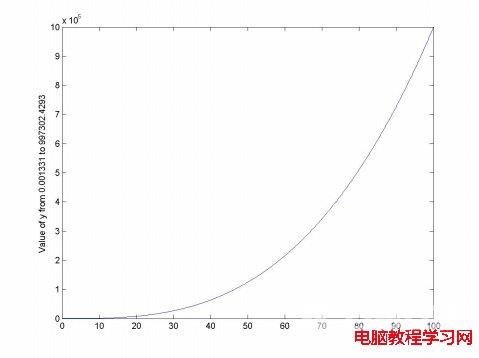
%使用函数num2str自动标注y轴x0.11:0.1:100;yx.^3;plot(x,y)str1num2str(min(y));str2num2str(max(y));out %使用函数num2str自动标注y轴 x0.11:0.1:100; yx.^3; plot(x,y) str1num2str(min(y)); str2num2str(max(y)); out[Value of y from s
%使用函数num2str自动标注y轴
x0.11:0.1:100;
yx.^3;
plot(x,y)
str1num2str(min(y));
str2num2str(max(y));
out[Value of y from str1 to str2];
ylabel(out);

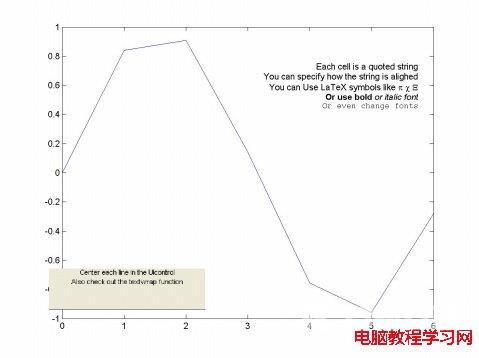
%用字符串结构数组进行标注
str1(1){Center each line in the Uicontrol};
str1(2){Also check out the textwrap function};
str2(1){Each cell is a quoted string};
str2(2){You can specify how the string is alighed};
str2(3){You can Use LaTeX symbols like \pi \chi \Xi};
str2(4){\bfOr use bold \rm\itor italic font\rm};
str2(5){\fontname{courier}Or even change fonts};
plot(0:6,sin(0:6))
uicontrol(Style,text,Position,[80 80 250 65],String,str1);
text(5.75,sin(2.5),str2,HorizontalAlignment,right)

