中秋节 ,又称祭月节、月光诞、月夕、秋节、仲秋节、拜月节、月娘节、月亮节、团圆节等,是中国民间的传统节日。自古便有祭月、赏月、吃月饼、玩花灯、赏桂花、饮桂花酒等民俗
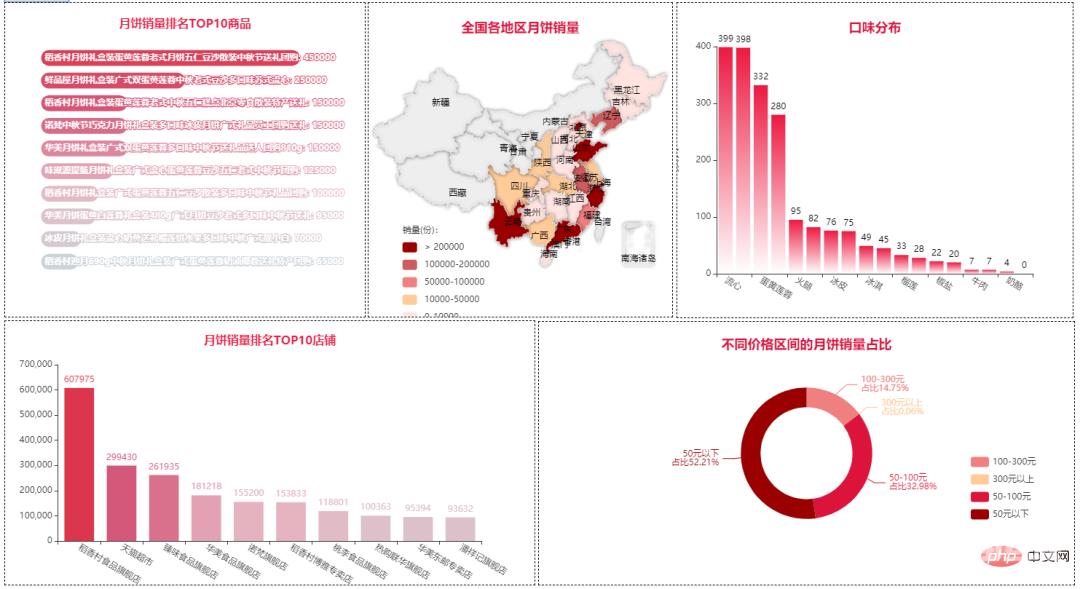
Pandas — 数据处理
Pyecharts — 数据可视化
jieba — 分词 collections — 数据统计
可视化部分:
Bar — 柱状图 Pie — 饼状图 Map— 地图 Stylecloud — 词云图
import re
import jieba
import stylecloud
import numpy as np
import pandas as pd
from collections import Counter
from pyecharts.charts import Bar
from pyecharts.charts import Map
from pyecharts.charts import Pie
from pyecharts.charts import Grid
from pyecharts.charts import Page
from pyecharts.components import Image
from pyecharts.charts import WordCloud
from pyecharts import options as opts
from pyecharts.globals import SymbolType
from pyecharts.commons.utils import JsCode
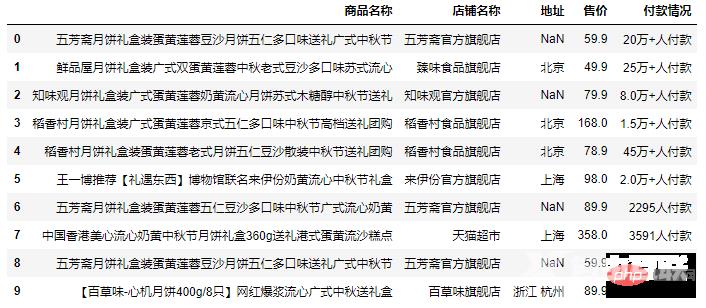
df = pd.read_excel("月饼.xlsx")
df.head(10)
结果:
print(df.shape)
df.drop_duplicates(inplace=True)
print(df.shape)
(4520, 5)
(1885, 5)
处理购买人数为空的记录:df['付款情况'] = df['付款情况'].replace(np.nan,'0人付款')
2.4 处理付款情况字段
df[df['付款情况'].str.contains("万")]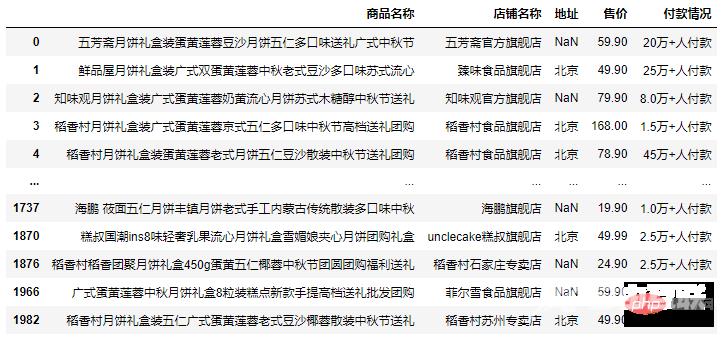
付款人数超过10000后会直接用"万"替代,这里我们需要将其恢复:
# 提取数值
df['num'] = [re.findall(r'(\d+\.{0,1}\d*)', i)[0] for i in df['付款情况']]
df['num'] = df['num'].astype('float')

# 提取单位(万)
df['unit'] = [''.join(re.findall(r'(万)', i)) for i in df['付款情况']]
df['unit'] = df['unit'].apply(lambda x:10000 if x=='万' else 1)

# 计算销量
df['销量'] = df['num'] * df['unit']
df = df[df['地址'].notna()]
df['省份'] = df['地址'].str.split(' ').apply(lambda x:x[0])

# 删除多余的列
df.drop(['付款情况', 'num', 'unit'], axis=1, inplace=True)

# 重置索引
df = df.reset_index(drop=True)
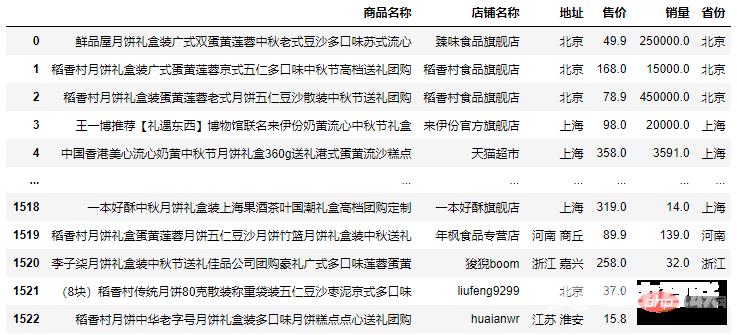
结果:
代码:
shop_top10 = df.groupby('商品名称')['销量'].sum().sort_values(ascending=False).head(10)
bar0 = (
    Bar()
        .add_xaxis(shop_top10.index.tolist()[::-1])
        .add_yaxis('sales_num', shop_top10.values.tolist()[::-1])
        .reversal_axis()
        .set_global_opts(title_opts=opts.TitleOpts(title='月饼商品销量Top10'),
                         xaxis_opts=opts.AxisOpts(axislabel_opts=opts.LabelOpts(rotate=-30)))
        .set_series_opts(label_opts=opts.LabelOpts(position='right'))
)
效果:
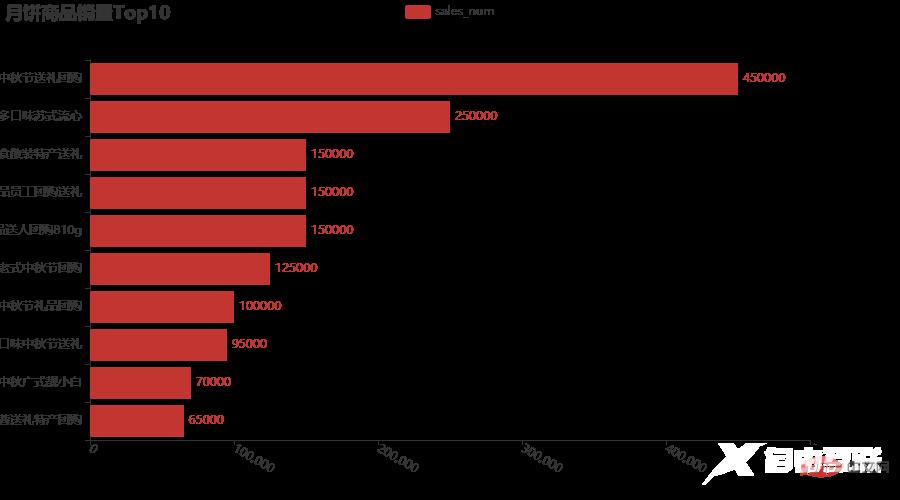
商品名称太长显示不全,我们调整一下边距:
bar1 = (
    Bar()
        .add_xaxis(shop_top10.index.tolist()[::-1])
        .add_yaxis('sales_num', shop_top10.values.tolist()[::-1],itemstyle_opts=opts.ItemStyleOpts(color=JsCode(color_js)))
        .reversal_axis()
        .set_global_opts(title_opts=opts.TitleOpts(title='月饼商品销量Top10'),
             xaxis_opts=opts.AxisOpts(axislabel_opts=opts.LabelOpts(rotate=-30)),
             )
        .set_series_opts(label_opts=opts.LabelOpts(position='right'))
)
# 将图形整体右移
grid = (
    Grid()
        .add(bar1, grid_opts=opts.GridOpts(pos_left='45%', pos_right='10%'))
)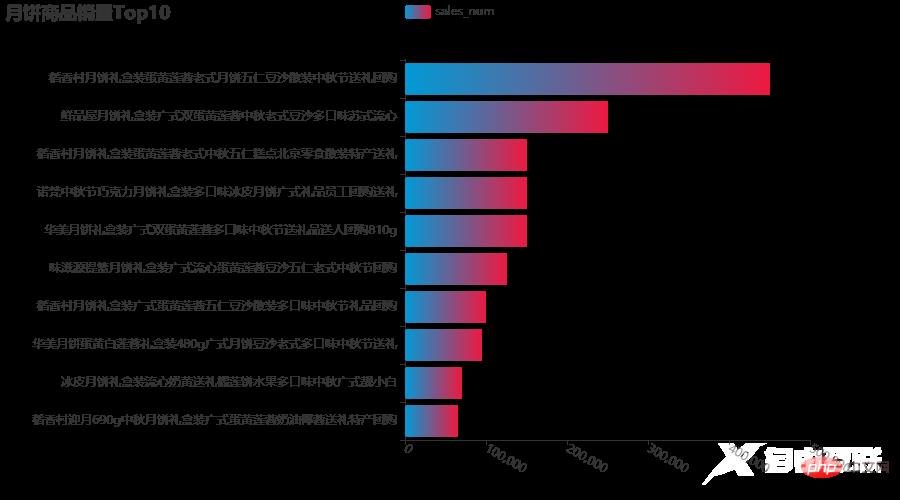
还可以来些其他(比如:形状)设置:

3.2 月饼销量排名TOP10店铺
代码:
shop_top10 = df.groupby('店铺名称')['销量'].sum().sort_values(ascending=False).head(10)
bar3 = (
    Bar(init_opts=opts.InitOpts(
        width='800px', height='600px',))
    .add_xaxis(shop_top10.index.tolist())
    .add_yaxis('', shop_top10.values.tolist(),
               category_gap='30%',
              )

    .set_global_opts(
        xaxis_opts=opts.AxisOpts(axislabel_opts=opts.LabelOpts(rotate=-30)),
        title_opts=opts.TitleOpts(
            title='月饼销量排名TOP10店铺',
            pos_left='center',
            pos_top='4%',
            title_textstyle_opts=opts.TextStyleOpts(
                color='#ed1941', font_size=16)
        ),
        visualmap_opts=opts.VisualMapOpts(
            is_show=False,
            max_=600000,
            range_color=["#CCD3D9", "#E6B6C2", "#D4587A","#FF69B4", "#DC364C"]
        ),
     )
)
bar3.render_notebook()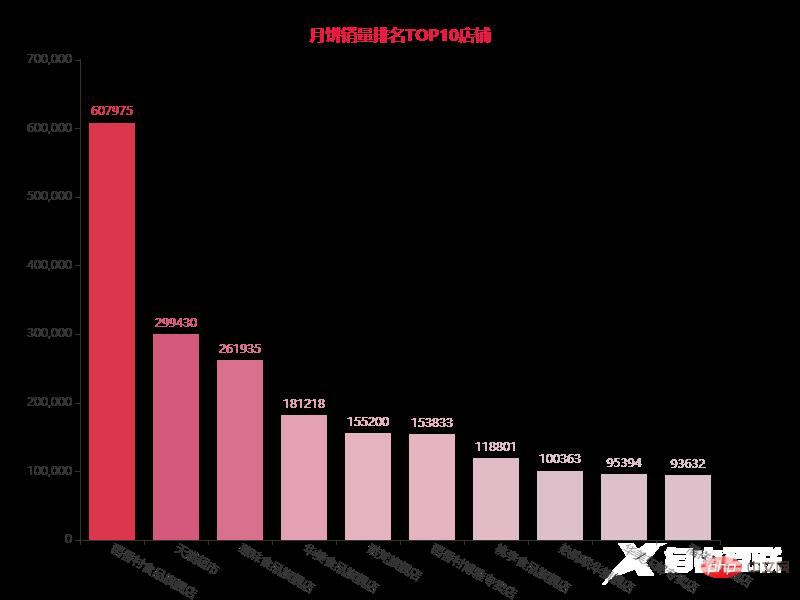
稻香村的月饼销量遥遥领先。
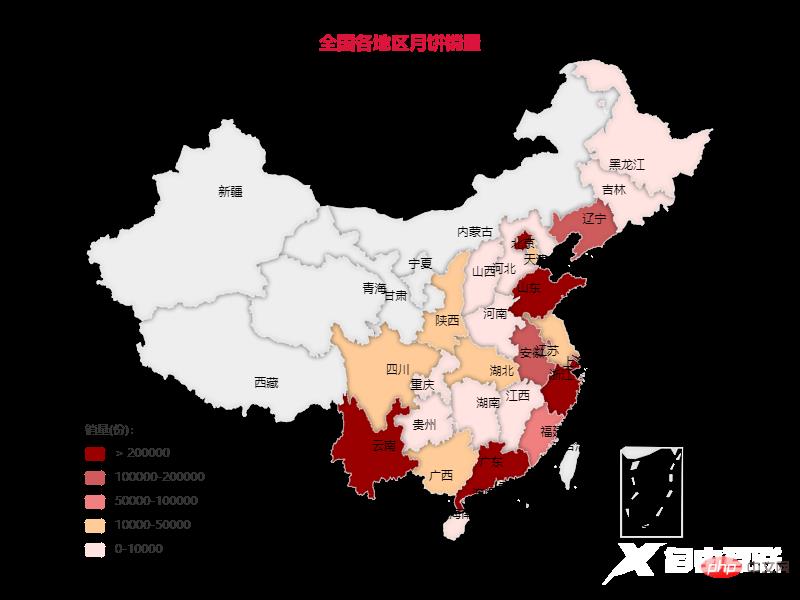
3.3 全国各地区月饼销量
province_num = df.groupby('省份')['销量'].sum().sort_values(ascending=False)
map_chart = Map(init_opts=opts.InitOpts(theme='light',
                                        width='800px',
                                        height='600px'))
map_chart.add('',
              [list(z) for z in zip(province_num.index.tolist(), province_num.values.tolist())],
              maptype='china',
              is_map_symbol_show=False,
              itemstyle_opts={
                  'normal': {
                      'shadowColor': 'rgba(0, 0, 0, .5)', # 阴影颜色
                      'shadowBlur': 5, # 阴影大小
                      'shadowOffsetY': 0, # Y轴方向阴影偏移
                      'shadowOffsetX': 0, # x轴方向阴影偏移
                      'borderColor': '#fff'
                  }
              }
              )
map_chart.set_global_opts(
    visualmap_opts=opts.VisualMapOpts(
        is_show=True,
        is_piecewise=True,
        min_ = 0,
        max_ = 1,
        split_number = 5,
        series_index=0,
        pos_top='70%',
        pos_left='10%',
        range_text=['销量(份):', ''],
        pieces=[
            {'max':2000000, 'min':200000, 'label':'> 200000', 'color': '#990000'},
            {'max':200000, 'min':100000, 'label':'100000-200000', 'color': '#CD5C5C'},
            {'max':100000, 'min':50000, 'label':'50000-100000', 'color': '#F08080'},
            {'max':50000, 'min':10000, 'label':'10000-50000', 'color': '#FFCC99'},
            {'max':10000, 'min':0, 'label':'0-10000', 'color': '#FFE4E1'},
           ],
    ),
    legend_opts=opts.LegendOpts(is_show=False),
    tooltip_opts=opts.TooltipOpts(
        is_show=True,
        trigger='item',
        formatter='{b}:{c}'
    ),
    title_opts=dict(
        text='全国各地区月饼销量',
        left='center',
        top='5%',
        textStyle=dict(
            color='#DC143C'))
)
map_chart.render_notebook()
结果:


【文章出处:香港cn2服务器 http://www.558idc.com/st.html 复制请保留原URL】
