Logstash 是一个功能强大的工具,可与各种部署集成。 它提供了大量插件,可帮助你解析,丰富,转换和缓冲来自各种来源的数据。 如果你的数据需要 Beats 中没有的其他处理,则需要将 Logstash 添加到部署中。配套有各种轻量级beats收集工具,比如Heartbeat能够通过ICMP、TCP和HTTP进行ping检测主机可用性。在第三方组件里面,Fluented最近比较火。Filebeat比较轻量,适合收集容器环境日志,具有各种插件。
本节教程主机集群环境配置信息:
              host                hostname
         192.168.31.101             es1
         192.168.31.102             es2
         192.168.31.103             es3
         192.168.31.104             web1
检查ubuntu虚拟机操作系统版本信息:
root@web1:/usr/local/src# uname -r
5.15.0-57-generic
修改ubuntu虚拟机名称为web1
root@web1:~# vim /etc/hostname
web1.example.com
root@web1:reboot
root@web1:~# cd /usr/local/src
logstash软件包需要从官网或者清华大学镜像站等权威网站下载,需要注意的是logstash自带jdk,我从虚拟机利用xftp工具上传并安装logstash安装包:
由于logstash需要使用普通用户身份启动,可能出现部分日志无法读取的情况,是因为日志缺少普通用户读取权限,logstash必须具备对系统全部日志的读取权限。
root@web1:~# dpkg -i logstash-8.5.1-amd64.deb                       #dpkg方式安装logstash组件
Selecting previously unselected package logstash.
(Reading database ... 202869 files and directories currently installed.)
Preparing to unpack logstash-8.5.1-amd64.deb ...
Unpacking logstash (1:8.5.1-1) ...
Setting up logstash (1:8.5.1-1) ...
查看logstash默认配置文件信息,可以发现User和Group默认都是logstash
root@web1:~# cat /lib/systemd/system/logstash.service|grep -E 'User|Group'   #查找配置文件默认用户和用户组信息
User=logstash
Group=logstash
由于Linux系统部分系统日志缺少“其他用户”权限,比如yum.log日志没有logstash用户权限,为了演示需要,将logstash组件启动默认用户和默认用户组改为root用户:
[root@web1 log]# ls -al /var/log/yum.log                 #yum.log文件没有logstash用户权限
-rw------- 1 root root 0 Jan  1 13:34 /var/log/yum.log
root@web1:~# vim /lib/systemd/system/logstash.service        #编辑logstash服务配置文件
[Unit]
Descriptinotallow=logstash

[Service]
Type=simple
User = root                                                    #修改默认用户为root
Group = root                                                   #修改默认用户组为root
# Load env vars from /etc/default/ and /etc/sysconfig/ if they exist.
# Prefixing the path with '-' makes it try to load, but if the file doesn't
# exist, it continues onward.
Envirnotallow=-/etc/default/logstash
Envirnotallow=-/etc/sysconfig/logstash
ExecStart=/usr/share/logstash/bin/logstash "--path.settings" "/etc/logstash"
Restart=always
WorkingDirectory=/
Nice=19
LimitNOFILE=16384

# When stopping, how long to wait before giving up and sending SIGKILL?
# Keep in mind that SIGKILL on a process can cause data loss.
TimeoutStopSec=infinity

[Install]
WantedBy=multi-user.target
配置文件修改完毕,首先做个测试,查看logstash服务功能运行是否正常:
root@web1:/etc/logstash/conf.d# vim stdin-stout-test.conf       #编辑配置文件
input {
  stdin {
     id => "my_plugin_id"
  }
}

output {
   stdout {
   }
}
root@web1:/etc/logstash/conf.d# /usr/share/logstash/bin/logstash -f stdin-stout-test.conf -t       #使用配置文件测试logstash
Using bundled JDK: /usr/share/logstash/jdk
WARNING: Could not find logstash.yml which is typically located in $LS_HOME/config or /etc/logstash. You can specify the path using --path.settings. Continuing using the defaults
Could not find log4j2 configuration at path /usr/share/logstash/config/log4j2.properties. Using default config which logs errors to the console
[WARN ] 2023-01-21 01:31:40.369 [main] runner - NOTICE: Running Logstash as superuser is not recommended and won't be allowed in the future. Set 'allow_superuser' to 'false' to avoid startup errors in future releases.
[INFO ] 2023-01-21 01:31:40.387 [main] runner - Starting Logstash {"logstash.version"=>"8.5.1", "jruby.version"=>"jruby 9.3.8.0 (2.6.8) 2022-09-13 98d69c9461 OpenJDK 64-Bit Server VM 17.0.5+8 on 17.0.5+8 +indy +jit [x86_64-linux]"}
[INFO ] 2023-01-21 01:31:40.390 [main] runner - JVM bootstrap flags: [-Xms1g, -Xmx1g, -Djava.awt.headless=true, -Dfile.encoding=UTF-8, -Djruby.compile.invokedynamic=true, -Djruby.jit.threshold=0, -XX:+HeapDumpOnOutOfMemoryError, -Djava.security.egd=file:/dev/urandom, -Dlog4j2.isThreadCnotallow=true, -Djruby.regexp.interruptible=true, -Djdk.io.File.enableADS=true, --add-exports=jdk.compiler/com.sun.tools.javac.api=ALL-UNNAMED, --add-exports=jdk.compiler/com.sun.tools.javac.file=ALL-UNNAMED, --add-exports=jdk.compiler/com.sun.tools.javac.parser=ALL-UNNAMED, --add-exports=jdk.compiler/com.sun.tools.javac.tree=ALL-UNNAMED, --add-exports=jdk.compiler/com.sun.tools.javac.util=ALL-UNNAMED, --add-opens=java.base/java.security=ALL-UNNAMED, --add-opens=java.base/java.io=ALL-UNNAMED, --add-opens=java.base/java.nio.channels=ALL-UNNAMED, --add-opens=java.base/sun.nio.ch=ALL-UNNAMED, --add-opens=java.management/sun.management=ALL-UNNAMED]
[WARN ] 2023-01-21 01:31:40.604 [LogStash::Runner] multilocal - Ignoring the 'pipelines.yml' file because modules or command line options are specified
[INFO ] 2023-01-21 01:31:40.642 [LogStash::Runner] configpathloader - No config files found in path {:path=>"/usr/share/logstash/stdin-stout-test.conf"}
[ERROR] 2023-01-21 01:31:40.655 [LogStash::Runner] sourceloader - No configuration found in the configured sources.
Configuration OK                                                                                     #测试验证通过
[INFO ] 2023-01-21 01:31:40.660 [LogStash::Runner] runner - Using config.test_and_exit mode. Config Validation Result: OK. Exiting Logstash
上述检查正常,直接启动logstash测试标准输入和输出,logstash启动以后输入“hello world”、“测试”等进行测试:
root@web1:/etc/logstash/conf.d# /usr/share/logstash/bin/logstash -e 'input { stdin{}} output { stdout{ codec => rubydebug }}'               #启动logstash服务测试标准输入和输出
Using bundled JDK: /usr/share/logstash/jdk
WARNING: Could not find logstash.yml which is typically located in $LS_HOME/config or /etc/logstash. You can specify the path using --path.settings. Continuing using the defaults
Could not find log4j2 configuration at path /usr/share/logstash/config/log4j2.properties. Using default config which logs errors to the console
[WARN ] 2023-01-21 01:39:28.834 [main] runner - NOTICE: Running Logstash as superuser is not recommended and won't be allowed in the future. Set 'allow_superuser' to 'false' to avoid startup errors in future releases.
[INFO ] 2023-01-21 01:39:28.864 [main] runner - Starting Logstash {"logstash.version"=>"8.5.1", "jruby.version"=>"jruby 9.3.8.0 (2.6.8) 2022-09-13 98d69c9461 OpenJDK 64-Bit Server VM 17.0.5+8 on 17.0.5+8 +indy +jit [x86_64-linux]"}
[INFO ] 2023-01-21 01:39:28.869 [main] runner - JVM bootstrap flags: [-Xms1g, -Xmx1g, -Djava.awt.headless=true, -Dfile.encoding=UTF-8, -Djruby.compile.invokedynamic=true, -Djruby.jit.threshold=0, -XX:+HeapDumpOnOutOfMemoryError, -Djava.security.egd=file:/dev/urandom, -Dlog4j2.isThreadCnotallow=true, -Djruby.regexp.interruptible=true, -Djdk.io.File.enableADS=true, --add-exports=jdk.compiler/com.sun.tools.javac.api=ALL-UNNAMED, --add-exports=jdk.compiler/com.sun.tools.javac.file=ALL-UNNAMED, --add-exports=jdk.compiler/com.sun.tools.javac.parser=ALL-UNNAMED, --add-exports=jdk.compiler/com.sun.tools.javac.tree=ALL-UNNAMED, --add-exports=jdk.compiler/com.sun.tools.javac.util=ALL-UNNAMED, --add-opens=java.base/java.security=ALL-UNNAMED, --add-opens=java.base/java.io=ALL-UNNAMED, --add-opens=java.base/java.nio.channels=ALL-UNNAMED, --add-opens=java.base/sun.nio.ch=ALL-UNNAMED, --add-opens=java.management/sun.management=ALL-UNNAMED]
[WARN ] 2023-01-21 01:39:29.308 [LogStash::Runner] multilocal - Ignoring the 'pipelines.yml' file because modules or command line options are specified
[INFO ] 2023-01-21 01:39:32.257 [Api Webserver] agent - Successfully started Logstash API endpoint {:port=>9600, :ssl_enabled=>false}
[INFO ] 2023-01-21 01:39:32.692 [Converge PipelineAction::Create<main>] Reflections - Reflections took 130 ms to scan 1 urls, producing 125 keys and 438 values
[INFO ] 2023-01-21 01:39:33.319 [Converge PipelineAction::Create<main>] javapipeline - Pipeline `main` is configured with `pipeline.ecs_compatibility: v8` setting. All plugins in this pipeline will default to `ecs_compatibility => v8` unless explicitly configured otherwise.
[INFO ] 2023-01-21 01:39:33.494 [[main]-pipeline-manager] javapipeline - Starting pipeline {:pipeline_id=>"main", "pipeline.workers"=>4, "pipeline.batch.size"=>125, "pipeline.batch.delay"=>50, "pipeline.max_inflight"=>500, "pipeline.sources"=>["config string"], :thread=>"#<Thread:0x6605571e run>"}
[INFO ] 2023-01-21 01:39:34.521 [[main]-pipeline-manager] javapipeline - Pipeline Java execution initialization time {"seconds"=>1.02}
[INFO ] 2023-01-21 01:39:34.625 [[main]-pipeline-manager] javapipeline - Pipeline started {"pipeline.id"=>"main"}
The stdin plugin is now waiting for input:
[INFO ] 2023-01-21 01:39:34.718 [Agent thread] agent - Pipelines running {:count=>1, :running_pipelines=>[:main], :non_running_pipelines=>[]}   #logstash已经启动,等待输入
hello world                                                #输入hello world进行验证测试
{
       "message" => "hello world",
         "event" => {
        "original" => "hello world"
    },
      "@version" => "1",
    "@timestamp" => 2023-01-20T17:40:10.660787606Z,
          "host" => {
        "hostname" => "web1.example.com"
    }
}
测试                                                       #输入中文“测试”进行验证测试
{
       "message" => "测试",
         "event" => {
        "original" => "测试"
    },
      "@version" => "1",
    "@timestamp" => 2023-01-20T17:52:20.842602243Z,
          "host" => {
        "hostname" => "web1.example.com"
    }
}
重新编写配置文件log-file.conf,使用这个配置文件启动logstash服务,输入test1~test6进行测试:
root@web1:/etc/logstash/conf.d# vim log-file.conf
input {
 stdin {}
}

output {
  file {
    path => "/tmp/logstash-test.log"                        #在web1节点本地生成一份日志文件
  }
  elasticsearch {
  hosts => ["192.168.31.101:9200"]
  index => "my-logstash-test-%{+yyyy.MM.dd}"                #
  user => "manager"
  password => "123456"
  }
}
root@web1:/etc/logstash/conf.d# /usr/share/logstash/bin/logstash -f /etc/logstash/conf.d/log-file.conf
Using bundled JDK: /usr/share/logstash/jdk
WARNING: Could not find logstash.yml which is typically located in $LS_HOME/config or /etc/logstash. You can specify the path using --path.settings. Continuing using the defaults
Could not find log4j2 configuration at path /usr/share/logstash/config/log4j2.properties. Using default config which logs errors to the console
[WARN ] 2023-01-21 02:21:47.420 [main] runner - NOTICE: Running Logstash as superuser is not recommended and won't be allowed in the future. Set 'allow_superuser' to 'false' to avoid startup errors in future releases.
[INFO ] 2023-01-21 02:21:47.435 [main] runner - Starting Logstash {"logstash.version"=>"8.5.1", "jruby.version"=>"jruby 9.3.8.0 (2.6.8) 2022-09-13 98d69c9461 OpenJDK 64-Bit Server VM 17.0.5+8 on 17.0.5+8 +indy +jit [x86_64-linux]"}
[INFO ] 2023-01-21 02:21:47.437 [main] runner - JVM bootstrap flags: [-Xms1g, -Xmx1g, -Djava.awt.headless=true, -Dfile.encoding=UTF-8, -Djruby.compile.invokedynamic=true, -Djruby.jit.threshold=0, -XX:+HeapDumpOnOutOfMemoryError, -Djava.security.egd=file:/dev/urandom, -Dlog4j2.isThreadCnotallow=true, -Djruby.regexp.interruptible=true, -Djdk.io.File.enableADS=true, --add-exports=jdk.compiler/com.sun.tools.javac.api=ALL-UNNAMED, --add-exports=jdk.compiler/com.sun.tools.javac.file=ALL-UNNAMED, --add-exports=jdk.compiler/com.sun.tools.javac.parser=ALL-UNNAMED, --add-exports=jdk.compiler/com.sun.tools.javac.tree=ALL-UNNAMED, --add-exports=jdk.compiler/com.sun.tools.javac.util=ALL-UNNAMED, --add-opens=java.base/java.security=ALL-UNNAMED, --add-opens=java.base/java.io=ALL-UNNAMED, --add-opens=java.base/java.nio.channels=ALL-UNNAMED, --add-opens=java.base/sun.nio.ch=ALL-UNNAMED, --add-opens=java.management/sun.management=ALL-UNNAMED]
[WARN ] 2023-01-21 02:21:47.690 [LogStash::Runner] multilocal - Ignoring the 'pipelines.yml' file because modules or command line options are specified
[INFO ] 2023-01-21 02:21:49.086 [Api Webserver] agent - Successfully started Logstash API endpoint {:port=>9600, :ssl_enabled=>false}
[INFO ] 2023-01-21 02:21:49.583 [Converge PipelineAction::Create<main>] Reflections - Reflections took 100 ms to scan 1 urls, producing 125 keys and 438 values
[INFO ] 2023-01-21 02:21:49.935 [Converge PipelineAction::Create<main>] jsonlines - ECS compatibility is enabled but `target` option was not specified. This may cause fields to be set at the top-level of the event where they are likely to clash with the Elastic Common Schema. It is recommended to set the `target` option to avoid potential schema conflicts (if your data is ECS compliant or non-conflicting, feel free to ignore this message)
[INFO ] 2023-01-21 02:21:50.090 [Converge PipelineAction::Create<main>] javapipeline - Pipeline `main` is configured with `pipeline.ecs_compatibility: v8` setting. All plugins in this pipeline will default to `ecs_compatibility => v8` unless explicitly configured otherwise.
[INFO ] 2023-01-21 02:21:50.136 [[main]-pipeline-manager] elasticsearch - New Elasticsearch output {:class=>"LogStash::Outputs::ElasticSearch", :hosts=>["//192.168.31.101:9200"]}
[INFO ] 2023-01-21 02:21:50.549 [[main]-pipeline-manager] elasticsearch - Elasticsearch pool URLs updated {:changes=>{:removed=>[], :added=>[http://manager:xxxxxx@192.168.31.101:9200/]}}
[WARN ] 2023-01-21 02:21:50.925 [[main]-pipeline-manager] elasticsearch - Restored connection to ES instance {:url=>"http://manager:xxxxxx@192.168.31.101:9200/"}
[INFO ] 2023-01-21 02:21:50.963 [[main]-pipeline-manager] elasticsearch - Elasticsearch version determined (8.5.1) {:es_versinotallow=>8}
[WARN ] 2023-01-21 02:21:50.967 [[main]-pipeline-manager] elasticsearch - Detected a 6.x and above cluster: the `type` event field won't be used to determine the document _type {:es_versinotallow=>8}
[INFO ] 2023-01-21 02:21:51.054 [Ruby-0-Thread-10: :1] elasticsearch - Config is not compliant with data streams. `data_stream => auto` resolved to `false`
[INFO ] 2023-01-21 02:21:51.055 [[main]-pipeline-manager] elasticsearch - Config is not compliant with data streams. `data_stream => auto` resolved to `false`
[WARN ] 2023-01-21 02:21:51.069 [[main]-pipeline-manager] elasticsearch - Elasticsearch Output configured with `ecs_compatibility => v8`, which resolved to an UNRELEASED preview of version 8.0.0 of the Elastic Common Schema. Once ECS v8 and an updated release of this plugin are publicly available, you will need to update this plugin to resolve this warning.
[INFO ] 2023-01-21 02:21:51.114 [Ruby-0-Thread-10: :1] elasticsearch - Using a default mapping template {:es_versinotallow=>8, :ecs_compatibility=>:v8}
[INFO ] 2023-01-21 02:21:51.271 [[main]-pipeline-manager] javapipeline - Starting pipeline {:pipeline_id=>"main", "pipeline.workers"=>4, "pipeline.batch.size"=>125, "pipeline.batch.delay"=>50, "pipeline.max_inflight"=>500, "pipeline.sources"=>["/etc/logstash/conf.d/log-file.conf"], :thread=>"#<Thread:0x74d743a6 run>"}
[INFO ] 2023-01-21 02:21:52.045 [[main]-pipeline-manager] javapipeline - Pipeline Java execution initialization time {"seconds"=>0.74}
[INFO ] 2023-01-21 02:21:52.165 [[main]-pipeline-manager] javapipeline - Pipeline started {"pipeline.id"=>"main"}
The stdin plugin is now waiting for input:
[INFO ] 2023-01-21 02:21:52.289 [Agent thread] agent - Pipelines running {:count=>1, :running_pipelines=>[:main], :non_running_pipelines=>[]}
test1                                                        #连续输入测试文字test1~test6
test2
test3
test4
test5
test6
检查本地生成的日志文件内容:
root@web1:/tmp# cat logstash-test.log
{"@version":"1","message":"test1","@timestamp":"2023-01-20T18:15:18.883155603Z","host":{"hostname":"web1.example.com"},"event":{"original":"test1"}}
{"@version":"1","message":"test2","@timestamp":"2023-01-20T18:15:23.922463313Z","host":{"hostname":"web1.example.com"},"event":{"original":"test2"}}
{"@version":"1","message":"\u001B[C\u001B[C\u001B[C\u001B[C\u001B[C\u001B[C\u001B[C\u001B[C\u001B[C\u001B[C\u001B[C\u001B[C\u001B[C\u001B[C\u001B[C\u001B[C","event":{"original":"\u001B[C\u001B[C\u001B[C\u001B[C\u001B[C\u001B[C\u001B[C\u001B[C\u001B[C\u001B[C\u001B[C\u001B[C\u001B[C\u001B[C\u001B[C\u001B[C"},"host":{"hostname":"web1.example.com"},"@timestamp":"2023-01-20T18:23:46.029842313Z"}
{"@timestamp":"2023-01-20T18:25:02.366072953Z","message":"test1","@version":"1","event":{"original":"test1"},"host":{"hostname":"web1.example.com"}}
{"@timestamp":"2023-01-20T18:25:04.047475255Z","message":"test2","@version":"1","event":{"original":"test2"},"host":{"hostname":"web1.example.com"}}
{"@timestamp":"2023-01-20T18:25:09.768181159Z","message":"test3","@version":"1","event":{"original":"test3"},"host":{"hostname":"web1.example.com"}}
{"@timestamp":"2023-01-20T18:28:09.362465258Z","message":"test4","@version":"1","event":{"original":"test4"},"host":{"hostname":"web1.example.com"}}
{"@timestamp":"2023-01-20T18:28:11.390570004Z","message":"test5","@version":"1","event":{"original":"test5"},"host":{"hostname":"web1.example.com"}}
{"@timestamp":"2023-01-20T18:28:15.213781835Z","message":"test6","@version":"1","event":{"original":"test6"},"host":{"hostname":"web1.example.com"}}
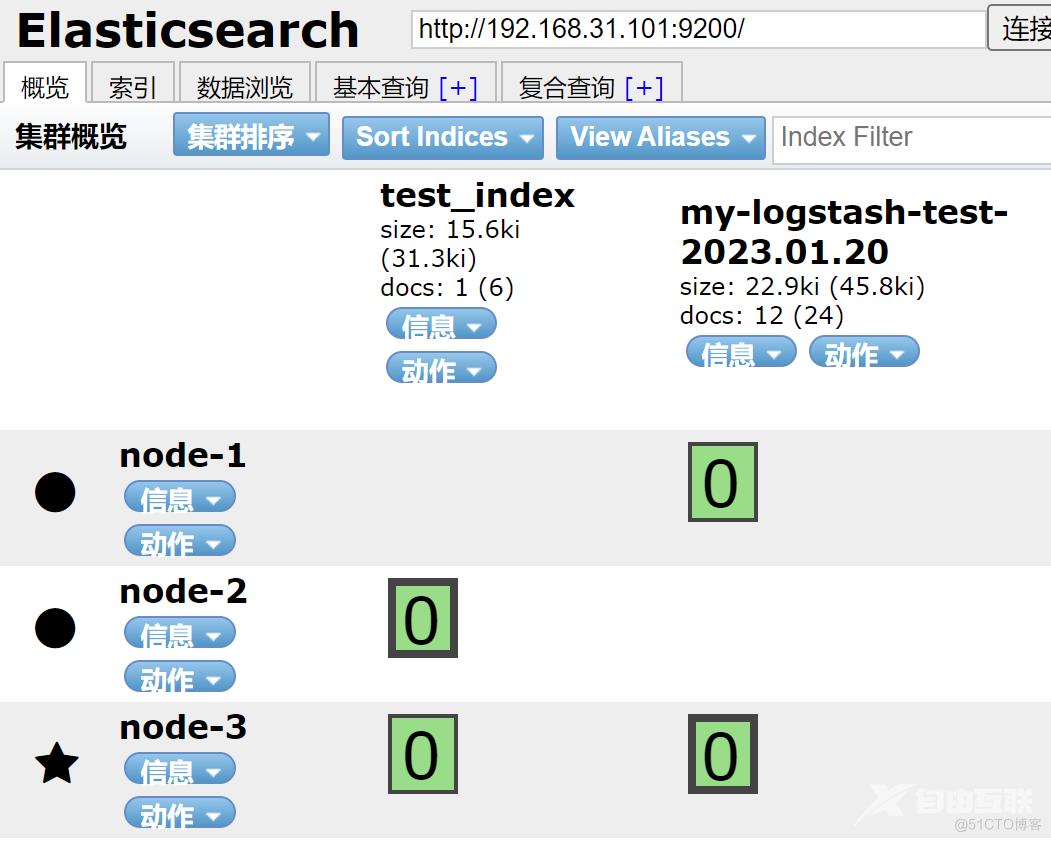
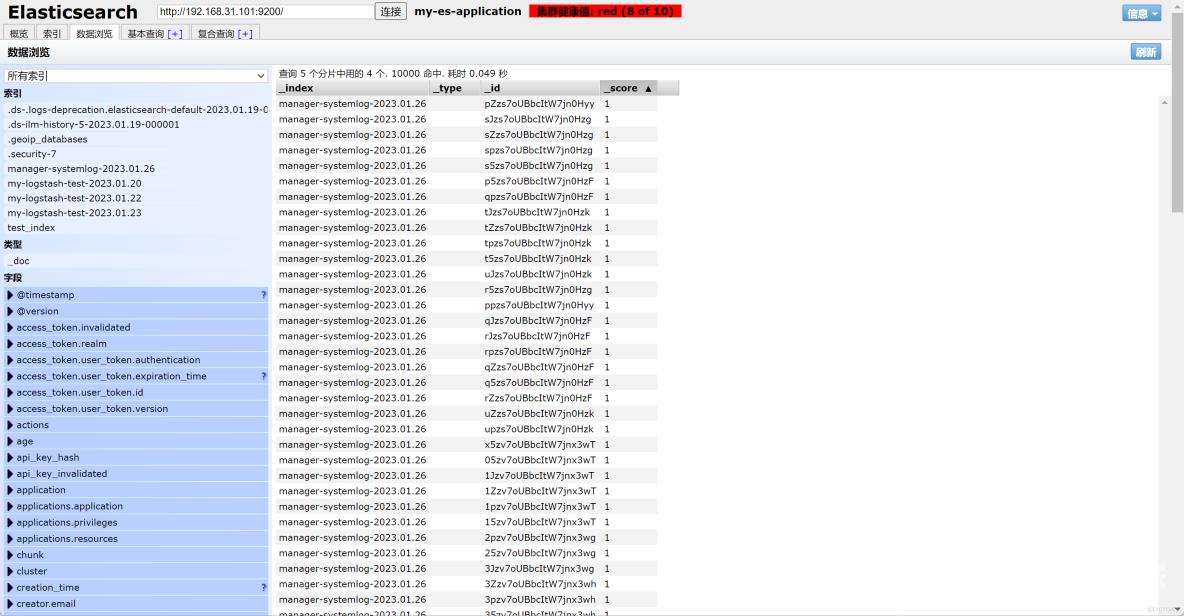
通过应用elasticsearch-head插件,检查es1节点(192.168.31.101)生成的索引数据:
需要注意,为了避免不必要的报错 ,elasticsearch、logstash、kibana三个组件版本务必保持一致,此处都是8.5.1版本。为了检验效果,需要做个测试,新建配置文件syslog-to-es.conf,内容如下所示:
root@web1:/etc/logstash/conf.d# vim syslog-to-es.conf
input{
 file{
 path => "/var/log/syslog"
 type => "systemlog"                                      #日志类型
 start_position => "beginning"                            #开始位置
 stat_interval => "10"                                    #采样间隔,此处每10秒采集一次
 }
}
output{
 if[type]=="systemlog"{                                  #首先判断是否systemlog类型
  elasticsearch{
  hosts =>["192.168.31.101:9200"]                        #es1服务器地址
  index =>"manager-systemlog-%{+YYYY.MM.dd}"             #索引文件名称
  password =>"123456
  user => "manager"
}}
}
root@web1:/etc/logstash/conf.d# /usr/share/logstash/bin/logstash -f /etc/logstash/conf.d/syslog-to-es.conf -t
root@web1:/etc/logstash/conf.d# systemctl start logstash && systemctl enable logstash
Created symlink /etc/systemd/system/multi-user.target.wants/logstash.service → /lib/systemd/system/logstash.service.
可以发现logstash服务启动以后,已经生成索引文件
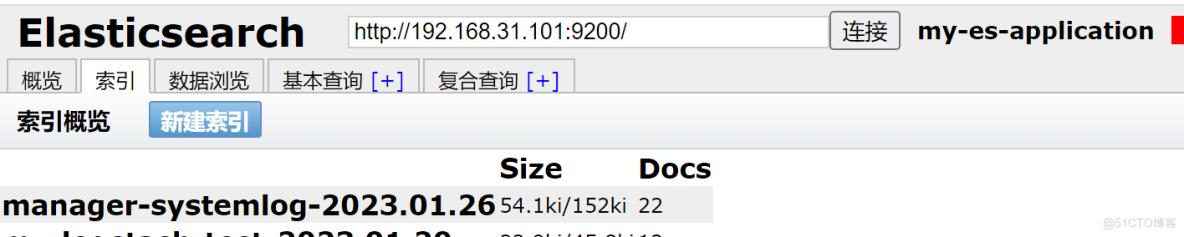
登录elasticsearch-head应用插件,验证测试数据:
索引数据写好以后,需要安装kibana进行数据展示,在es1服务器上安装kibana组件:
root@es1:/usr/local/src# dpkg -i kibana-8.5.1-amd64.deb                      #安装kibana
Selecting previously unselected package kibana.
(Reading database ... 202869 files and directories currently installed.)
Preparing to unpack kibana-8.5.1-amd64.deb ...
Unpacking kibana (8.5.1) ...
Setting up kibana (8.5.1) ...
Creating kibana group... OK
Creating kibana user... OK
Created Kibana keystore in /etc/kibana/kibana.keystore
kibana安装完毕,修改配置文件kibana.yml,内容如下所示:
root@es1:~# vim /etc/kibana/kibana.yml
server.port: 5601                                        #服务端口
server.host:"0.0.0.0"                                    #监听端口
elasticsearch.hosts: ["http://192.168.31.103:9200"]      #连接es3主机(也可以是es1、es2)
elasticsearch.username: "kibana_system"                  #用户名
elasticsearch.password: "123456"                         #密码
i18n.locale: "zh-CN"                                     #中文显示
通过配置文件,启动kibana服务
root@es1:~# systemctl restart kibana.service
root@es1:~# systemctl enable kibana.service
Created symlink /etc/systemd/system/multi-user.target.wants/kibana.service → /lib/systemd/system/kibana.service.
通过检查进程、端口、日志等,充分检查kibana服务是否启动成功:
root@es1:/usr/local/src# ps aux|grep kibana
kibana      2465 61.0 10.4 11712784 416128 ?     Ssl  21:13   0:14 /usr/share/kibana/bin/../node/bin/node /usr/share/kibana/bin/../src/cli/dist
root        2517  0.0  0.0   7004  2108 pts/0    S+   21:13   0:00 grep --color=auto kibana
root@es1:/usr/local/src# lsof -i:5601
COMMAND  PID   USER   FD   TYPE DEVICE SIZE/OFF NODE NAME
node    2465 kibana   19u  IPv4  52694      0t0  TCP localhost:5601 (LISTEN)
root@es1:/usr/local/src# tail -f /var/log/kibana/kibana.log
{"service":{"node":{"roles":["background_tasks","ui"]}},"ecs":{"version":"8.4.0"},"@timestamp":"2023-02-04T13:54:30.572+08:00","message":"Installed resources for index .alerts-observability.logs.alerts","log":{"level":"INFO","logger":"plugins.ruleRegistry"},"process":{"pid":6092},"trace":{"id":"56540346239a3e43f0f12a021f87893e"},"transaction":{"id":"1129e442811bd17e"}}
{"service":{"node":{"roles":["background_tasks","ui"]}},"ecs":{"version":"8.4.0"},"@timestamp":"2023-02-04T13:54:30.575+08:00","message":"Installed resources for index .alerts-security.alerts","log":{"level":"INFO","logger":"plugins.ruleRegistry"},"process":{"pid":6092},"trace":{"id":"56540346239a3e43f0f12a021f87893e"},"transaction":{"id":"1129e442811bd17e"}}
{"service":{"node":{"roles":["background_tasks","ui"]}},"ecs":{"version":"8.4.0"},"@timestamp":"2023-02-04T13:54:30.576+08:00","message":"Installed resources for index .alerts-observability.uptime.alerts","log":{"level":"INFO","logger":"plugins.ruleRegistry"},"process":{"pid":6092},"trace":{"id":"56540346239a3e43f0f12a021f87893e"},"transaction":{"id":"1129e442811bd17e"}}
{"service":{"node":{"roles":["background_tasks","ui"]}},"ecs":{"version":"8.4.0"},"@timestamp":"2023-02-04T13:54:30.586+08:00","message":"Installed resources for index .preview.alerts-security.alerts","log":{"level":"INFO","logger":"plugins.ruleRegistry"},"process":{"pid":6092},"trace":{"id":"56540346239a3e43f0f12a021f87893e"},"transaction":{"id":"1129e442811bd17e"}}
{"service":{"node":{"roles":["background_tasks","ui"]}},"ecs":{"version":"8.4.0"},"@timestamp":"2023-02-04T13:54:31.121+08:00","message":"Task ML:saved-objects-sync-task: scheduled with interval 1h","log":{"level":"INFO","logger":"plugins.ml"},"process":{"pid":6092},"trace":{"id":"ba2f2ded1a38f68c2fd099186bc198d3"},"transaction":{"id":"a8c073793c19b516"}}
{"service":{"node":{"roles":["background_tasks","ui"]}},"ecs":{"version":"8.4.0"},"@timestamp":"2023-02-04T13:54:31.172+08:00","message":"Fleet setup completed","log":{"level":"INFO","logger":"plugins.fleet"},"process":{"pid":6092},"trace":{"id":"ba2f2ded1a38f68c2fd099186bc198d3"},"transaction":{"id":"a8c073793c19b516"}}
{"service":{"node":{"roles":["background_tasks","ui"]}},"ecs":{"version":"8.4.0"},"@timestamp":"2023-02-04T13:54:31.189+08:00","message":"Dependent plugin setup complete - Starting ManifestTask","log":{"level":"INFO","logger":"plugins.securitySolution"},"process":{"pid":6092},"trace":{"id":"ba2f2ded1a38f68c2fd099186bc198d3"},"transaction":{"id":"a8c073793c19b516"}}
{"service":{"node":{"roles":["background_tasks","ui"]}},"ecs":{"version":"8.4.0"},"@timestamp":"2023-02-04T13:54:31.334+08:00","message":"Installed synthetics index templates","log":{"level":"INFO","logger":"plugins.synthetics"},"process":{"pid":6092},"trace":{"id":"ba2f2ded1a38f68c2fd099186bc198d3"},"transaction":{"id":"a8c073793c19b516"}}
{"service":{"node":{"roles":["background_tasks","ui"]}},"ecs":{"version":"8.4.0"},"@timestamp":"2023-02-04T13:54:33.547+08:00","message":"Kibana is now available (was degraded)","log":{"level":"INFO","logger":"status"},"process":{"pid":6092},"trace":{"id":"89e9e7e6ba74d0151da2927f6a105e76"},"transaction":{"id":"183ba31d542a5d85"}}
{"service":{"node":{"roles":["background_tasks","ui"]}},"ecs":{"version":"8.4.0"},"@timestamp":"2023-02-04T13:54:33.562+08:00","message":"Task ML:saved-objects-sync-task: No ML saved objects in need of synchronization","log":{"level":"INFO","logger":"plugins.ml"},"process":{"pid":6092},"trace":{"id":"ba2f2ded1a38f68c2fd099186bc198d3"},"transaction":{"id":"25dd78a98c71582d"}}
(省略部分输出,确保没有报错信息)
在360浏览器地址输入“192.168.31.101:5601”,首次访问启动界面如下所示:
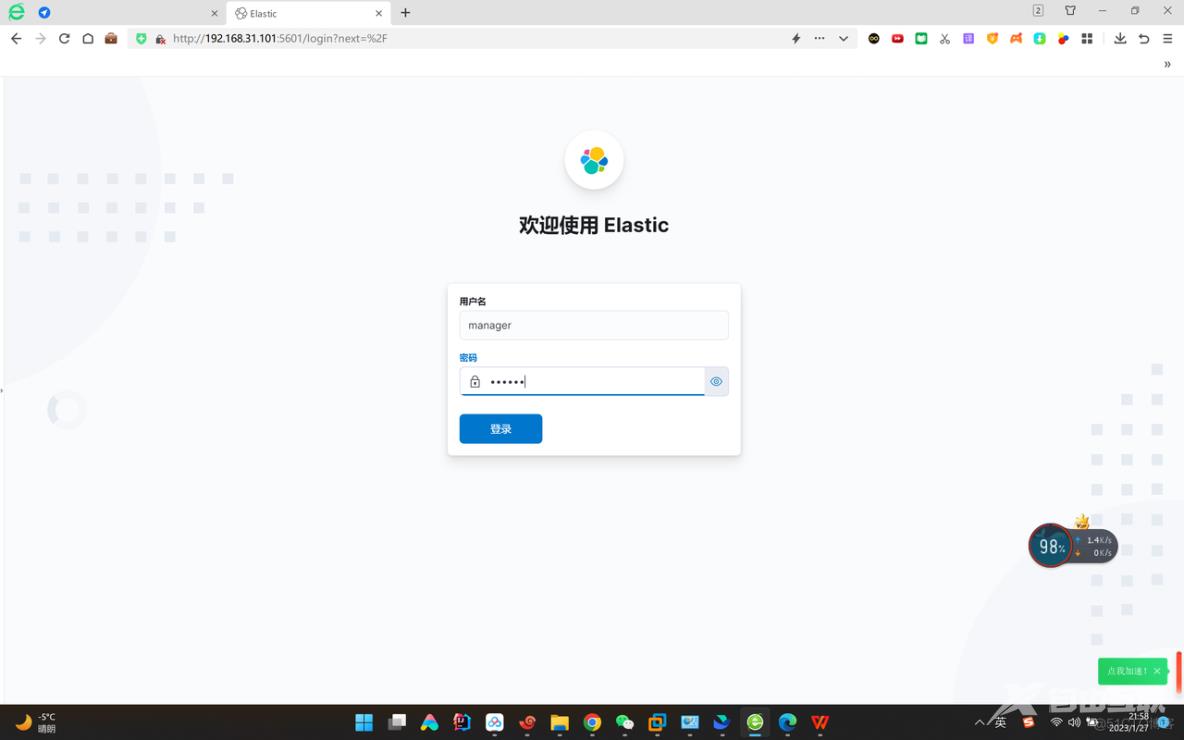
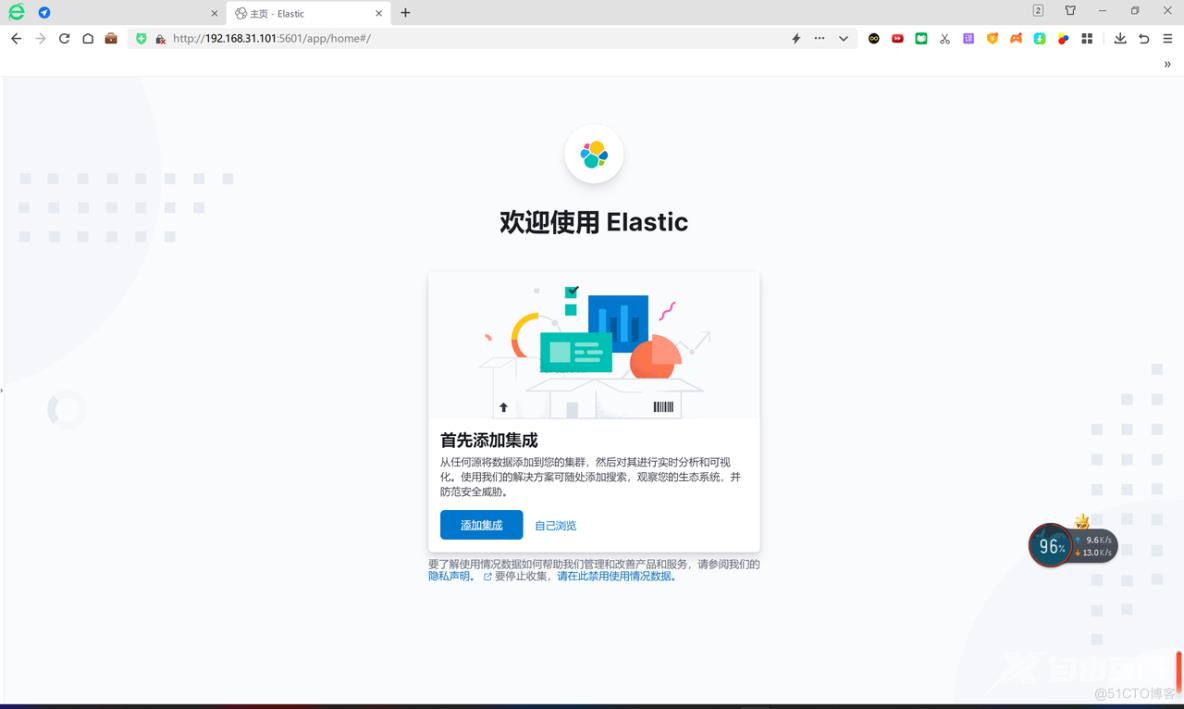
输入用户名manager,密码123456,首次登录Elasticsearch
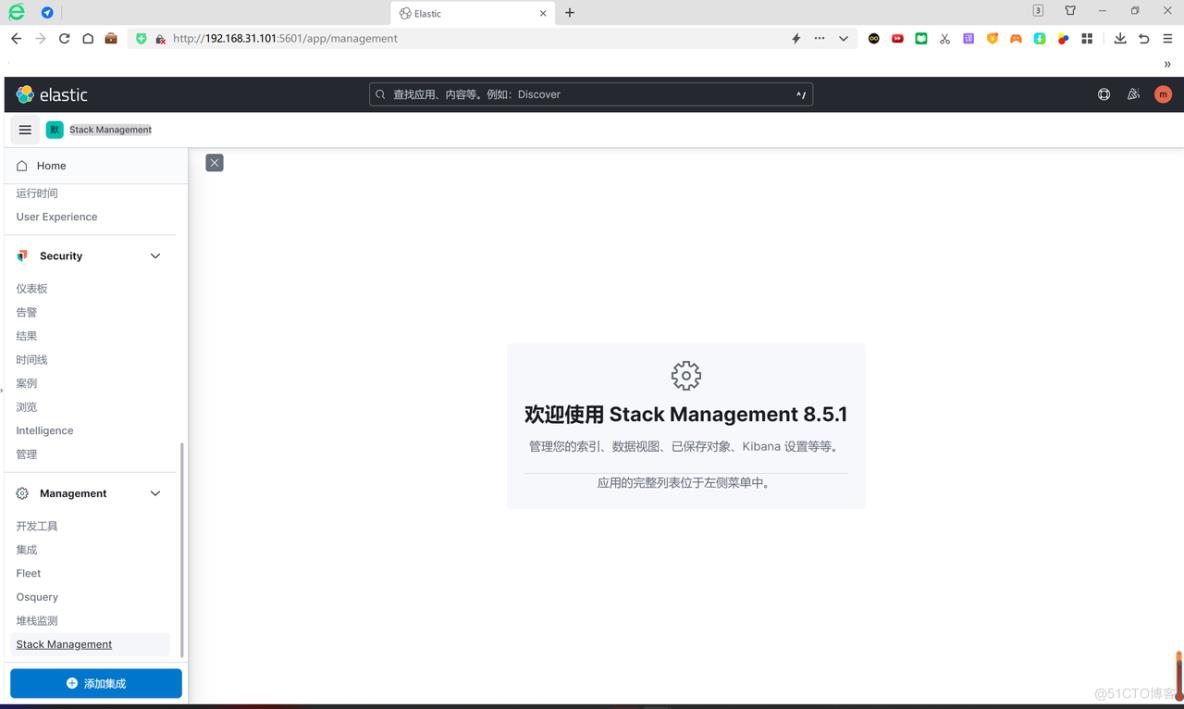
点击Management-stackmanager,创建数据视图:
创建数据视图,通过前期配置,Kibana能够自动访问es3节点内部索引数据
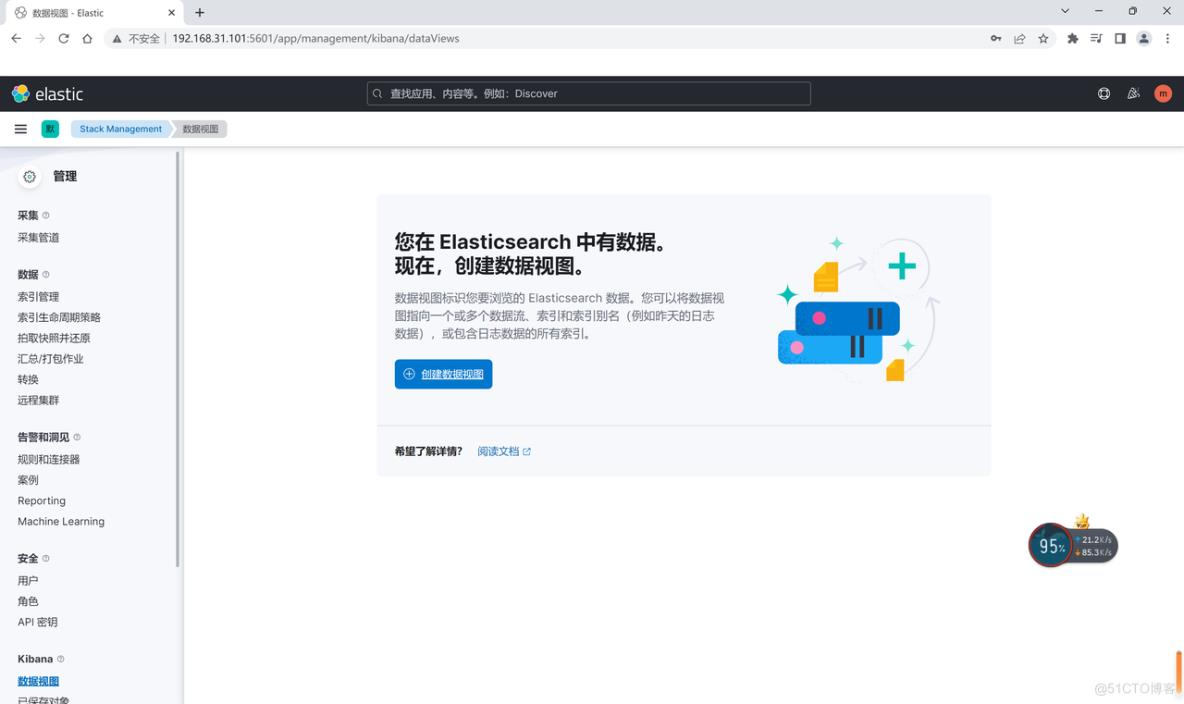
点击“创建数据视图”,如下所示:
按照命名习惯,数据视图名称填写“manager-systemlog”,索引模式即正则,填写“manager-systemlog-*”,代表找到所有以manager-systemlog开头的索引文件,时间戳字段选择默认“@timestamp”,系统自动匹配到2个源:manager-systemlog-2023.01.27、manager-systemlog-2023.01.28
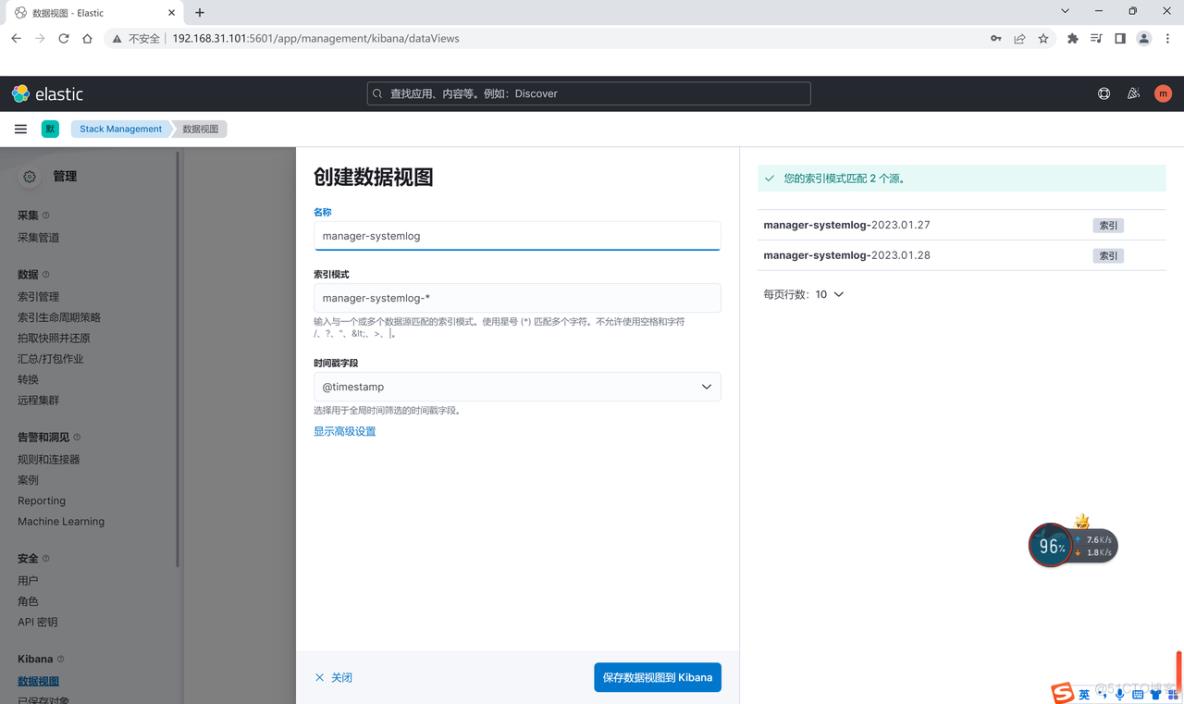
点击“保存数据视图到Kibanad”,生成名称为manager-systemlog的数据视图:
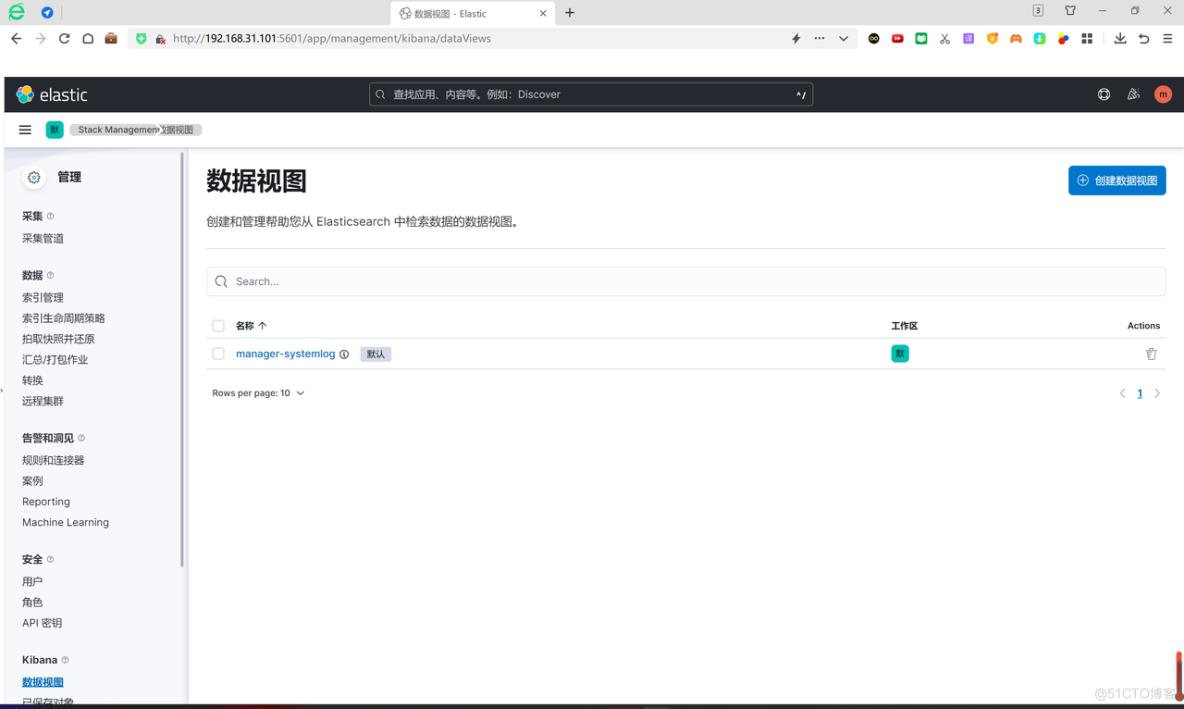
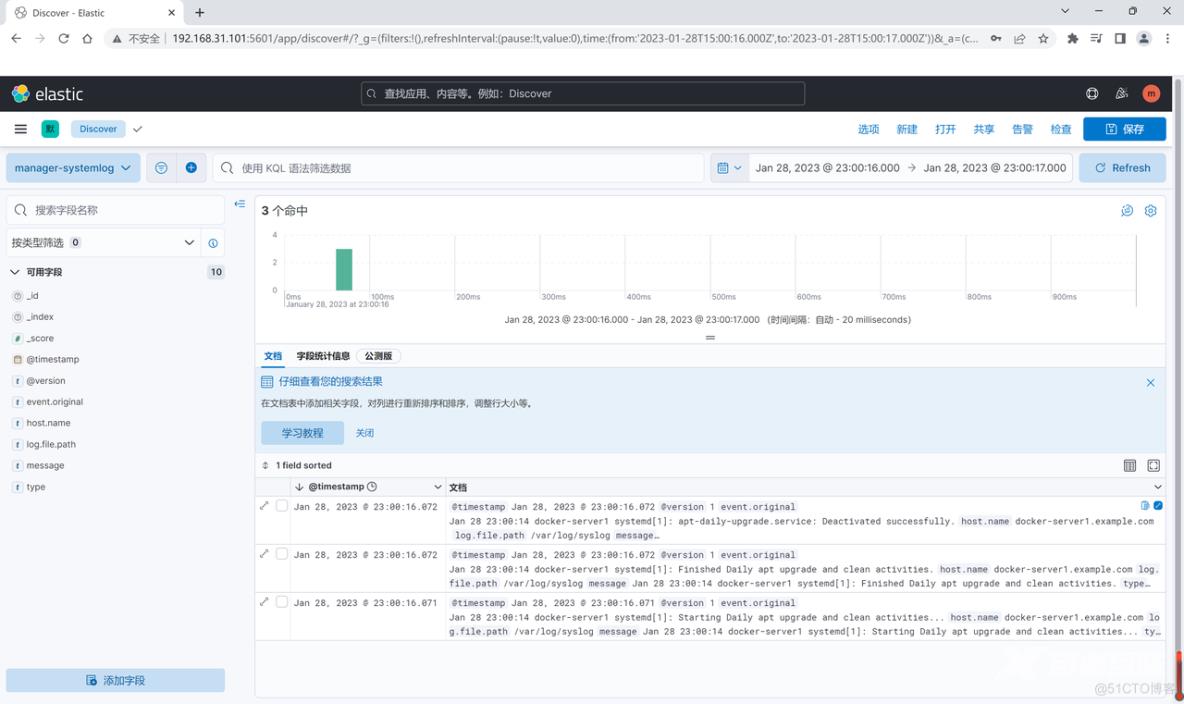
选择Analytics下面的Discover,可以看到数据视图manager-systemlog

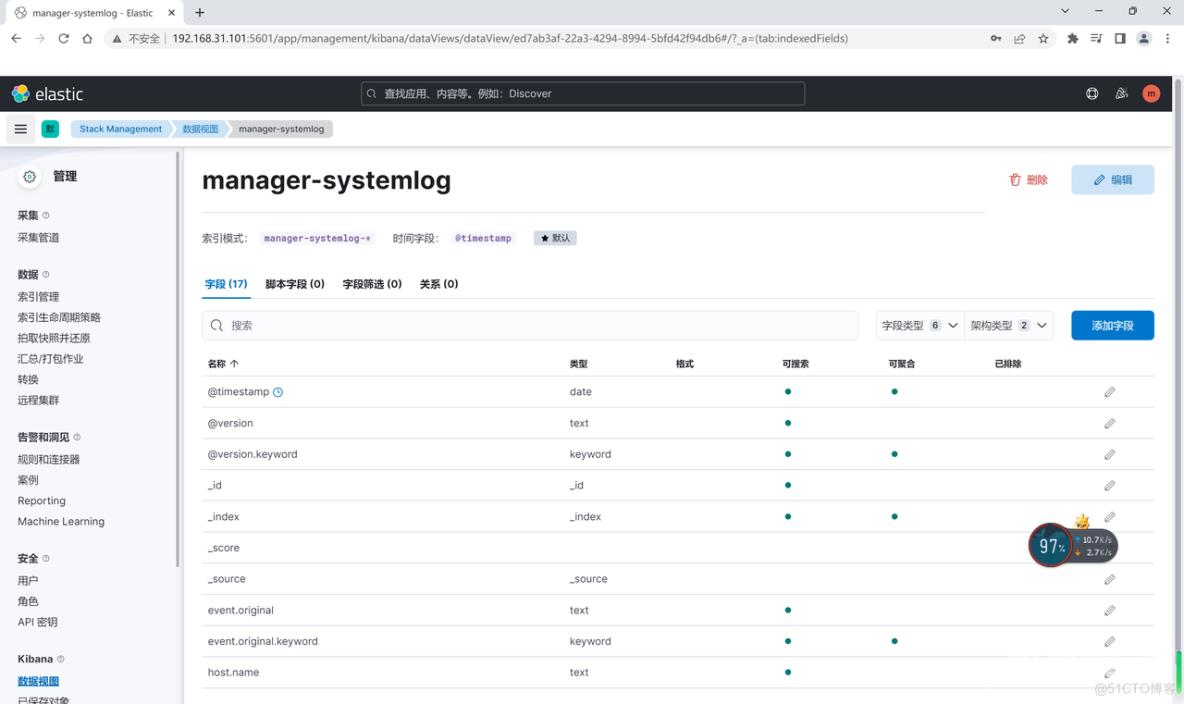
点击manager-systemlog,查看如下索引数据:
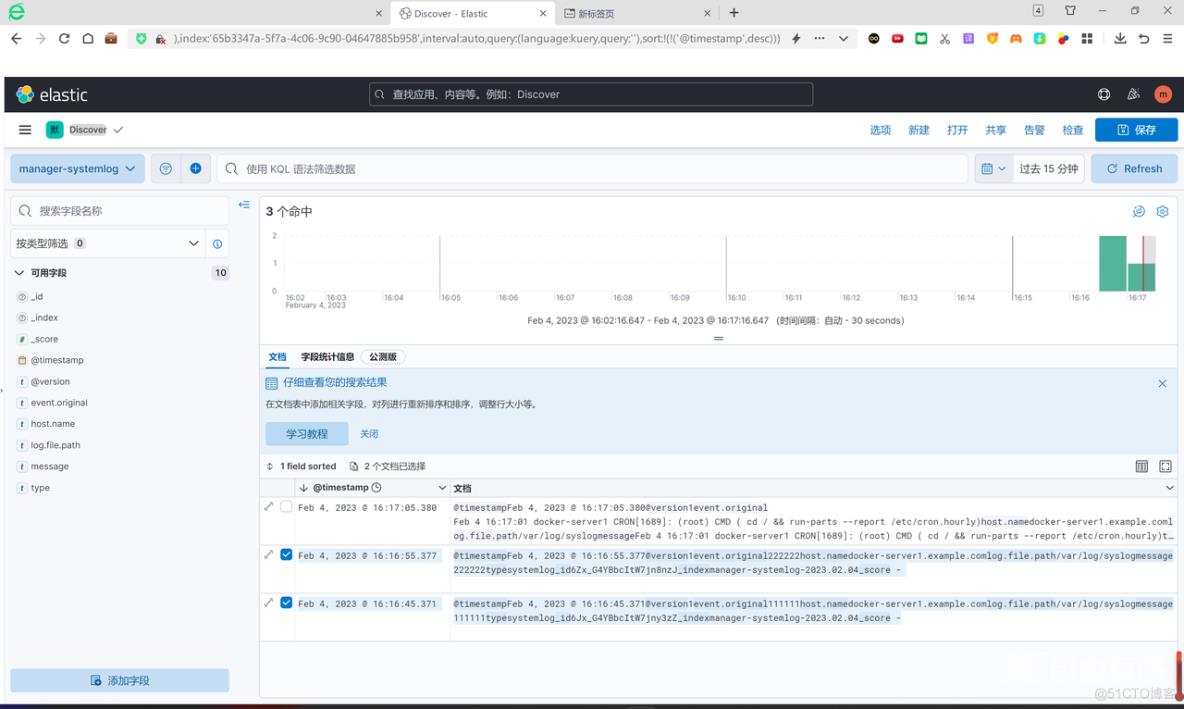
此处可以做个实验,在web1服务器上插入索引数据
root@web1:~# echo "111111" >> /var/log/syslog
root@web1:~# echo "222222" >> /var/log/syslog
切换kibana,可以看到上述两条索引数据已经在日志中生成,
演示收集多个不同类型日志,首先重新创建配置文件sys-to-es.conf
root@web1:/etc/logstash/conf.d# vim syslog-to-es.conf
input{
 file{
 path => "/var/log/syslog"
 type => "systemlog"
 start_position => "beginning"
 stat_interval => "10"
 }
 file{
 path => "/var/log/auth.log"
 type => "authlog"
 start_position => "beginning"
 stat_interval => "10"
 }
}
output{
 if[type]=="systemlog"{
  elasticsearch{
  hosts =>["192.168.31.101:9200"]
  index =>"manager-systemlog-%{+YYYY.MM.dd}"
  password =>"123456"
  user => "manager"
}}
if[type]=="authlog"{
  elasticsearch{
  hosts =>["192.168.31.101:9200"]
  index =>"manager-authlog-%{+YYYY.MM.dd}"
  password =>"123456"
  user =>"manager"
}}
检查配置文件,重启logstash服务
root@web1:/etc/logstash/conf.d# /usr/share/logstash/bin/logstash -f /etc/logstash/conf.d/syslog-to-es.conf -t                   #检查是否能够正常启动
Using bundled JDK: /usr/share/logstash/jdk
WARNING: Could not find logstash.yml which is typically located in $LS_HOME/config or /etc/logstash. You can specify the path using --path.settings. Continuing using the defaults
Could not find log4j2 configuration at path /usr/share/logstash/config/log4j2.properties. Using default config which logs errors to the console
[WARN ] 2023-01-29 06:58:49.898 [main] runner - NOTICE: Running Logstash as superuser is not recommended and won't be allowed in the future. Set 'allow_superuser' to 'false' to avoid startup errors in future releases.
[INFO ] 2023-01-29 06:58:49.926 [main] runner - Starting Logstash {"logstash.version"=>"8.5.1", "jruby.version"=>"jruby 9.3.8.0 (2.6.8) 2022-09-13 98d69c9461 OpenJDK 64-Bit Server VM 17.0.5+8 on 17.0.5+8 +indy +jit [x86_64-linux]"}
[INFO ] 2023-01-29 06:58:49.940 [main] runner - JVM bootstrap flags: [-Xms1g, -Xmx1g, -Djava.awt.headless=true, -Dfile.encoding=UTF-8, -Djruby.compile.invokedynamic=true, -Djruby.jit.threshold=0, -XX:+HeapDumpOnOutOfMemoryError, -Djava.security.egd=file:/dev/urandom, -Dlog4j2.isThreadCnotallow=true, -Djruby.regexp.interruptible=true, -Djdk.io.File.enableADS=true, --add-exports=jdk.compiler/com.sun.tools.javac.api=ALL-UNNAMED, --add-exports=jdk.compiler/com.sun.tools.javac.file=ALL-UNNAMED, --add-exports=jdk.compiler/com.sun.tools.javac.parser=ALL-UNNAMED, --add-exports=jdk.compiler/com.sun.tools.javac.tree=ALL-UNNAMED, --add-exports=jdk.compiler/com.sun.tools.javac.util=ALL-UNNAMED, --add-opens=java.base/java.security=ALL-UNNAMED, --add-opens=java.base/java.io=ALL-UNNAMED, --add-opens=java.base/java.nio.channels=ALL-UNNAMED, --add-opens=java.base/sun.nio.ch=ALL-UNNAMED, --add-opens=java.management/sun.management=ALL-UNNAMED]
[WARN ] 2023-01-29 06:58:50.185 [LogStash::Runner] multilocal - Ignoring the 'pipelines.yml' file because modules or command line options are specified
[INFO ] 2023-01-29 06:58:51.160 [LogStash::Runner] Reflections - Reflections took 96 ms to scan 1 urls, producing 125 keys and 438 values
[INFO ] 2023-01-29 06:58:51.729 [LogStash::Runner] javapipeline - Pipeline `main` is configured with `pipeline.ecs_compatibility: v8` setting. All plugins in this pipeline will default to `ecs_compatibility => v8` unless explicitly configured otherwise.
Configuration OK
[INFO ] 2023-01-29 06:58:51.733 [LogStash::Runner] runner - Using config.test_and_exit mode. Config Validation Result: OK. Exiting Logstash
root@web1:/usr/share/logstash/bin/logstash -f /etc/logstash/conf.d/syslog-to-es.conf
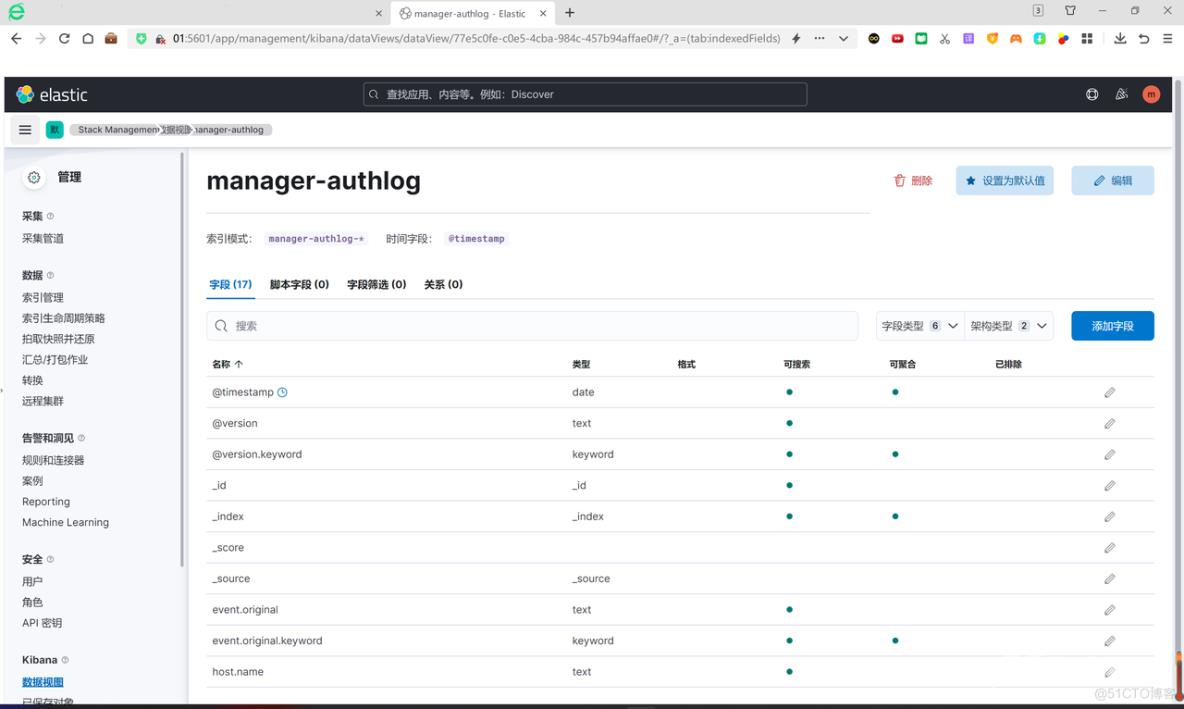
同理,在kibana中创建manager-authlog视图:
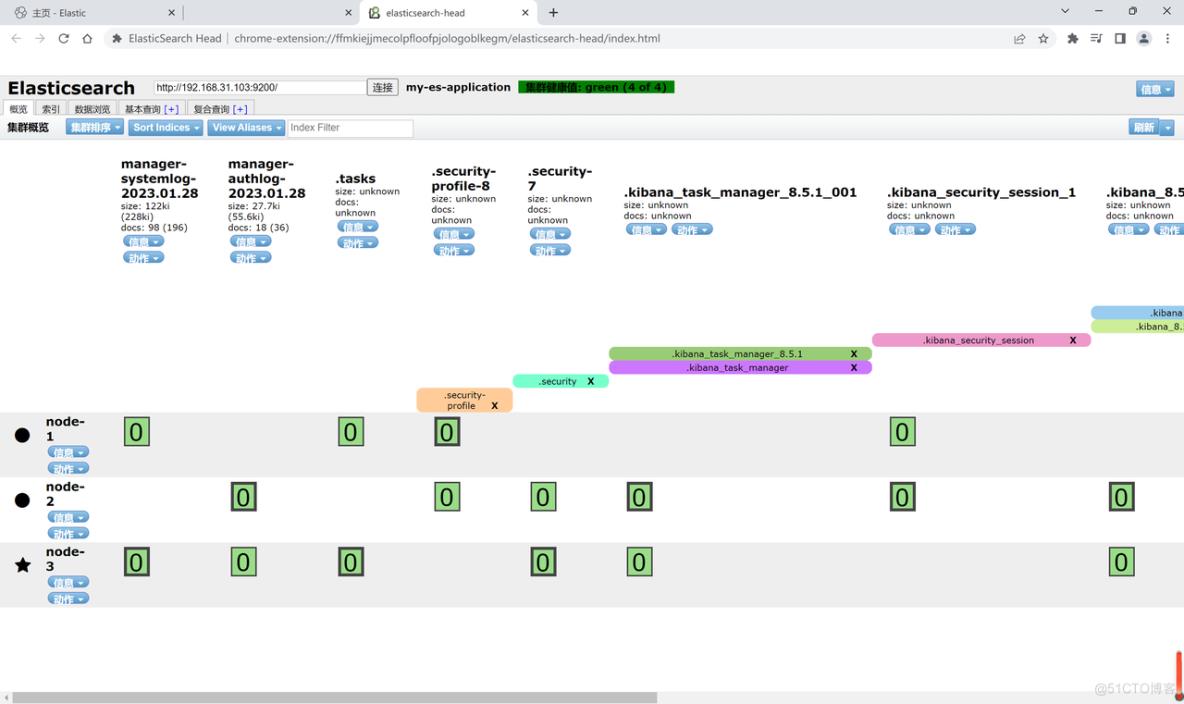
通过elasticsearch-head应用插件进行查看,发现已经生成manager-systemlog-*和manager-authlog-*日志