(目录) 前言 这是我前段时间工作时遇到的一个需求,网上找了一些材料,感觉都不太满意,于是我只能自己上了.废话不多说开始上代码. 需求说明 近七天离线设备统计. 期望效果: 代码 /*
(目录)
前言
这是我前段时间工作时遇到的一个需求,网上找了一些材料,感觉都不太满意,于是我只能自己上了. 废话不多说开始上代码.
需求说明
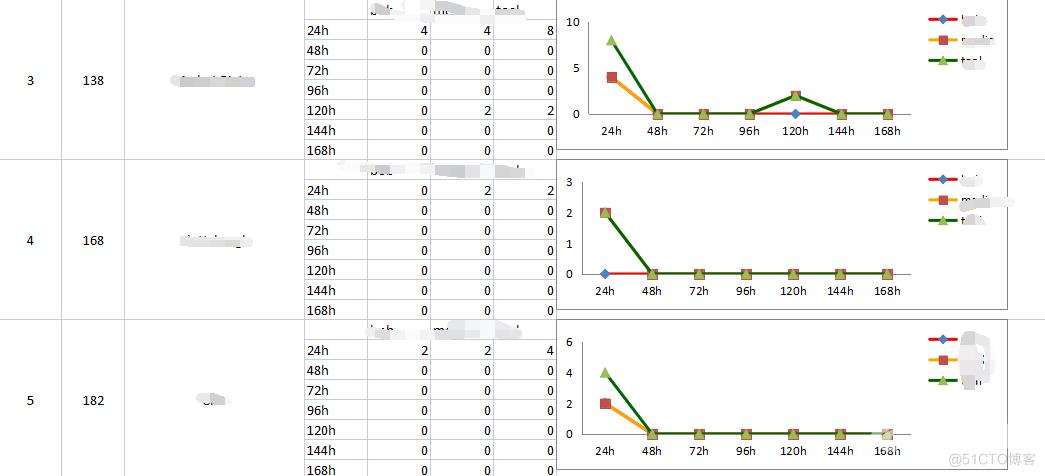
近七天离线设备统计.
期望效果:

代码
/**
     * 开始excel(最近7天离线统计)
     * @param mixed $spreadsheet
     * @param array $value
     * @param int $index
     * @param int $counter
     * @param int $sheetIndex
     */
    public function writeSevenDays($spreadsheet, $value, $index = 4, $counter = 1, $sheetIndex = 1)
    {
        $objActSheet = $spreadsheet->setActiveSheetIndex($sheetIndex); //设置当前的活动sheet

        list($cBob1, $cMedia1, $total1) = $this->checkOffline($value, 'one', 0);
        list($cBob2, $cMedia2, $total2) = $this->checkOffline($value, 'two', 0);
        list($cBob3, $cMedia3, $total3) = $this->checkOffline($value, 'three', 0);
        list($cBob4, $cMedia4, $total4) = $this->checkOffline($value, 'four', 0);
        list($cBob5, $cMedia5, $total5) = $this->checkOffline($value, 'five', 0);
        list($cBob6, $cMedia6, $total6) = $this->checkOffline($value, 'six', 0);
        list($cBob7, $cMedia7, $total7) = $this->checkOffline($value, 'seven', 0);

        $chartIndex = 7;

        $spreadsheet->getActiveSheet($sheetIndex)->mergeCells("A$index" . ':A' . ($index + $chartIndex));
        $spreadsheet->getActiveSheet($sheetIndex)->mergeCells("B$index" . ':B' . ($index + $chartIndex));
        $spreadsheet->getActiveSheet($sheetIndex)->mergeCells("C$index" . ':C' . ($index + $chartIndex));

        $spreadsheet->getActiveSheet($sheetIndex)->getStyle("A$index")->getAlignment()->setHorizontal('center')->setVertical(Alignment::VERTICAL_CENTER);
        $spreadsheet->getActiveSheet($sheetIndex)->getStyle("B$index")->getAlignment()->setHorizontal('center')->setVertical(Alignment::VERTICAL_CENTER);
        $spreadsheet->getActiveSheet($sheetIndex)->getStyle("C$index")->getAlignment()->setHorizontal('center')->setVertical(Alignment::VERTICAL_CENTER);
        $spreadsheet->getActiveSheet($sheetIndex)->setCellValue("A" . $index, $counter);
        $spreadsheet->getActiveSheet($sheetIndex)->setCellValue("B" . $index, $value['StoreNo']);
        $spreadsheet->getActiveSheet($sheetIndex)->setCellValue("C" . $index, $value['StoreName']);

        $spreadsheet->getActiveSheet($sheetIndex)->fromArray(
            [
                ['', 'bob', 'media', 'toal'],
                ['24h', $cBob1, $cMedia1, $total1],
                ['48h', $cBob2, $cMedia2, $total2],
                ['72h', $cBob3, $cMedia3, $total3],
                ['96h', $cBob4, $cMedia4, $total4],
                ['120h', $cBob5, $cMedia5, $total5],
                ['144h', $cBob6, $cMedia6, $total6],
                ['168h', $cBob7, $cMedia7, $total7],
            ],
            null,
            "D$index",
            true
        );

        // Set the Labels for each data series we want to plot
        $dataSeriesLabels = [
            new DataSeriesValues(DataSeriesValues::DATASERIES_TYPE_STRING, '!$E$' . $index, null, 1), // bob
            new DataSeriesValues(DataSeriesValues::DATASERIES_TYPE_STRING, '!$F$' . $index, null, 1), // media
            new DataSeriesValues(DataSeriesValues::DATASERIES_TYPE_STRING, '!$G$' . $index, null, 1), // toal

        ];

        $dataSeriesLabels[0]->setFillColor('FF0000');
        $dataSeriesLabels[1]->setFillColor('FFA500');
        $dataSeriesLabels[2]->setFillColor('006400');
        // Set the X-Axis Labels
        $xAxisTickValues = [
            new DataSeriesValues(DataSeriesValues::DATASERIES_TYPE_STRING, '!$D$' . ($index + 1) . ':$D$' . ($index + $chartIndex), null, 7), // x
        ];
        // Set the Data values for each data series we want to plot
        $dataSeriesValues = [
            new DataSeriesValues(DataSeriesValues::DATASERIES_TYPE_NUMBER, '!$E$' . ($index + 1) . ':$E$' . ($index + $chartIndex), null, 7),
            new DataSeriesValues(DataSeriesValues::DATASERIES_TYPE_NUMBER, '!$F$' . ($index + 1) . ':$F$' . ($index + $chartIndex), null, 7),
            new DataSeriesValues(DataSeriesValues::DATASERIES_TYPE_NUMBER, '!$G$' . ($index + 1) . ':$G$' . ($index + $chartIndex), null, 7),
        ];


        // Build the dataseries
        $series = new DataSeries(
            DataSeries::TYPE_LINECHART, // plotType
            DataSeries::GROUPING_STANDARD, // plotGrouping
            range(0, count($dataSeriesValues) - 1), // plotOrder
            $dataSeriesLabels, // plotLabel
            $xAxisTickValues, // plotCategory
            $dataSeriesValues  // plotValues
        );


        $yAxis = new Axis();
        $yAxis->setAxisOptionsProperties(
            Axis::AXIS_LABELS_NEXT_TO,
            null,
            null,
            null,
            null,
            null,
            null,  // minimum
            null, // maximum
            '1'  // major unit
        );
        // Set the series in the plot area
        $plotArea = new PlotArea(null, [$series]);


        // Set the chart legend
        $legend = new Legend(Legend::POSITION_TOPRIGHT, null, false);

        // $title = new Title('Test Stacked Line Chart');

        // Create the chart
        $chart = new Chart(
            'chart1', // name
            null, // title
            $legend, // legend
            $plotArea, // plotArea
            true, // plotVisibleOnly
            DataSeries::EMPTY_AS_GAP, // displayBlanksAs
            null, // xAxisLabel
            null,
            null,
            $yAxis
        );

        $chartCell = 'H' . $index;

        $spreadsheet->getActiveSheet($sheetIndex)->mergeCells('H' . $index . ':O' . ($index + $chartIndex));
        // Set the position where the chart should appear in the worksheet
        $chart->setTopLeftCell($chartCell)->setBottomRightPosition('O' . ($index + $chartIndex));


        $spreadsheet->getActiveSheet($sheetIndex)->getRowDimension($chartIndex)->setRowHeight(120);
        // Add the chart to the worksheet
        $spreadsheet->getActiveSheet($sheetIndex)->addChart($chart);
    }
 /**
     * 检查相关下线数据是否存在
     *@param array $value
     *@param string $index
     *@param int $isOriginalData
     *@return array
     */
    public function checkOffline($value, $index, $isOriginalData = 1)
    {
        $bob = isset($value[$index]['bob']) ? $value[$index]['bob'] : [];
        $media = isset($value[$index]['media']) ? $value[$index]['media'] : [];
        $cBob = count($bob);
        $cMedia = count($media);
        if ($isOriginalData) {
            return [$bob, $media, $cBob, $cMedia];
        }
        $total = $cBob + $cMedia;
        return [$cBob, $cMedia, $total];
    }
下面来介绍一些我认为比较重要的参数
fromArray 参数详解

- @param array $source Source array
- @param mixed $nullValue Value in source array that stands for blank cell
- @param string $startCell 开始插入数据的坐标
- @param bool $strictNullComparison 默认false,值为true时,没有数据时会默认填充0
Chart 参数

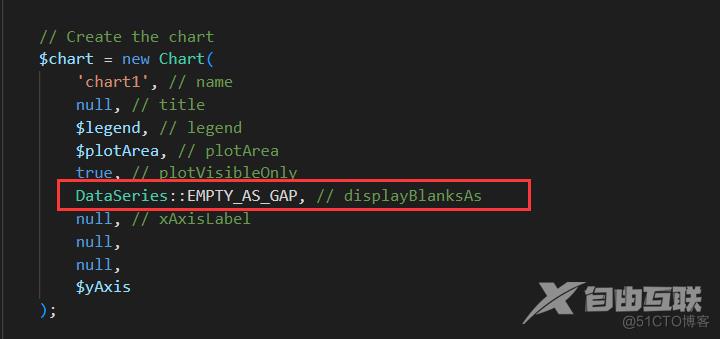
这个参数必须为 ==EMPTY_AS_GAP== 不然的话统计图显示的数量会出现错误
大概就这些了,如果有遇到不同问题的可以评论私聊讨论讨论
【本文由:阿里云代理 http://www.56aliyun.com欢迎留下您的宝贵建议】