今天使用uniapp集成Echarts,实现地图图表的展示 可以参照mpvue-echarts 参照:https://github.com/F-loat/mpvue-echarts https://ask.dcloud.net.cn/article/36288 进行改进 网上有很多教程,但都说的不是很明白,
今天使用uniapp集成Echarts,实现地图图表的展示
可以参照mpvue-echarts
参照:https://github.com/F-loat/mpvue-echarts
https://ask.dcloud.net.cn/article/36288
进行改进
网上有很多教程,但都说的不是很明白,下面直接上步骤
1、npm install echarts mpvue-echarts
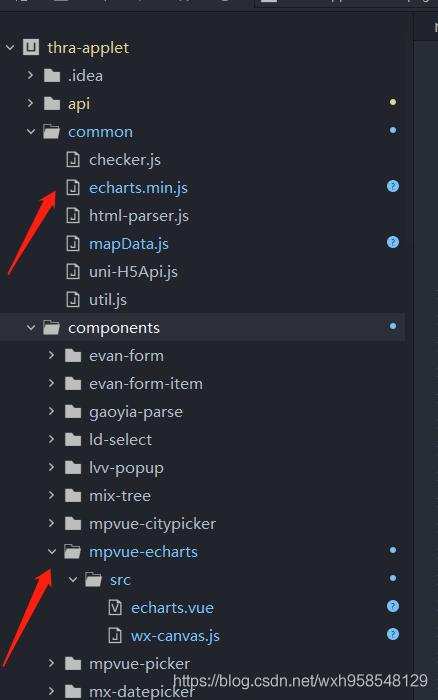
执行该命令后,会在node_modules下生成mpvue-echarts、echarts,然后把mpvue-echarts下的src放到components下,然后在https://echarts.apache.org/zh/builder.html定制echarts的js文件,如下图:

地图实现:
<template>
	<view class="wrap" >
		<mpvue-echarts id="main" ref="mapChart" :echarts="echarts" @onInit="renderMap" />
	</view>
</template>

<script>
import * as echarts from '@/common/echarts.min'; /*chart.min.js为在线定制*/
import * as henanJson from 'echarts/map/json/province/henan.json'; /*chart.min.js为在线定制*/
import mpvueEcharts from '@/components/mpvue-echarts/src/echarts.vue';


export default {
	data() {
		return {
			echarts,
		};
	},
	components: {
		mpvueEcharts
	},
	onLoad() {

	},
	methods: {
		renderMap(e) {
			var mydata = [
				{ name: '郑州市', value: 100 },
				{ name: '洛阳市', value: 10 },
				{ name: '开封市', value: 20 },
				{ name: '信阳市', value: 30 },
				{ name: '驻马店市', value: 40 },
				{ name: '南阳市', value: 41 },
				{ name: '周口市', value: 15 },
				{ name: '许昌市', value: 25 },
				{ name: '平顶山市', value: 35 },
				{ name: '新乡市', value: 35 },
				{ name: '漯河市', value: 35 },
				{ name: '商丘市', value: 35 },
				{ name: '三门峡市', value: 35 },
				{ name: '济源市', value: 35 },
				{ name: '焦作市', value: 35 },
				{ name: '安阳市', value: 35 },
				{ name: '鹤壁市', value: 35 },
				{ name: '濮阳市', value: 35 },
				{ name: '开封市', value: 45 }
			];
			let { canvas, width, height } = e;
			echarts.setCanvasCreator(() => canvas);
			const chart = echarts.init(canvas, null, {
				width: width,
				height: height
			});
			echarts.registerMap('henan', henanJson);
			canvas.setChart(chart);
			var optionMap = {
				tooltip: {
					trigger: 'item',
					formatter: '{b}: {c}mg/m³'
				},
				//左侧小导航图标
				visualMap: {
					show:true,
					min: 0,
					max: 100,
					left: 'right',
					orient:'horizontal',
				},
				//配置属性
				series: [
					{
						type: 'map',
						mapType: 'henan',
						label: {
							normal: {
								show: true
							},
							emphasis: {
								textStyle: {
									color: '#fff'
								}
							}
						},
						itemStyle: {
							normal: {
								borderColor: '#389BB7',
								areaColor: '#fff'
							},
							emphasis: {
								areaColor: '#389BB7',
								borderWidth: 0
							}
						},
						animation: false,
						data: mydata //数据
					}
				]
			};
			//初始化echarts实例
			chart.setOption(optionMap);
			this.$refs.mapChart.setChart(chart);
		}
	}
};
</script>

<style scoped lang="scss">
.wrap {
  width: 100%;
  height: 400px;
}
</style>
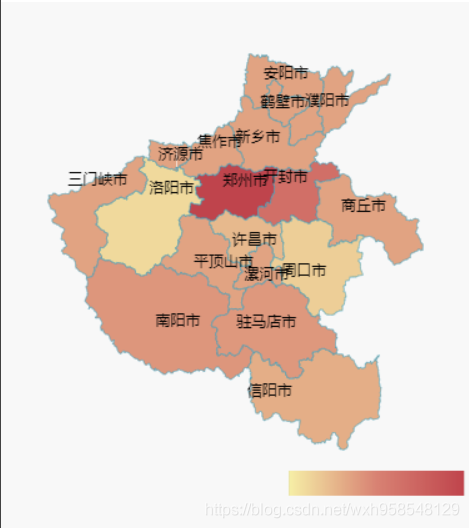
效果:

关于地图的json文件,在echarts里面 echarts\map
到此这篇关于uniapp在微信小程序中使用ECharts的方法的文章就介绍到这了,更多相关uniapp使用ECharts内容请搜索自由互联以前的文章或继续浏览下面的相关文章希望大家以后多多支持自由互联!
