需求 SSE JinQiao 一楼服务器功率信息汇总,数据推送到 ELK 在 ELK 做二次分析 分类汇总 M320 所有服务器每小时最大功率汇总 CI Node 所有机器每小时最大功率汇总 非上述机器全部归类为 O
需求
- SSE JinQiao 一楼服务器功率信息汇总,数据推送到 ELK
-
在 ELK 做二次分析
-
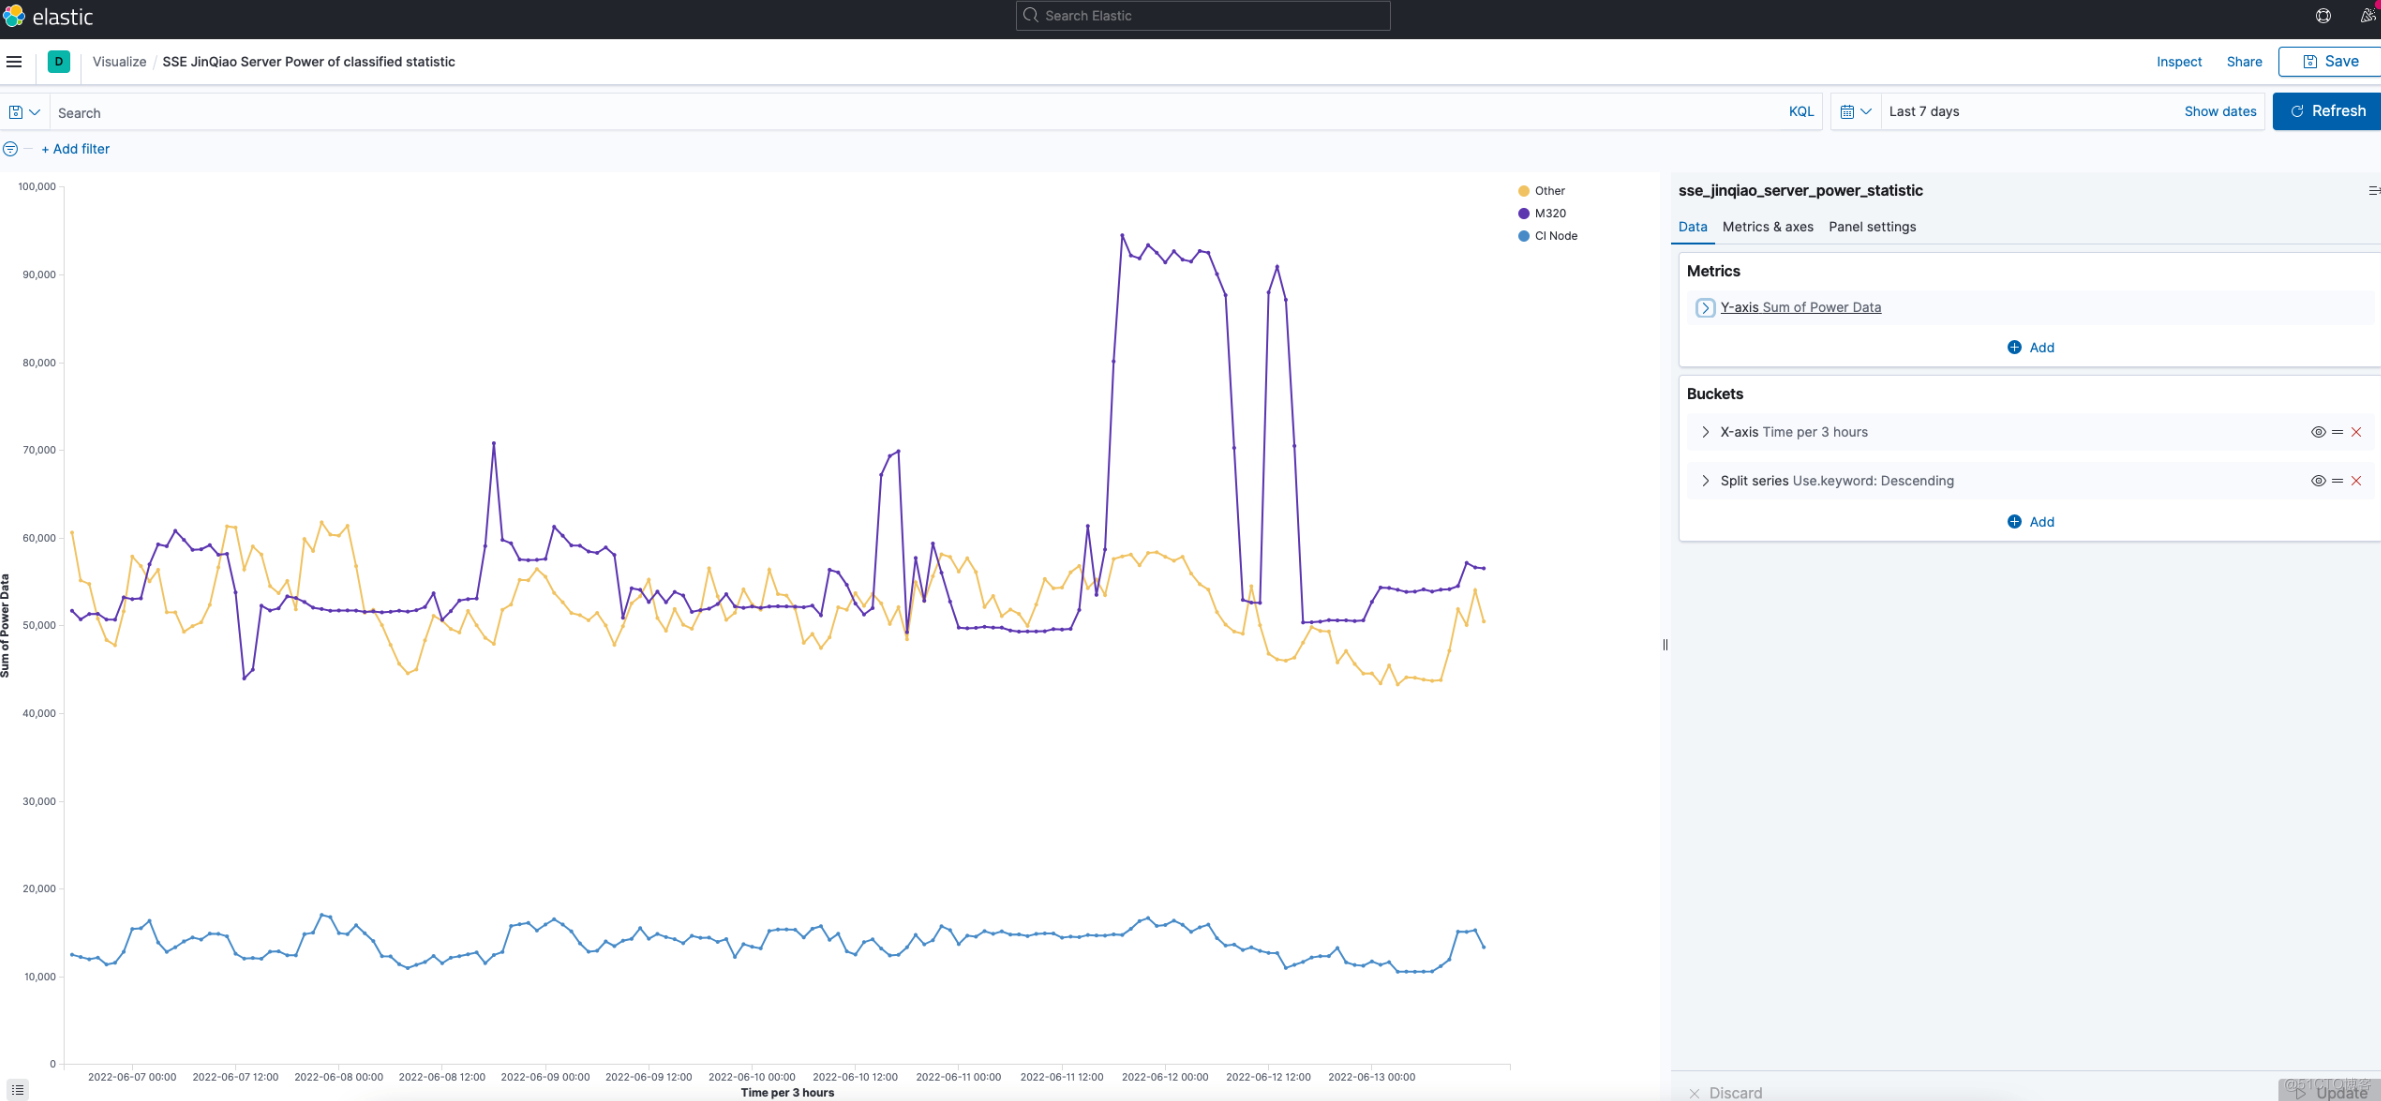
分类汇总
- M320 所有服务器每小时最大功率汇总
- CI Node 所有机器每小时最大功率汇总
- 非上述机器全部归类为 Other 服务器的每小时最大功率汇总
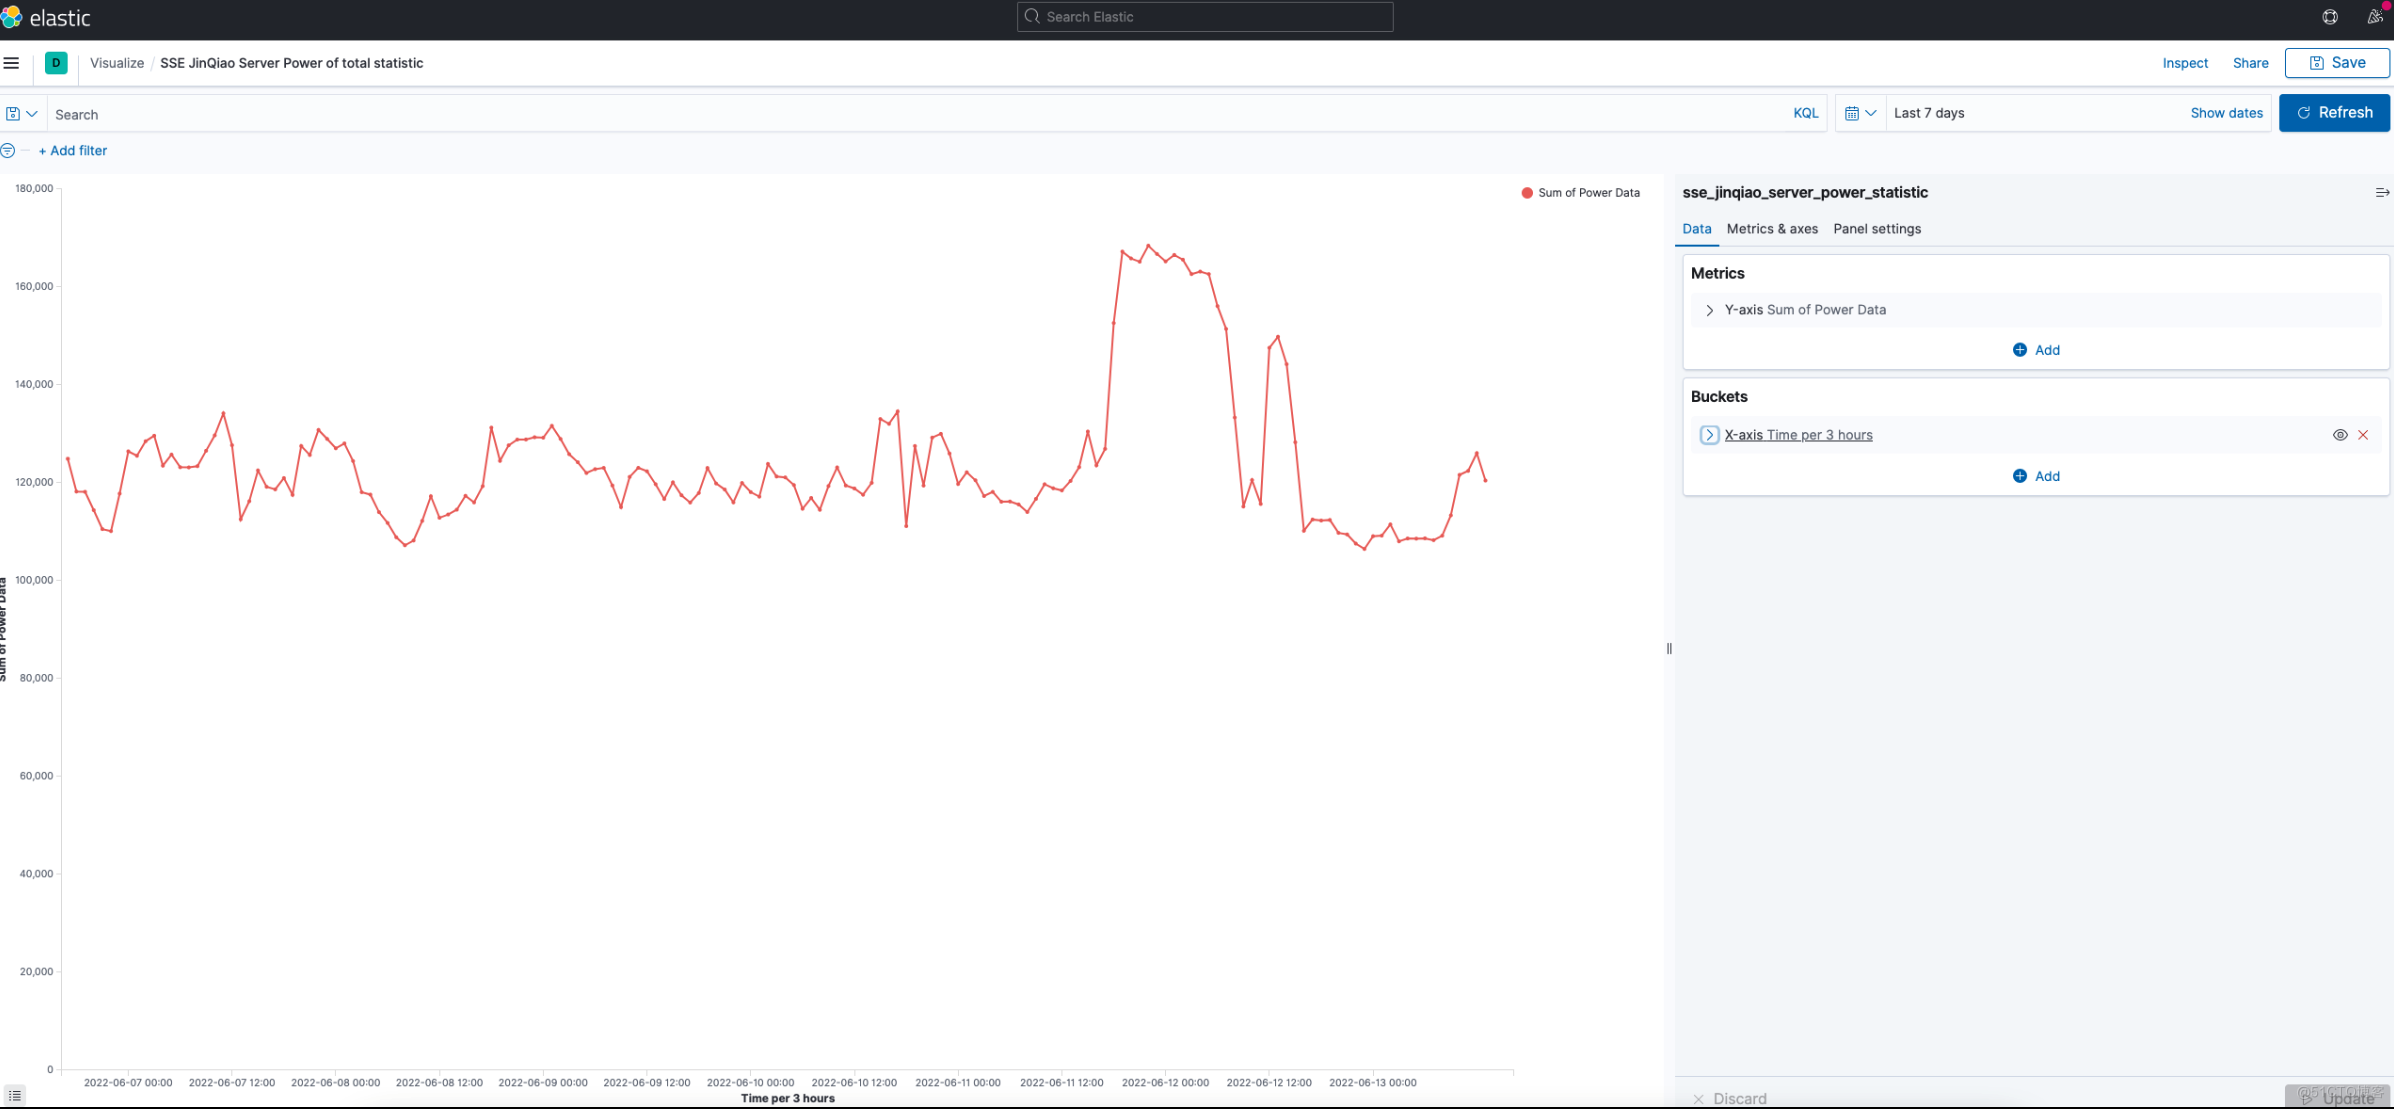
- 功率使用总计
- 不分类计算 JinQiao 所有服务器每小时最大功率
-
实现
2.1. python script:cat zabbixAuth.py
#!/usr/bin/env python3.8 # coding=utf-8 import json from urllib import request, error class zabbixAuth: def __init__(self): self.url = "http://localhost/api_jsonrpc.php" self.header = {"Content-Type": "application/json"} def user_login(self): data = json.dumps({ "jsonrpc": "2.0", "method": "user.login", "params": {"user": "username", "password": "password"}, "id": 0 }).encode('utf-8') req = request.Request(self.url, data, self.header) try: result = request.urlopen(req) except error.HTTPError as e: return "Auth Failed, Please Check Your Name AndPassword:", e.code else: response = json.loads(result.read()) result.close() return response['result']cat power_summary_to_es.py
#!/usr/bin/env python3.8 # coding=utf-8 import argparse import json import os import re import sys import datetime import time from urllib import request, error from elasticsearch import Elasticsearch, helpers import zabbixAuth class zabbix_api: def __init__(self): self.url = "http://localhost/api_jsonrpc.php" self.header = {"Content-Type": "application/json"} def conn_zabbix(self, data): req = request.Request(self.url, data, self.header) try: result = request.urlopen(req) except error.HTTPError as e: return 'The server could not fulfill the request, Error code: ', e.code else: response = json.loads(result.read()) result.close() if len(response['result']) == 0: return None return response['result'] def get_item_datas(self): # jinqiao_power_hostlist.txt 里是服务器的 Hostname with open("/Users/kaili/PycharmProjects/pythonProject/zabbix_power_analysis/jinqiao_power_hostlist.txt", encoding='utf-8') as files: item_gathers = [] for host in files.readlines(): try: item_dict = {} host = host.rstrip() item_ds = json.dumps( { "jsonrpc": "2.0", "method": "item.get", "params": { "output": [ "itemid", ], "host": host, "search": { "key_": "enflame.parameter[check_total_power]" }, "selectHosts": [ "name", ], "sortfield": "name" }, "auth": token, "id": 1 }, ).encode('utf-8') item_details = self.conn_zabbix(item_ds) for i in item_details: item_dict['itemid'] = i['itemid'] item_dict['hostname'] = i['hosts'][0]['name'] for items in item_details: itemid = items['itemid'] host_datas = json.dumps( { "jsonrpc": "2.0", "method": "host.get", "params": { "output": [ "groups" ], "itemids": itemid, "selectGroups": [ "name" ] }, "auth": token, "id": 1, } ).encode('utf-8') host_details = self.conn_zabbix(host_datas) for host_detail in host_details[0]['groups']: if "Linux servers" not in host_detail['name']: item_dict['group'] = host_detail['name'] item_gathers.append(item_dict) except Exception as error: return error return item_gathers def get_power_datas(self, item_datas, cycle_string): if item_datas and cycle_string: power_statistics = [] for items in item_datas: itemid = items['itemid'] hostname = items['hostname'] # 判断用户传入的时间参数,时间最大不能超过 7 天 if str(re.findall(r"\D+", cycle_string)[0]) == "days" and int(re.findall(r"\d+", cycle_string)[0]) <= 7: days = int(re.findall(r"\d+", cycle_string)[0]) start_time = int(time.mktime((datetime.datetime.now().date() - datetime.timedelta(days=days)).timetuple())) stop_time = int(time.mktime(datetime.date.today().timetuple())) - 1 elif str(re.findall(r"\D+", cycle_string)[0]) == "hours" and int( re.findall(r"\d+", cycle_string)[0]) <= 168: hours = int(re.findall(r"\d+", cycle_string)[0]) start_time = int(time.mktime((datetime.datetime.now().replace(minute=0, second=0, microsecond=0) - datetime.timedelta(hours=hours)).timetuple())) stop_time = int(datetime.datetime.now().replace(minute=0, second=0, microsecond=0).timestamp()) trenddata = json.dumps( { "jsonrpc": "2.0", "method": "trend.get", "params": { "output": [ "clock", "value_max", ], "time_from": start_time, "time_till": stop_time, "itemids": [ itemid ] }, "auth": token, "id": 1, } ).encode('utf-8') power_datas = self.conn_zabbix(trenddata) if power_datas: for power_value in power_datas: power_trend_data = {} # 数据存储到 ES 如时间字段不指定时区,默认为 UTC时间,所以这里指定时间为 东八区 data_time = datetime.datetime.fromtimestamp(int(power_value['clock'])).isoformat() + "+0800" if 'group' in items.keys(): if "Enflame-M320" in items['group']: use = "M320" elif "Enflame-CI_Test" in items['group']: use = "CI Node" else: use = "Other" else: use = "Other" power_trend_data.update({"Hostname": hostname, "Use": use, "Time": data_time, "Power Data": int(power_value["value_max"]), }) power_statistics.append(power_trend_data) return power_statistics def pushdata_to_es(self, power_statistics, es_ip, index_name): if power_statistics: index_name = index_name es_cluster = Elasticsearch(es_ip) actions = [] for power in power_statistics: action = { "_index": index_name, "_source": { "Hostname": power['Hostname'], "Use": power['Use'], "Time": power['Time'], "Power Data": power['Power Data'], } } actions.append(action) helpers.bulk(es_cluster, actions) def get_args(): parser = argparse.ArgumentParser(usage="usage: %(prog)s [--time] [time]") # 如用户不传入时间参数,默认获取过去 1 小时的趋势数据 parser.add_argument("--time", default="1hours", help="example: 1hours, 24hours, 1days, 3days ... The maximum time cannot exceed 168 hours") args = parser.parse_args() return args if __name__ == "__main__": sys.path.append(os.path.dirname(os.path.dirname(os.path.abspath(__file__)))) startTime = time.time() zabbix = zabbix_api() userAuth = zabbixAuth.zabbixAuth() token = userAuth.user_login() item_datas = zabbix.get_item_datas() args = get_args() cycle_string = args.time if cycle_string is None: print("Please enter a date less than 7 days or any hour, Use the 'python %s -h' to view help: " % sys.argv[0]) power_statistics = zabbix.get_power_datas(item_datas, cycle_string) zabbix.pushdata_to_es(power_statistics, es_ip="127.0.0.1", index_name="sse_jinqiao_server_power_statistic") endTime = time.time() # 计算整段程序运行时长 print('Running time: %s Seconds' % (endTime - startTime)) # 在 CROBTAB 执行时可以输出log便于查看CRONTAB 都在什么时间段执行的 print("script start time at %s, stop time at %s" % ( time.strftime("%Y-%m-%d %H:%M:%S", time.localtime(int(startTime))), time.strftime("%Y-%m-%d %H:%M:%S", time.localtime(int(endTime)))))定义 CRONTAB
CROBTAB 每小时执行一次脚本,脚本中默认获取过去一小时的趋势数据,由于zabbix 的趋势数据默认返回每小时内的平均、最大、最小值,返回的时间为整点时间,例如 下午 14:30 执行 CROBTAB,会获取到 下午 13:00:14:00 的趋势数据;
30 */1 * * *Note:亲测 zabbix数据存储到 mysql 数据库中有延时配置,例如在 9 点 10 分之后才能获取到的是 8:00 的数据,在 9:00 – 9:05 之间是无法获取 8 点的数据的,数据不是实时的情况下,为了确保数据的完整性,建议 每一小时 获取过去一小时的数据,并且为了保险起见,CRON 执行的时间建议在 10分之后,例如 9:30 CRON JOB执行获取 8 点的数据,在 11:30 点执行获取 10 点的趋势数据;
Kibana Dashboard 二次分析
创建 【分类汇总】的 Visualizations :
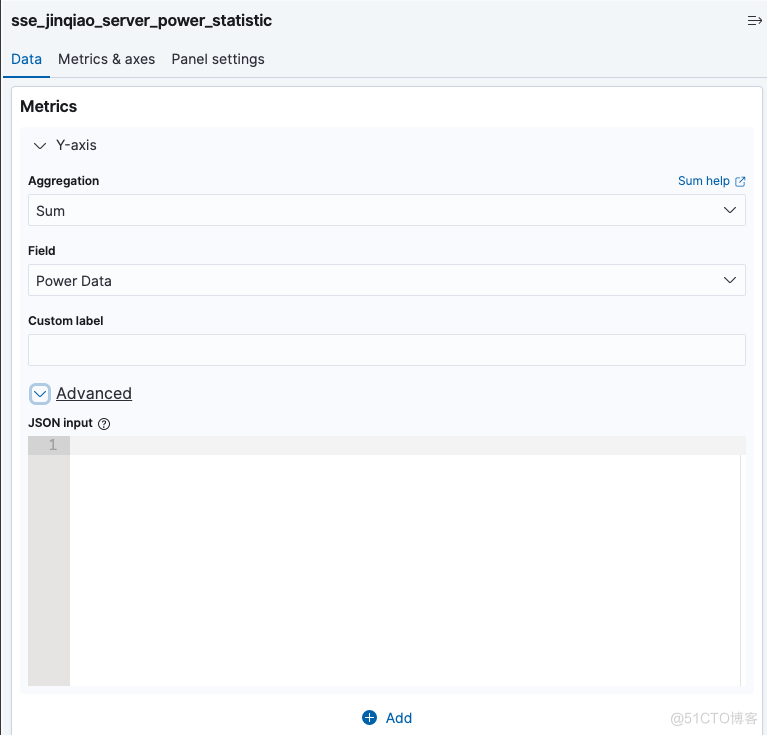
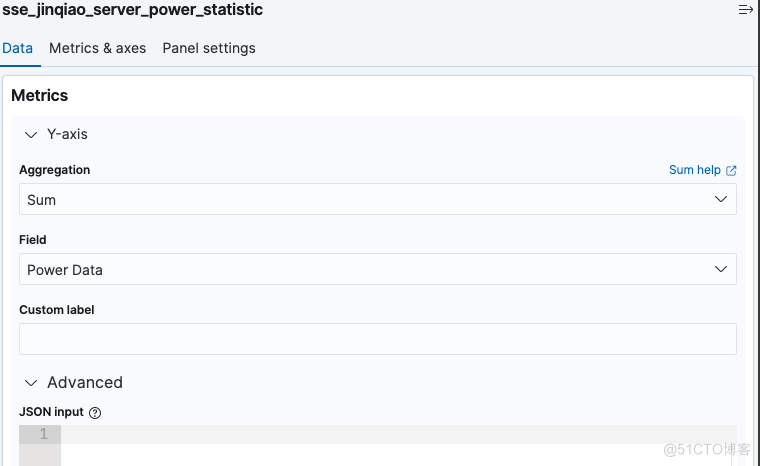
Metrics -->Y-axis 配置如图:
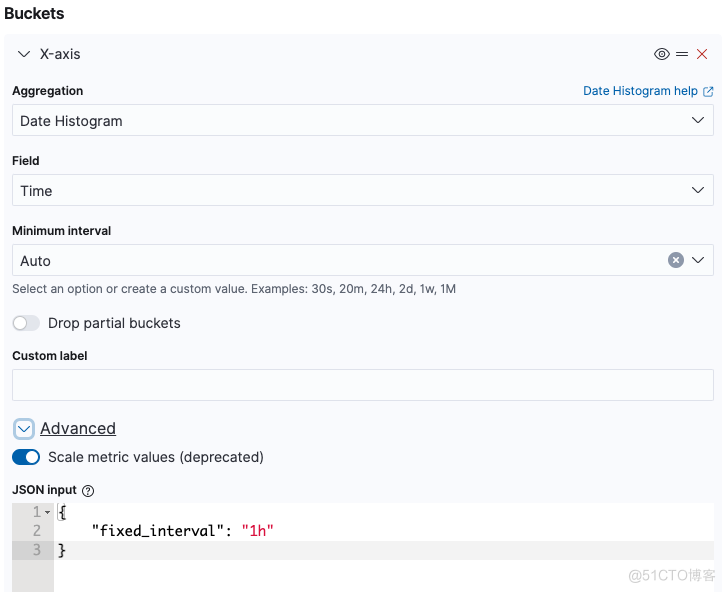
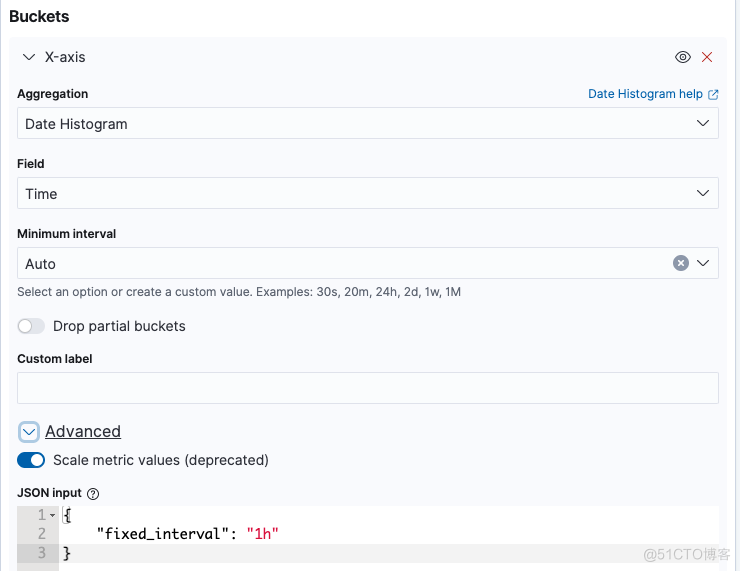
Buckets -->X-axis 配置如图:
Note:
在选择时间范围 >= 15day 时,Kibana 会根据数据量自动扩展 interval ,如需要时间间隔需要配置 fixed_interval,强制 kibana 使用我们定义的 interval; 另外注意 Minimum interval 需要设置为 Auto;Advanced需要开启 Scale metric values,否则数据会不准确。
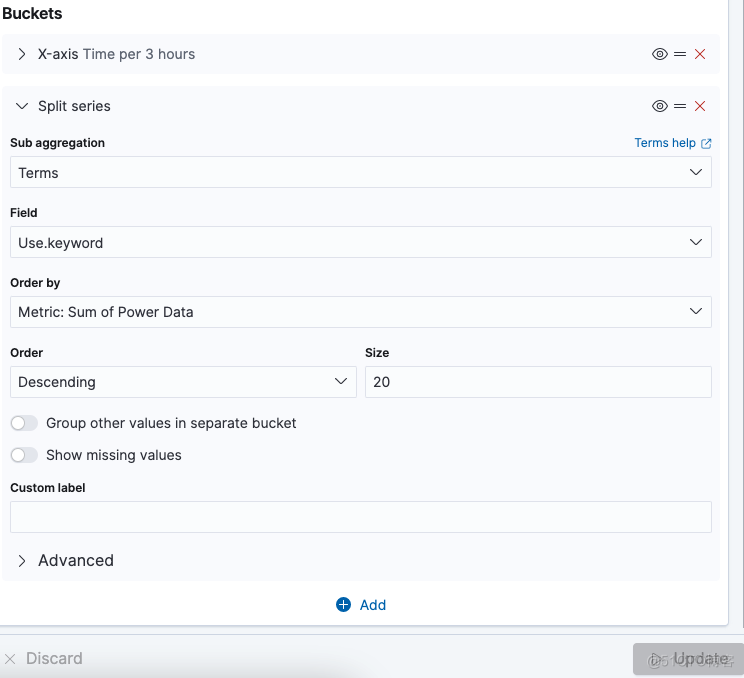
Date Histogram Aggregation(日期聚合) Date Histogram Aggregation(日期直方图聚合): 官方文档:[日期直方图使用介绍](https://www.elastic.co/guide/en/elasticsearch/reference/7.11/search-aggregations-bucket-datehistogram-aggregation.html) 类似于普通的 histogram,但它只能与日期或日期范围值一起使用;像直方图,数值四舍五入下来到最接近的水桶。例如,如果间隔是一个日历日,2020-01-03T07:00:01Z则四舍五入为 2020-01-03T00:00:00Z calendar_interval (日历间隔): 使用calendar_interval参数配置 毫秒:1ms 10ms 秒:second/1s 10s 分钟:minute/1m 10m 小时:hout/1h 2h 天:day 2d 不支持 星期:week/1w 不支持 月:month/1M 不支持 季度:quarter/1q 不支持 年:year/1y 不支持 fixed_interval(固定间隔) 通过fixed_interval参数配置。 固定间隔的可接受单位是:毫秒 ( ms)--秒 ( s)--分钟 ( m)--小时 ( h)--天 ( d) 不过这个参数将要过期,替代的是fixed_interval和calendar_interval,可以参考这个页面,有详细说明: Date histogram aggregation | Elasticsearch Guide [8.2] | Elastic 简单来说,calendar_interval支持1年、1季度、1月、1周、1天、1小时、1分钟,不支持时间为复数,fixed_interval支持的时间单位为天、小时、分、秒、毫秒,允许复数,例如"fixed_interval" : "30d",表示为30天。Buckets -->Split series 配置如图:
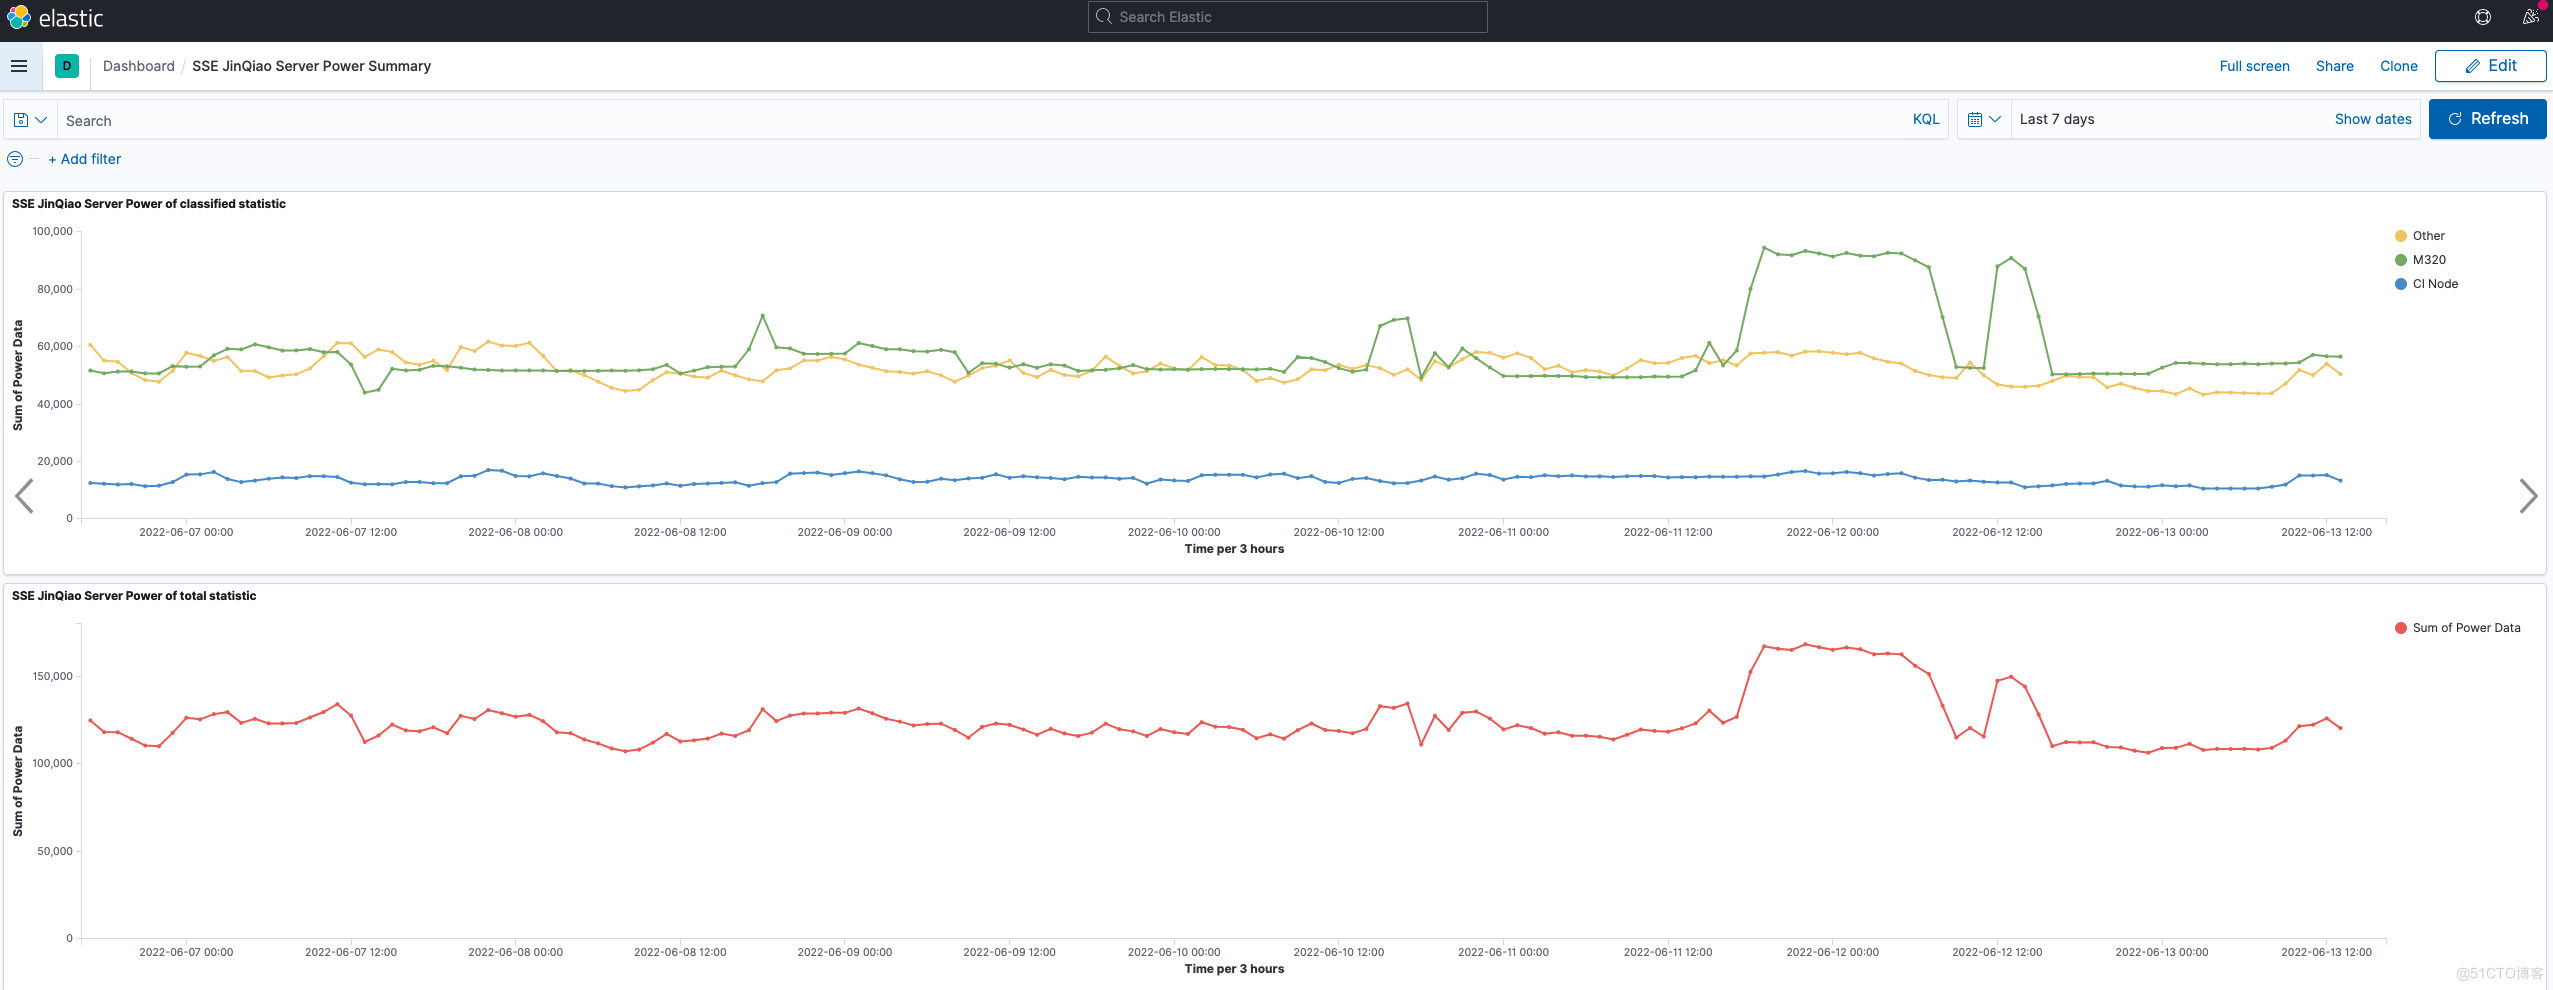
分类汇总 Visualizations 效果:
创建 【功率使用总计】的 Visualizations :
汇总所有服务器不分类的功率使用总计
Metrics -->Y-axis 配置如图:
Buckets -->X-axis 配置如图:
功率使用总计 Visualizations 效果:
将【分类汇总】和【使用总计】聚合到一个 Dashboard,便于观看