基于Prometheus+Grafana+Alertmanager监控Pulsar并通过钉钉发告警
下载prometheus
https://prometheus.io/download/
安装prometheustar zxvf prometheus-2.24.0.linux-amd64.tar.gz -d /workspace/ cd /workspace/prometheus/修改配置文件
vim prometheus.yml global: scrape_interval: 15s # Set the scrape interval to every 15 seconds. Default is every 1 minute. evaluation_interval: 15s # Evaluate rules every 15 seconds. The default is every 1 minute. external_labels: cluster: pulsar-cluster-1 #添加pulsar集群名称 # scrape_timeout is set to the global default (10s). # Alertmanager configuration alerting: alertmanagers: - static_configs: - targets: - "localhost:9093" #开启alertmanagers监控 # Load rules once and periodically evaluate them according to the global 'evaluation_interval'. rule_files: #- "rules/*.yaml" - "alert_rules/*.yaml" #指定告警规则路径 #- "first_rules.yml" #- "second_rules.yml" # A scrape configuration containing exactly one endpoint to scrape: # Here it's Prometheus itself. scrape_configs: # The job name is added as a label `job=<job_name>` to any timeseries scraped from this config. - job_name: 'prometheus' # metrics_path defaults to '/metrics' # scheme defaults to 'http'. static_configs: - targets: ['localhost:9090'] - job_name: 'nacos-cluster' honor_labels: true scrape_interval: 60s metrics_path: '/nacos/actuator/prometheus' static_configs: - targets: - 10.9.4.42:8848 - 10.9.5.47:8848 - 10.9.5.75:8848 - job_name: "broker" honor_labels: true # don't overwrite job & instance labels static_configs: - targets: ['10.9.4.42:8080','10.9.5.47:8080','10.9.5.75:8080'] - job_name: "bookie" honor_labels: true # don't overwrite job & instance labels static_configs: - targets: ['10.9.4.42:8100','10.9.5.47:8100','10.9.5.75:8100'] #在安装bookie的时候我把端口改了,默认为8000 - job_name: "zookeeper" honor_labels: true static_configs: - targets: ['10.9.4.42:8000','10.9.5.47:8000','10.9.5.75:8000'] - job_name: "node" honor_labels: true static_configs: - targets: ['10.9.4.42:9100','10.9.5.47:9100','10.9.5.75:9100']创建规则目录
cd /workspace/prometheus/mkdir alert_rules启动prometheus
nohup ./prometheus --config.file="prometheus.yml" > /dev/null 2>&1 &检查prometheus是否启动成功
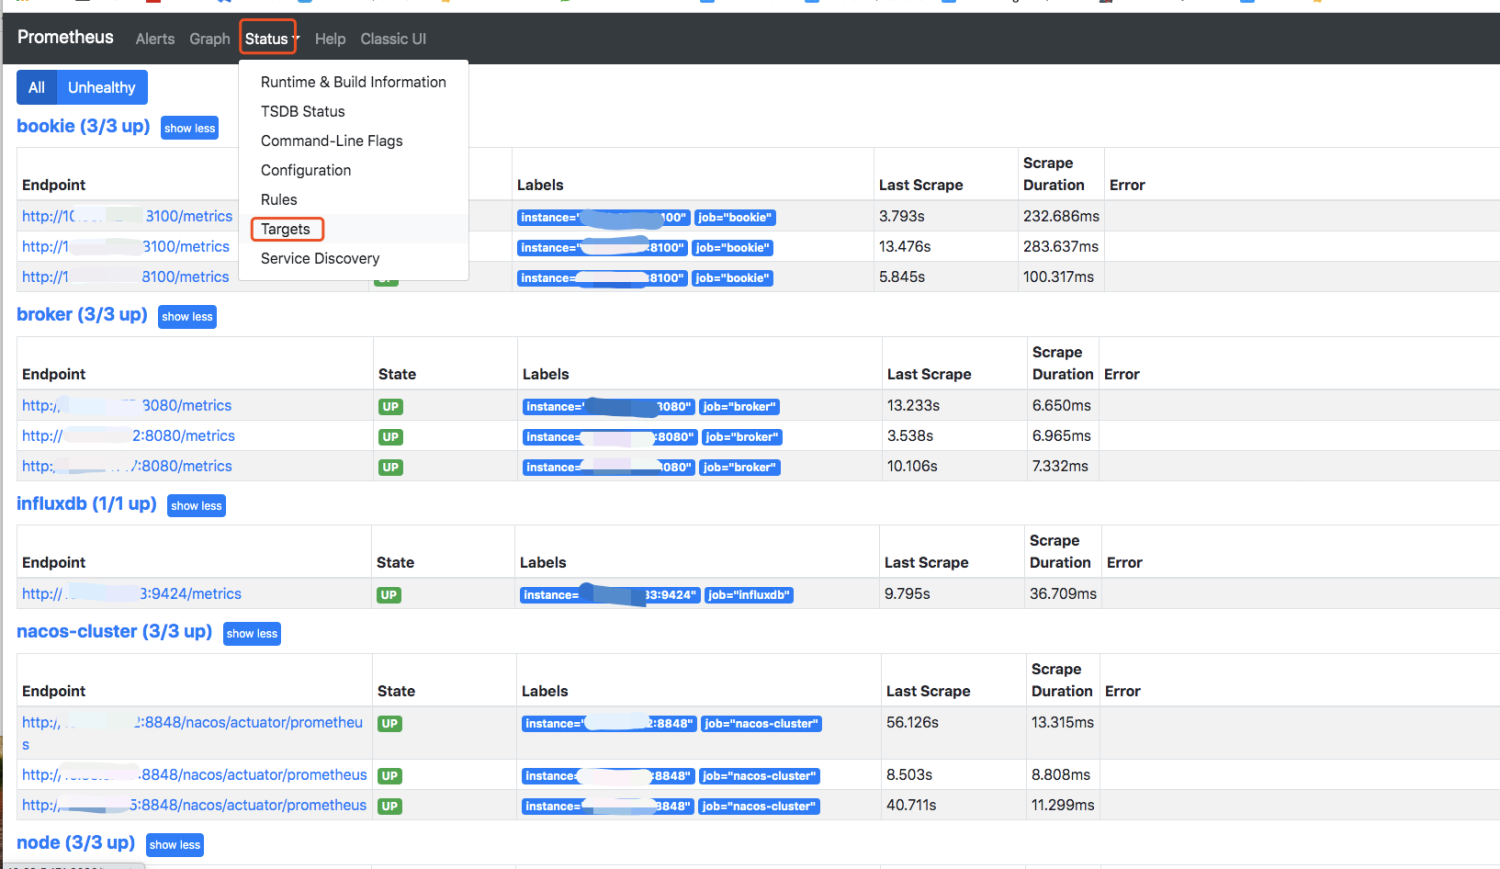
http://10.9.5.71:9090/targets 如图,说明promether启动成功
安装node_exporter
https://prometheus.io/download/
每台主机上都需要安装上node_exporter
tar -zxvf node_exporter-1.0.1.linux-amd64.tar.gz cd node_exporter-1.0.1.linux-amd64/启动node_exporter
nohup ./node_exporter > /dev/null 2>&1 &安装Grafana下载并安装grafana
sudo yum install https://s3-us-west-2.amazonaws.com/grafana-releases/release/grafana-5.2.4-1.x86_64.rpm sudo yum install -y grafana-5.2.4-1.x86_64.rpm sudo service grafana-server start登陆grafana
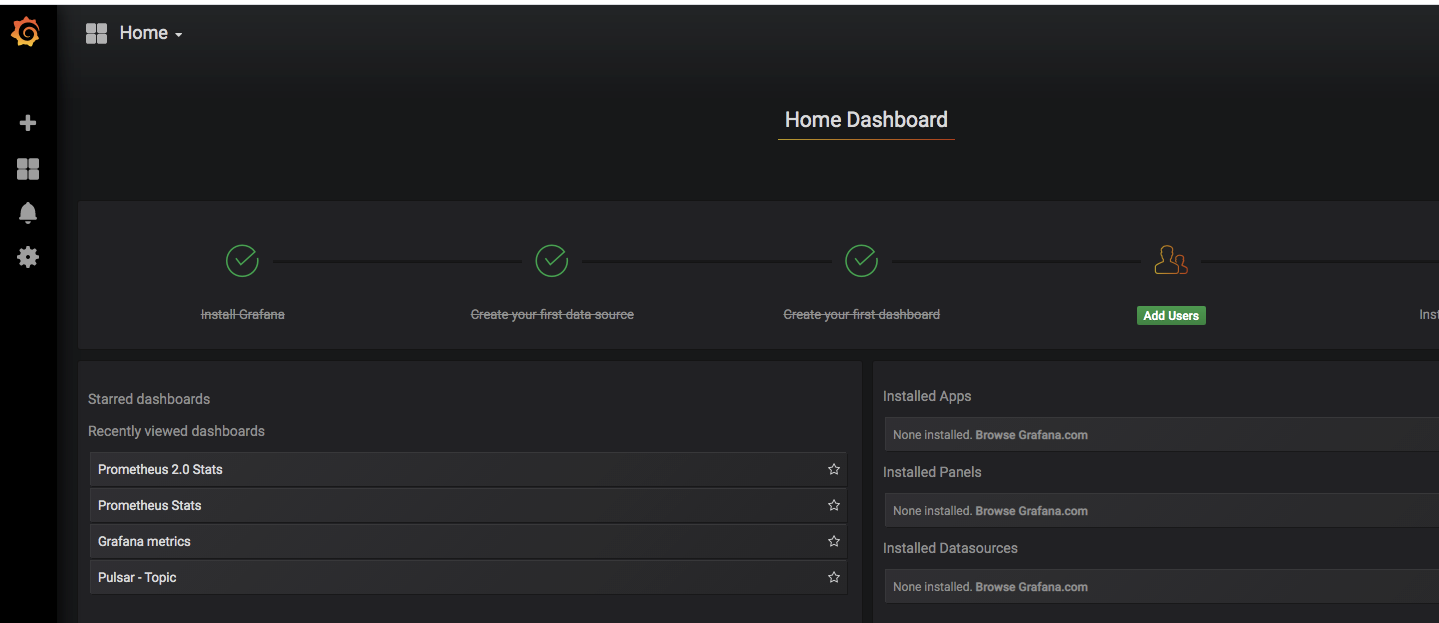
http://10.9.5.71:3000 默认账号密码为:admin
下载grafana所需要监控的pulsar json文件
https://github.com/streamnative/apache-pulsar-grafana-dashboard
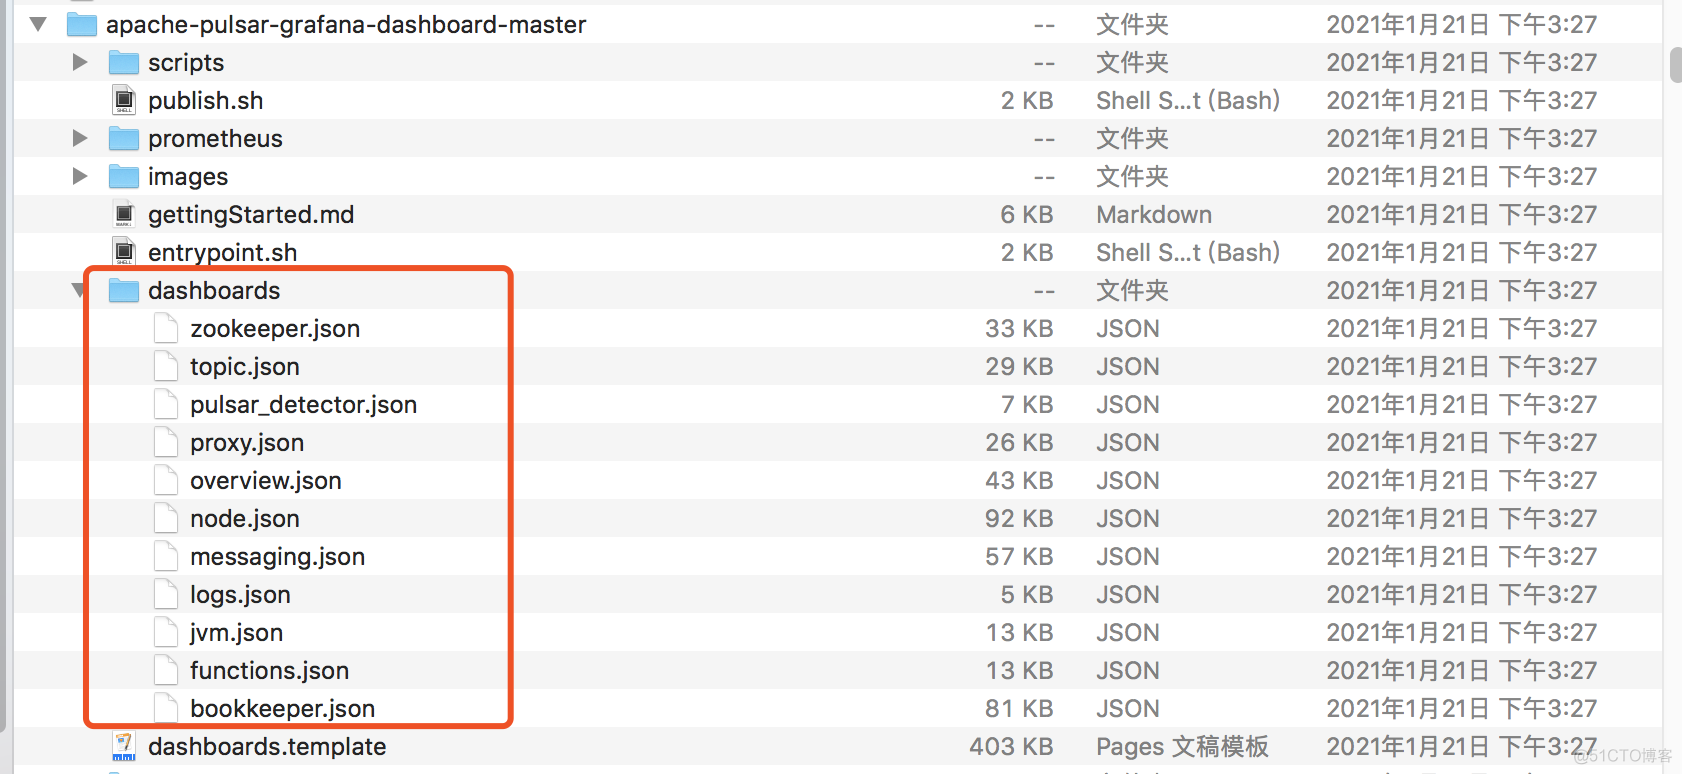
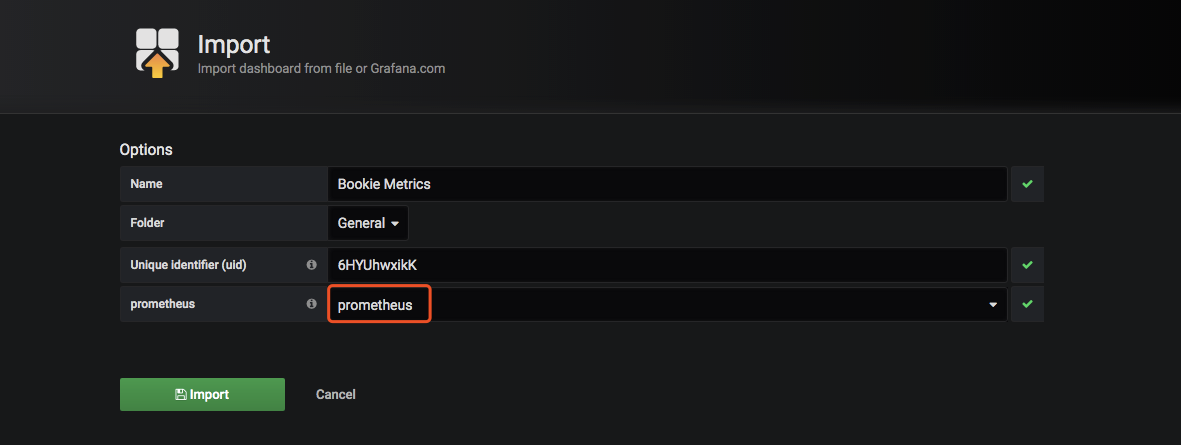
文档解压,在dashboards目录中所有的文件中json文件里的{{ PULSAR_CLUSTER }} 替换成prometheus数据源,足个导入到granfan中
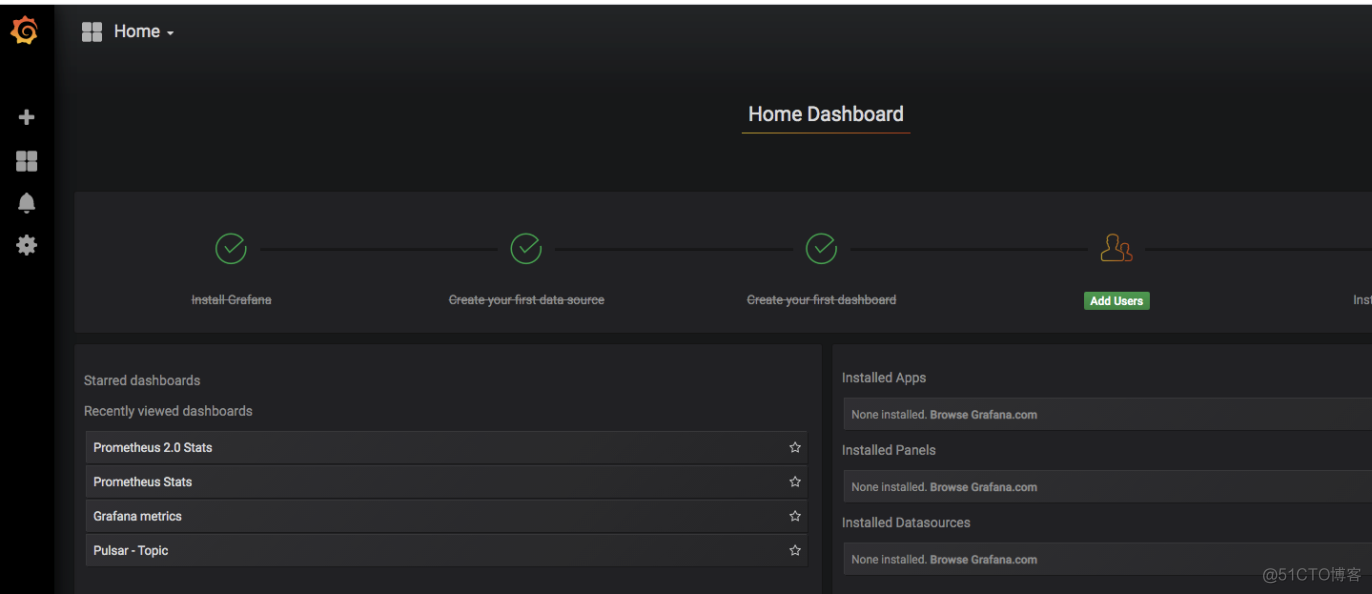
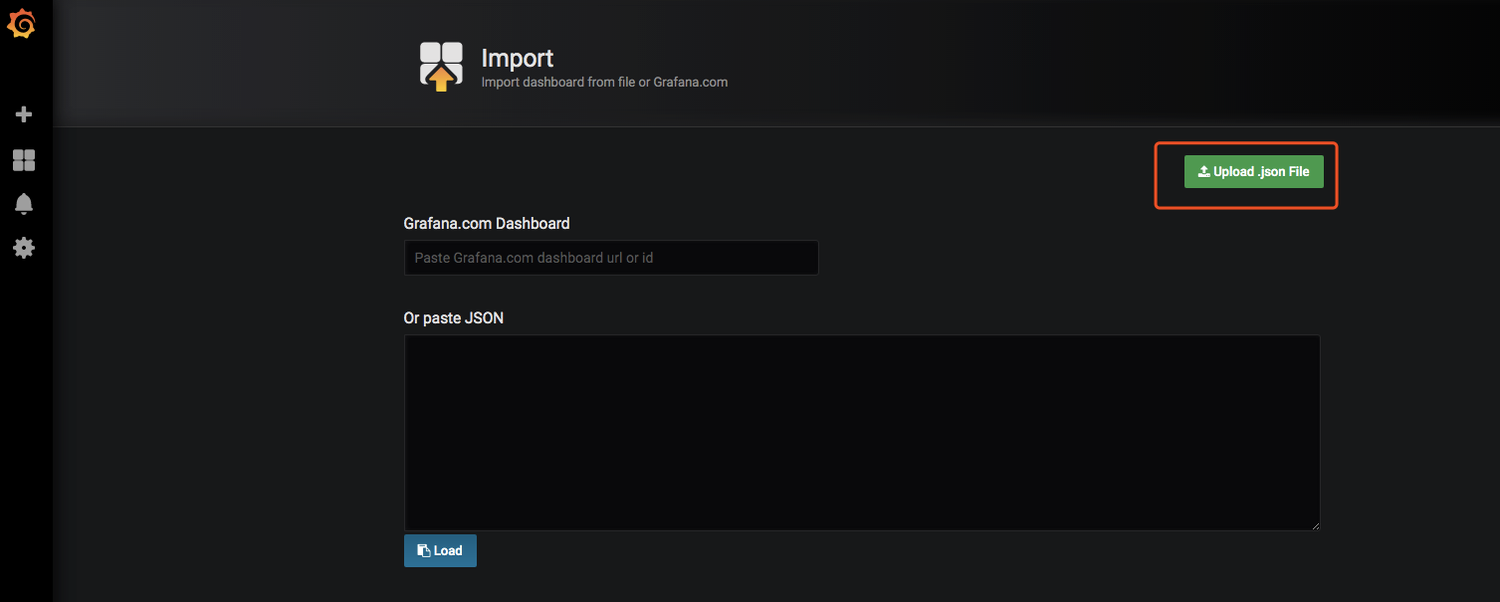
选择导入 Upload.json File
数据源选择prometheus
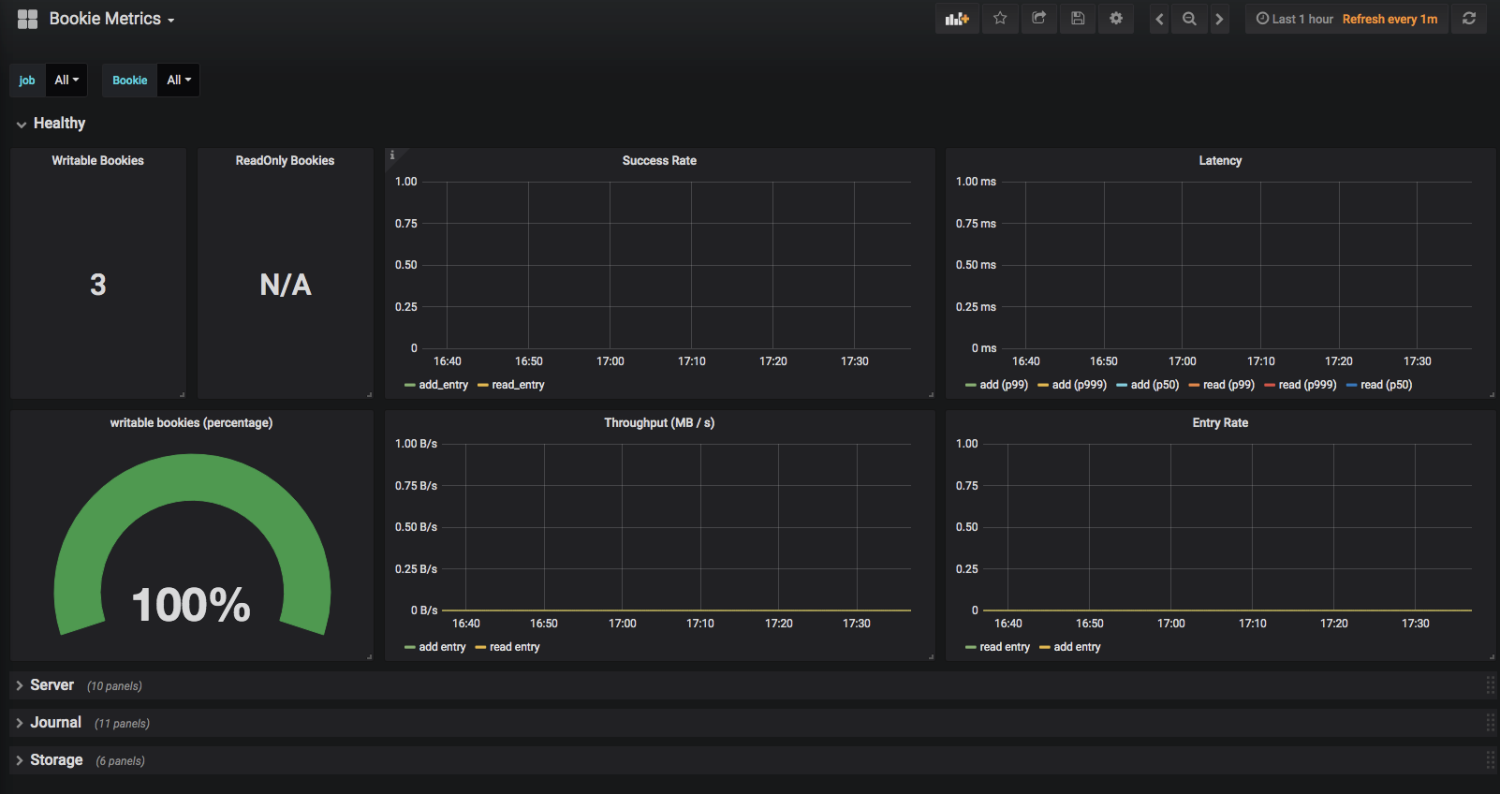
选择Bookie Metrics面板就可以看到面板了
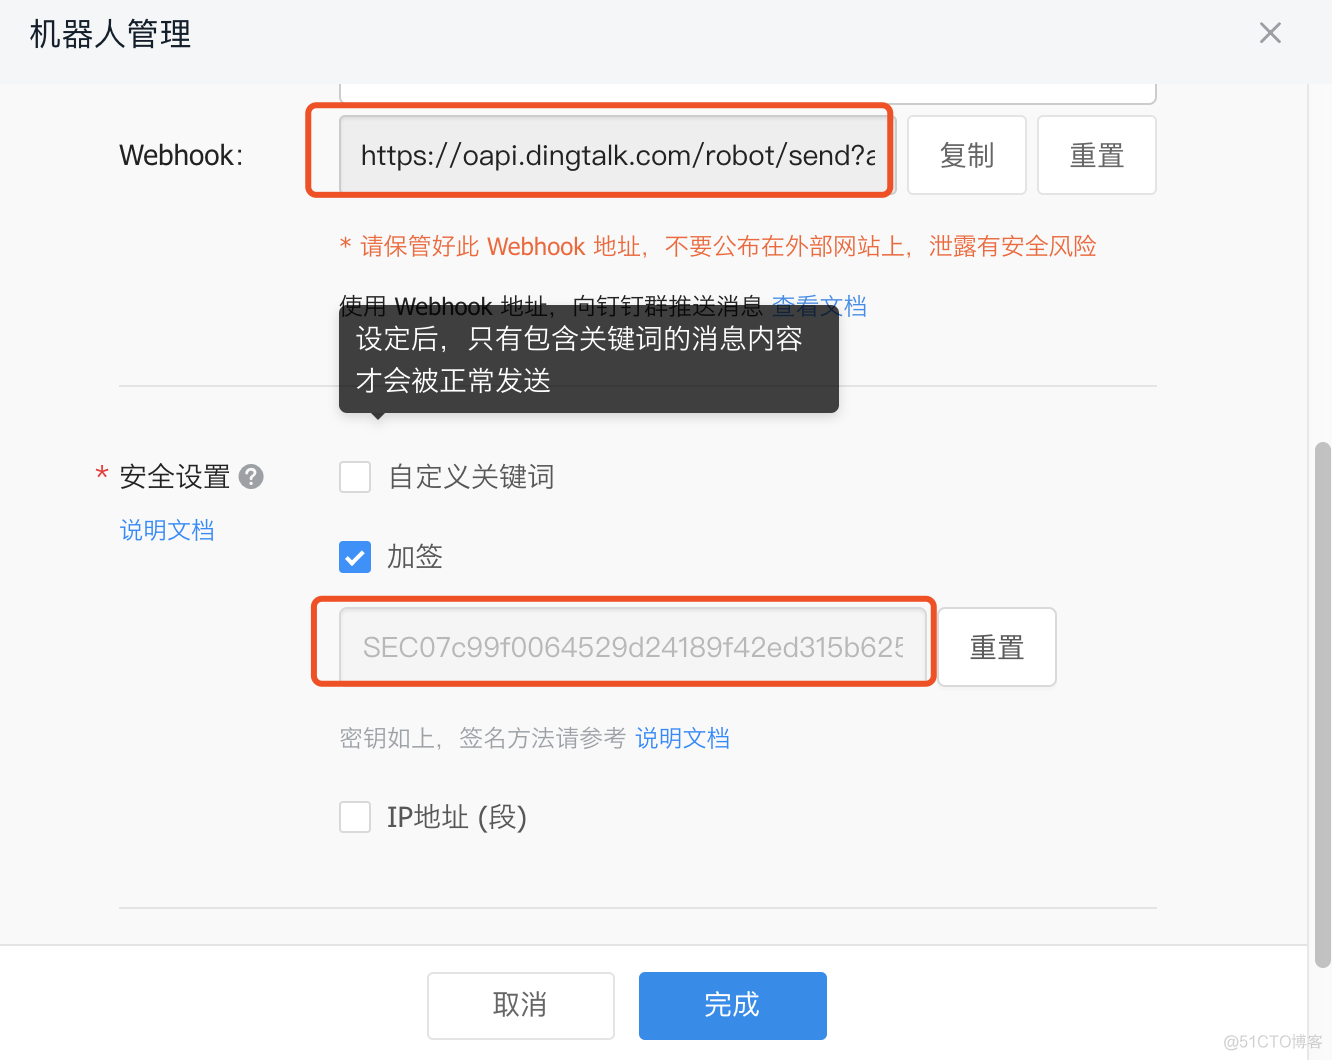
打开钉钉--群设置--群助力管理

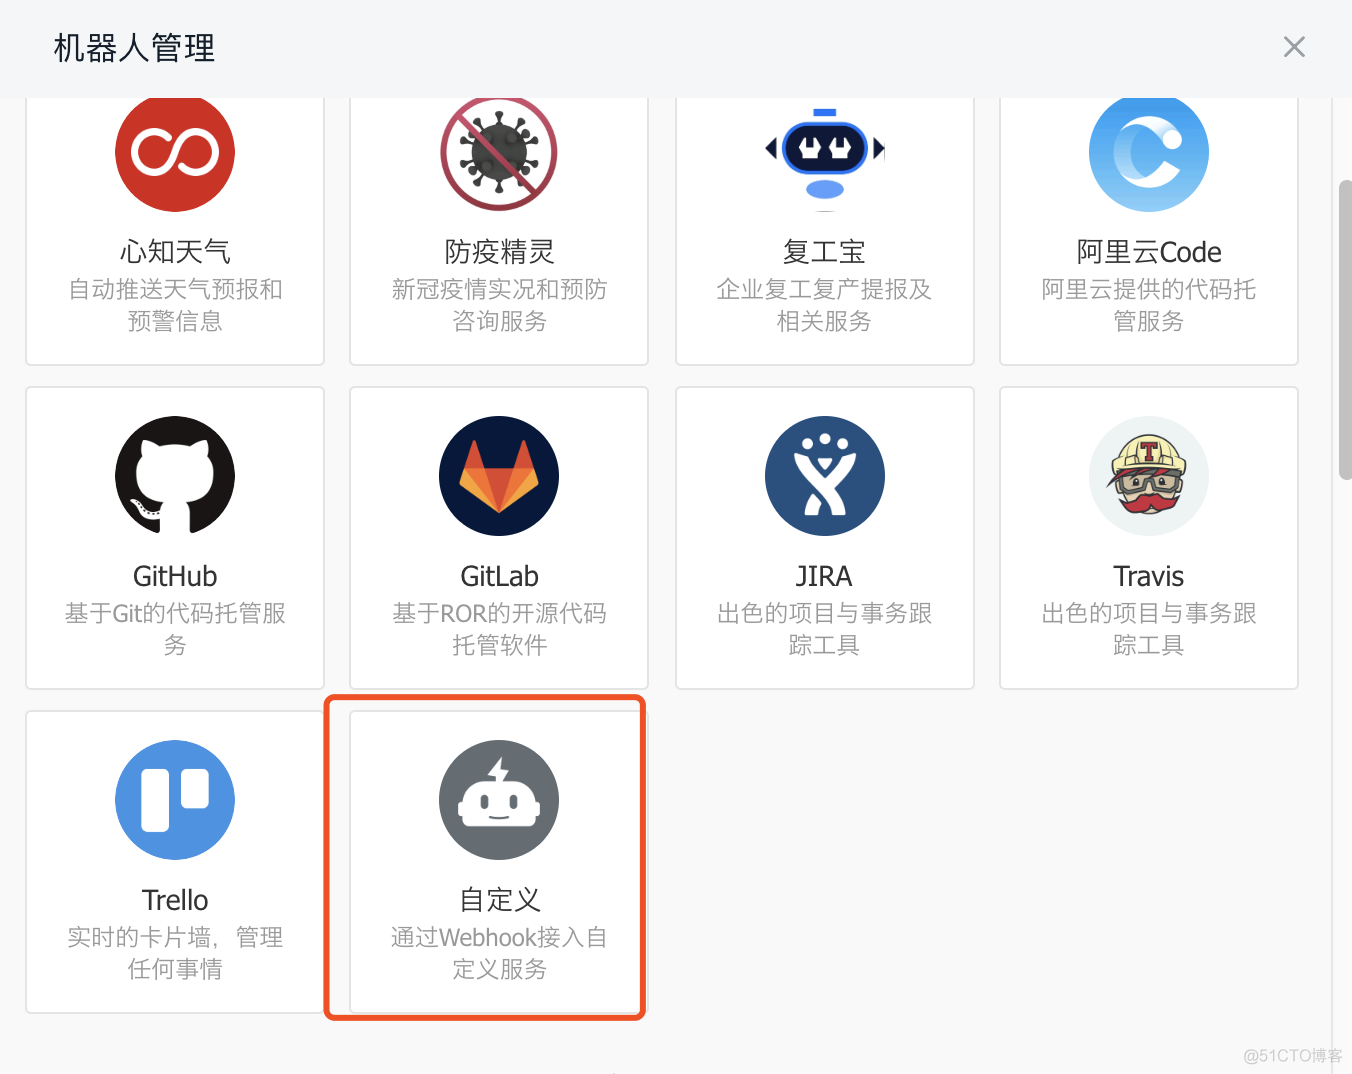
需要将图中两个地址复制下来,后面需要用到
下载安装alertmanager
https://prometheus.io/download/
安装alertmanager
tar xf alertmanager-0.21.0.linux-amd64.tar.gz -d /workspace/ cd /workspace/alertmanager-0.21.0.linux-amd64/修改配置文件
vim alertmanager.yml global: resolve_timeout: 5m route: group_by: ['alertname', 'severity', 'namespace'] group_wait: 10s group_interval: 10s repeat_interval: 10s receiver: 'dingding.webhook1' routes: - receiver: 'dingding.webhook1' match: team: DevOps group_wait: 10s group_interval: 15s repeat_interval: 3h - receiver: 'dingding.webhook.all' match: team: SRE group_wait: 10s group_interval: 15s repeat_interval: 3h receivers: - name: 'dingding.webhook1' webhook_configs: - url: 'http://10.9.5.71:8060/dingtalk/webhook1/send' send_resolved: true - name: 'dingding.webhook.all' webhook_configs: - url: 'http://10.9.5.71:8060/dingtalk/webhook_mention_all/send' send_resolved: true启动alertmanager
nohup ./alertmanager > /dev/null 2>&1 &到prometherus目录下创建报警规则文件
cd /workspace/prometheus/alert_rules vim node-alert.yaml groups: - name: hostStatsAlert rules: - alert: InstanceDown expr: up == 0 for: 1m labels: severity: page annotations: summary: "Instance {{$labels.instance}} down" description: "{{$labels.instance}} of job {{$labels.job}} has been down for more than 5 minutes." - alert: hostCpuUsageAlert expr: sum(avg without (cpu)(irate(node_cpu{mode!='idle'}[5m]))) by (instance) > 0.85 for: 1m labels: severity: page annotations: summary: "Instance {{ $labels.instance }} CPU usgae high" description: "{{ $labels.instance }} CPU usage above 85% (current value: {{ $value }})" - alert: hostMemUsageAlert expr: (node_memory_MemTotal - node_memory_MemAvailable)/node_memory_MemTotal > 0.85 for: 1m labels: severity: page annotations: summary: "Instance {{ $labels.instance }} MEM usgae high" description: "{{ $labels.instance }} MEM usage above 85% (current value: {{ $value }})"创建 plusar告警规则文件
cd /workspace/prometheus/alert_rules vim plusar.yaml groups: - name: node rules: - alert: InstanceDown expr: up == 0 for: 1m labels: status: danger annotations: summary: "Instance {{ $labels.instance }} down." description: "{{ $labels.instance }} of job {{ $labels.job }} has been down for more than 1 minutes." - alert: HighCpuUsage expr: (avg(irate(node_cpu_seconds_total{mode="idle"}[5m])) by (instance)) > 60 for: 1m labels: status: warning annotations: summary: "High cpu usage." description: "High cpu usage on instance {{ $labels.instance }} of job {{ $labels.job }} over than 60%, current value is {{ $value }}" - alert: HighIOUtils expr: irate(node_disk_io_time_seconds_total[1m]) > 0.6 for: 1m labels: status: warning annotations: summary: "High IO utils." description: "High IO utils on instance {{ $labels.instance }} of job {{ $labels.job }} over than 60%, current value is {{ $value }}%" - alert: HighDiskUsage expr: (node_filesystem_size_bytes - node_filesystem_avail_bytes) / node_filesystem_size_bytes > 0.8 for: 1m labels: status: warning annotations: summary: "High disk usage" description: "High IO utils on instance {{ $labels.instance }} of job {{ $labels.job }} over than 60%, current value is {{ $value }}%" - alert: HighInboundNetwork expr: rate(node_network_receive_bytes_total{instance="$instance", device!="lo"}[5s]) or irate(node_network_receive_bytes_total{instance="$instance", device!="lo"}[5m]) / 1024 / 1024 > 512 for: 1m labels: status: warning annotations: summary: "High inbound network" description: "High inbound network on instance {{ $labels.instance }} of job {{ $labels.job }} over than 512MB/s, current value is {{ $value }}/s" - name: zookeeper rules: - alert: HighWatchers expr: zookeeper_server_watches_count{job="zookeeper"} > 1000000 for: 30s labels: status: warning annotations: summary: "Watchers of Zookeeper server is over than 1000k." description: "Watchers of Zookeeper server {{ $labels.instance }} is over than 1000k, current value is {{ $value }}." - alert: HighEphemerals expr: zookeeper_server_ephemerals_count{job="zookeeper"} > 10000 for: 30s labels: status: warning annotations: summary: "Ephemeral nodes of Zookeeper server is over than 10k." description: "Ephemeral nodes of Zookeeper server {{ $labels.instance }} is over than 10k, current value is {{ $value }}." - alert: HighConnections expr: zookeeper_server_connections{job="zookeeper"} > 10000 for: 30s labels: status: warning annotations: summary: "Connections of Zookeeper server is over than 10k." description: "Connections of Zookeeper server {{ $labels.instance }} is over than 10k, current value is {{ $value }}." - alert: HighDataSize expr: zookeeper_server_data_size_bytes{job="zookeeper"} > 107374182400 for: 30s labels: status: warning annotations: summary: "Data size of Zookeeper server is over than 100TB." description: "Data size of Zookeeper server {{ $labels.instance }} is over than 100TB, current value is {{ $value }}." - alert: HighRequestThroughput expr: sum(irate(zookeeper_server_requests{job="zookeeper"}[30s])) by (type) > 1000 for: 30s labels: status: warning annotations: summary: "Request throughput on Zookeeper server is over than 1000 in 30 seconds." description: "Request throughput of {{ $labels.type}} on Zookeeper server {{ $labels.instance }} is over than 1k, current value is {{ $value }}." - alert: HighRequestLatency expr: zookeeper_server_requests_latency_ms{job="zookeeper", quantile="0.99"} > 100 for: 30s labels: status: warning annotations: summary: "Request latency on Zookeeper server is over than 100ms." description: "Request latency {{ $labels.type }} in p99 on Zookeeper server {{ $labels.instance }} is over than 100ms, current value is {{ $value }} ms." - name: bookie rules: - alert: HighEntryAddLatency expr: bookkeeper_server_ADD_ENTRY_REQUEST{job="bookie", quantile="0.99", success="true"} > 100 for: 30s labels: status: warning annotations: summary: "Entry add latency is over than 100ms" description: "Entry add latency on bookie {{ $labels.instance }} is over than 100ms, current value is {{ $value }}." - alert: HighEntryReadLatency expr: bookkeeper_server_READ_ENTRY_REQUEST{job="bookie", quantile="0.99", success="true"} > 1000 for: 30s labels: status: warning annotations: summary: "Entry read latency is over than 1s" description: "Entry read latency on bookie {{ $labels.instance }} is over than 1s, current value is {{ $value }}." - name: broker rules: - alert: StorageWriteLatencyOverflow expr: pulsar_storage_write_latency{job="broker"} > 1000 for: 30s labels: status: danger annotations: summary: "Topic write data to storage latency overflow is more than 1000." description: "Topic {{ $labels.topic }} is more than 1000 messages write to storage latency overflow , current value is {{ $value }}." - alert: TooManyTopics expr: sum(pulsar_topics_count{job="broker"}) by (cluster) > 1000000 for: 30s labels: status: warning annotations: summary: "Topic count are over than 1000000." description: "Topic count in cluster {{ $labels.cluster }} is more than 1000000 , current value is {{ $value }}." - alert: TooManyProducersOnTopic expr: pulsar_producers_count > 10000 for: 30s labels: status: warning annotations: summary: "Producers on topic are more than 10000." description: "Producers on topic {{ $labels.topic }} is more than 10000 , current value is {{ $value }}." - alert: TooManySubscriptionsOnTopic expr: pulsar_subscriptions_count > 100 for: 30s labels: status: warning annotations: summary: "Subscriptions on topic are more than 100." description: "Subscriptions on topic {{ $labels.topic }} is more than 100 , current value is {{ $value }}." - alert: TooManyConsumersOnTopic expr: pulsar_consumers_count > 10000 for: 30s labels: status: warning annotations: summary: "Consumers on topic are more than 10000." description: "Consumers on topic {{ $labels.topic }} is more than 10000 , current value is {{ $value }}." - alert: TooManyBacklogsOnTopic expr: pulsar_msg_backlog > 50000 for: 30s labels: status: warning annotations: summary: "Backlogs of topic are more than 50000." description: "Backlogs of topic {{ $labels.topic }} is more than 50000 , current value is {{ $value }}." - alert: TooManyGeoBacklogsOnTopic expr: pulsar_replication_backlog > 50000 for: 30s labels: status: warning annotations: summary: "Geo backlogs of topic are more than 50000." description: "Geo backlogs of topic {{ $labels.topic }} is more than 50000, current value is {{ $value }}."重启prometheus
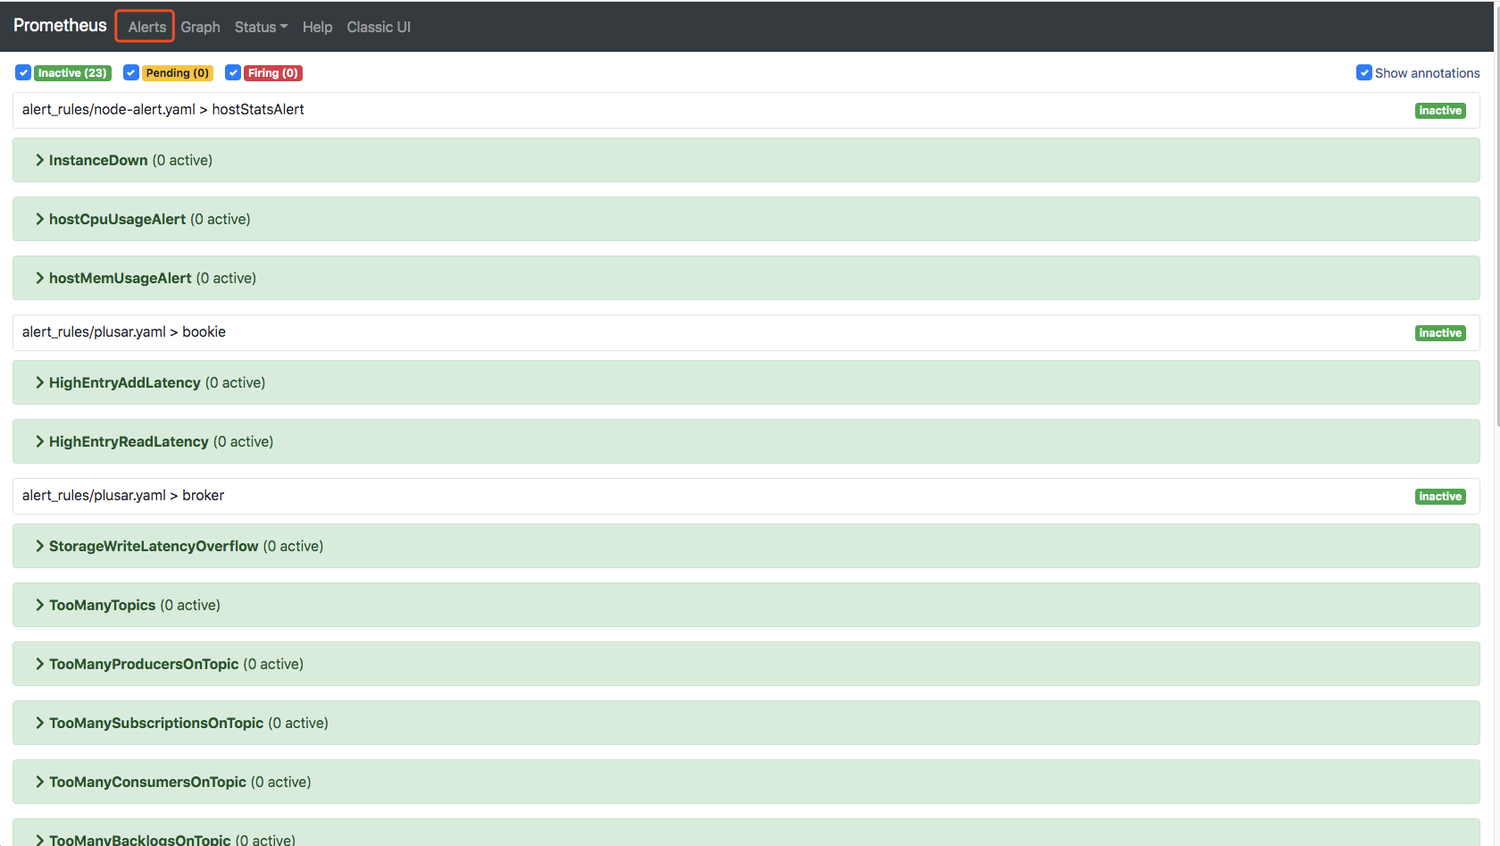
nohup ./prometheus --config.file="prometheus.yml" > /dev/null 2>&1 &登陆prometheus查看alertmanager
下载钉钉插件
https://github.com/timonwong/prometheus-webhook-dingtalk/releases安装钉钉webhook
tar xf prometheus-webhook-dingtalk-1.4.0.linux-amd64.tar.gz -d /workspace/ cd /workspace/prometheus-webhook-dingtalk-1.4.0.linux-amd64/修改配信息
vim config.yml ## Request timeout timeout: 5s ## Customizable templates path templates: - contrib/templates/legacy/template.tmpl ## You can also override default template using `default_message` ## The following example to use the 'legacy' template from v0.3.0 default_message: title: '{{ template "legacy.title" . }}' text: '{{ template "legacy.content" . }}' #告警模板 ##Targets, previously was known as "profiles" targets: webhook1: #钉钉机器人的地址 url: https://oapi.dingtalk.com/robot/send?access_token=0984thjkl36fd6c60eb6de6d0a0d50432df175bc38beb544d75b704e360b5fee #secret for signature #机器人标签 secret: SEC07c9120064529d241891452e315b6258ed159053da681d79f21xxdbe93axxexx webhook_mention_all: url: https://oapi.dingtalk.com/robot/send?access_token=0984thjkl36fd6c60eb6de6d0a0d50432df175bc38beb544d75b704e360b5fee secret: SEC07c9120064529d241891452e315b6258ed159053da681d79f21xxdbe93axxexx mention: all: true webhook_mention_users: url: https://oapi.dingtalk.com/robot/send?access_token=0984thjkl36fd6c60eb6de6d0a0d50432df175bc38beb544d75b704e360b5fee mobiles: ['18618666666']启动钉钉webhook
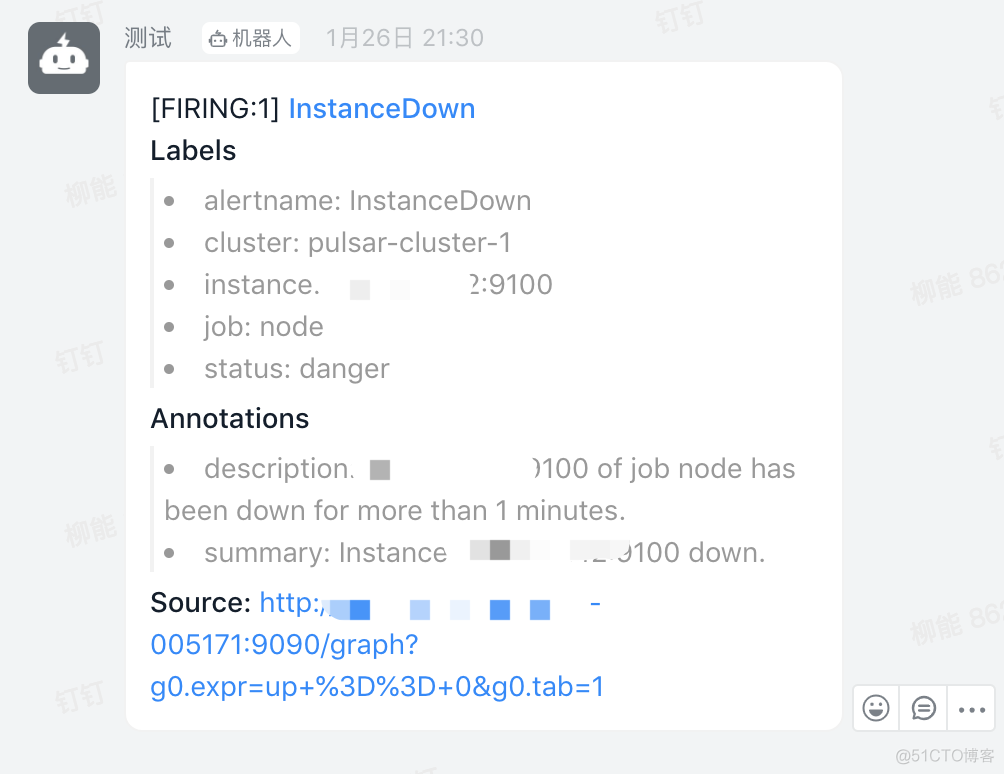
把任意一个节点的node_exporter关闭,钉钉群里就能收到机器发出的告警

将node_exporter启动,同样也能收到钉钉机器发来的告警

plusar告警也同样生效
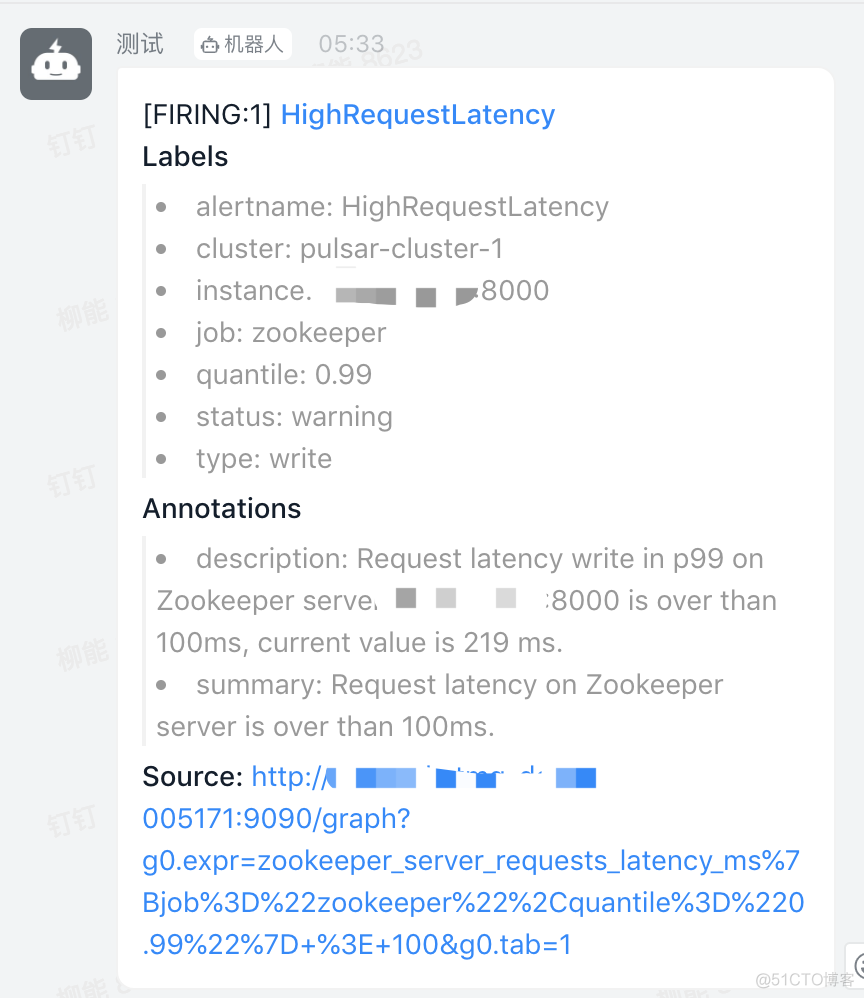
恢复故障后,也同样收到故障恢复告警

