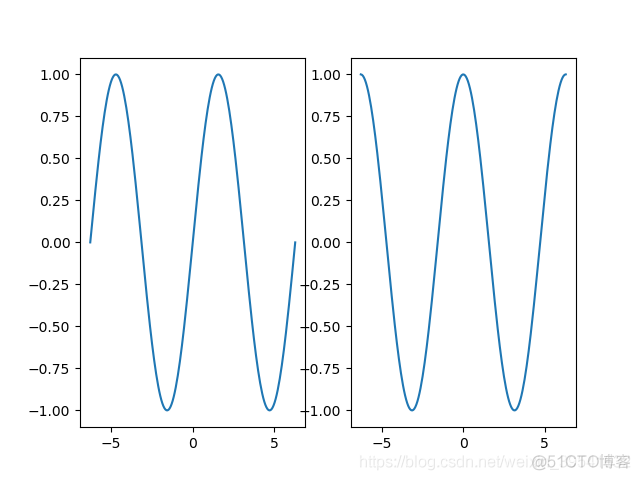
import matplotlib as mpl import matplotlib . pyplot as plt import numpy as np 函数subplot()的使用 def no1 (): """ 函数subplot()的使用 :return: """ x = np . linspace ( - 2 * np . pi , 2 * np . pi , 200 ) y = np . sin ( x ) y1 = np
import matplotlib.pyplot as plt
import numpy as np
"""
函数subplot()的使用
:return:
"""
x = np.linspace(-2 * np.pi, 2 * np.pi, 200)
y = np.sin(x)
y1 = np.cos(x)
# subplot(C, R, P) 共C行R列个划分,第P个子区域
plt.subplot(121)
plt.plot(x, y)
plt.subplot(122)
plt.plot(x, y1)
plt.savefig(r"E:\Programmer\PYTHON\Matplotlib实践\figure\Figure(Unit "
r"6)\no1.png")
plt.show()
"""
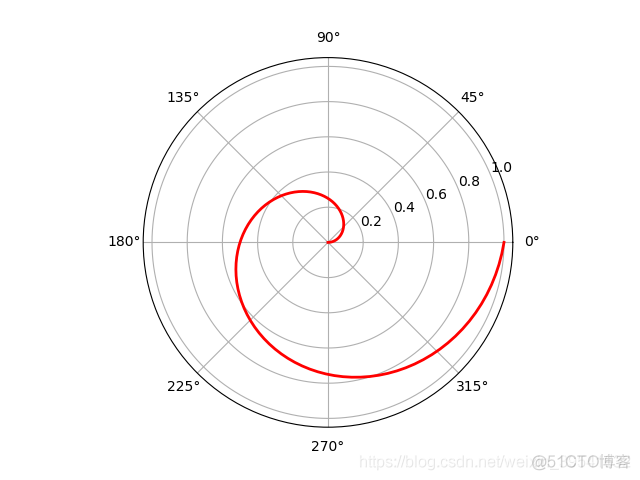
在极坐标轴上绘制折线图
:return:
"""
radii = np.linspace(0, 1, 100)
theta = 2 * np.pi * radii
ax = plt.subplot(111, polar=True)
ax.plot(theta, radii, color='r', linestyle='-', linewidth=2)
plt.savefig(r"E:\Programmer\PYTHON\Matplotlib实践\figure\Figure(Unit "
r"6)\no2.png")
plt.show()
"""
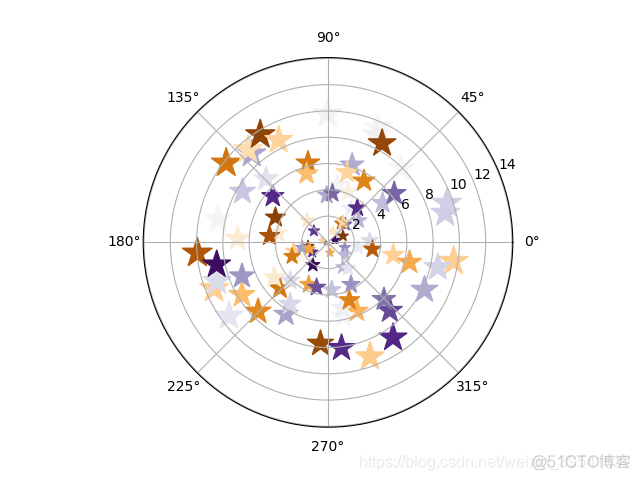
在极坐标轴上绘制散点图
:return:
"""
radii = 10 * np.random.rand(100)
theta = 2 * np.pi * np.random.rand(100)
colors = np.random.rand(100)
size = 50 * radii
ax = plt.subplot(111, polar=True)
ax.scatter(theta, radii, s=size, c=colors, cmap=mpl.cm.PuOr, marker='*')
plt.savefig(r"E:\Programmer\PYTHON\Matplotlib实践\figure\Figure(Unit "
r"6)\no3.png")
plt.show()
"""
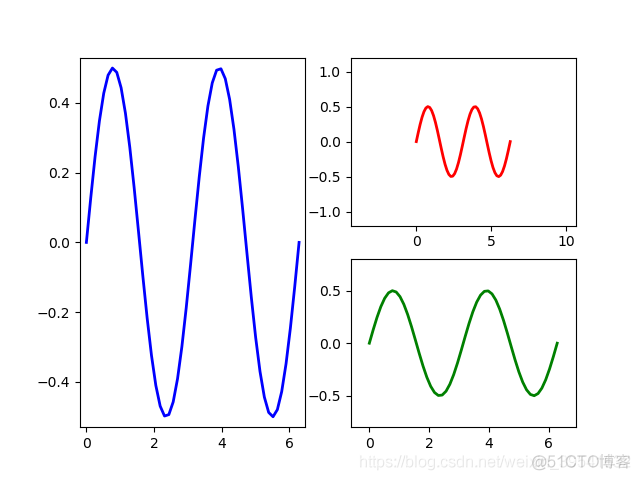
在非等分画布的绘图区域上实现图形展示
:return:
"""
fig = plt.figure()
x = np.linspace(0.0, 2 * np.pi)
y = np.cos(x) * np.sin(x)
ax1 = fig.add_subplot(121)
ax1.margins(0.03)
ax1.plot(x, y, ls='-', lw=2, color='b')
ax2 = fig.add_subplot(222)
ax2.margins(0.7, 0.7)
ax2.plot(x, y, ls='-', lw=2, color='r')
ax3 = fig.add_subplot(224)
ax3.margins(x=0.1, y=0.3)
ax3.plot(x, y, ls='-', lw=2, color='g')
plt.savefig(r"E:\Programmer\PYTHON\Matplotlib实践\figure\Figure(Unit "
r"6)\no4.png")
plt.show()
"""
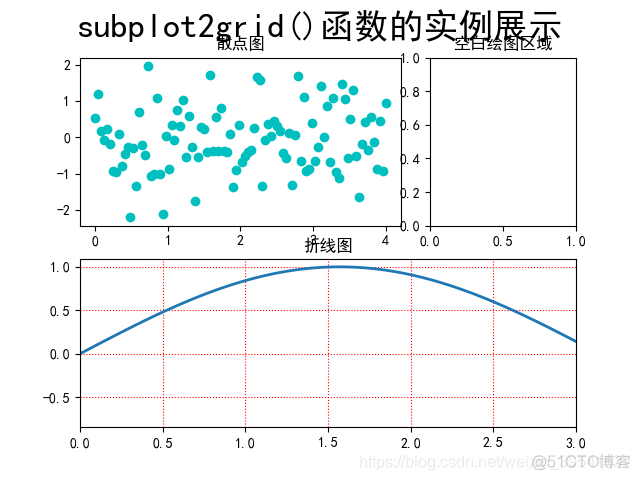
让子区跨越固定的网格布局
:return:
"""
mpl.rcParams["font.sans-serif"] = ["SimHei"]
mpl.rcParams["axes.unicode_minus"] = False
plt.subplot2grid((2, 3), (0, 0), colspan=2)
x = np.linspace(0.0, 4.0, 100)
y = np.random.randn(100)
plt.scatter(x, y, c='c')
plt.title('散点图')
plt.subplot(233)
plt.subplot2grid((2, 3), (0, 2))
plt.title('空白绘图区域')
plt.subplot2grid((2, 3), (1, 0), colspan=3)
x = np.linspace(0.0, 4.0, 100)
y1 = np.sin(x)
plt.plot(x, y1, lw=2, ls='-')
plt.xlim(0, 3)
plt.grid(True, ls=":", c='r')
plt.title('折线图')
plt.suptitle("subplot2grid()函数的实例展示", fontsize=25)
plt.savefig(r"E:\Programmer\PYTHON\Matplotlib实践\figure\Figure(Unit "
r"6)\no5.png")
plt.show()
"""
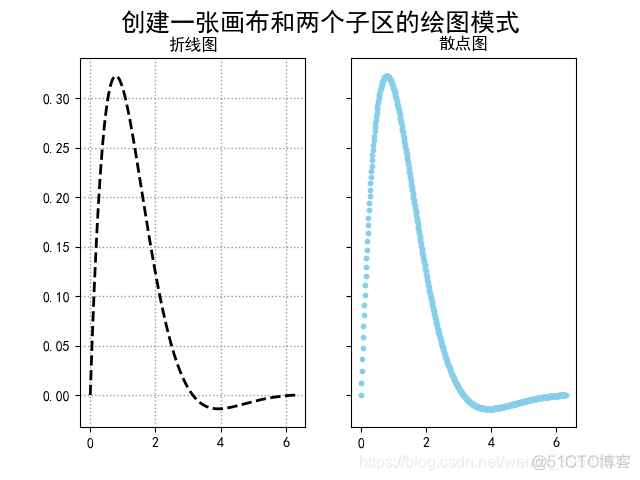
创建一张画布和两个子区的绘图模式
:return:
"""
mpl.rcParams["font.sans-serif"] = ["SimHei"]
mpl.rcParams["axes.unicode_minus"] = False
font_style = dict(fontsize=18, weight="black")
x = np.linspace(0, 2 * np.pi, 500)
y = np.sin(x) * np.exp(-x)
fig, ax = plt.subplots(1, 2, sharey=True)
ax1 = ax[0]
ax1.plot(x, y, 'k--', lw=2)
ax1.set_title('折线图')
ax1.grid(ls=':', lw=1, color='gray', alpha=0.8)
ax2 = ax[1]
ax2.scatter(x, y, s=10, c='skyblue', marker='o')
ax2.set_title('散点图')
plt.suptitle("创建一张画布和两个子区的绘图模式", **font_style)
plt.savefig(r"E:\Programmer\PYTHON\Matplotlib实践\figure\Figure(Unit "
r"6)\no6.png")
plt.show()
"""
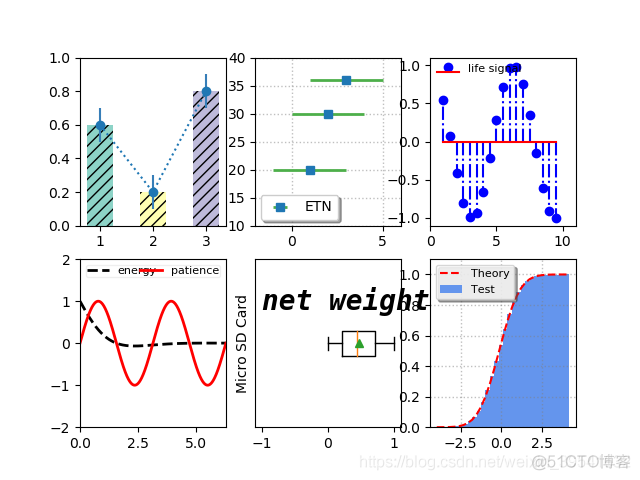
多种统计图形的组合展示
:return:
"""
fig, ax = plt.subplots(2, 3)
colors = ['#8dd3c7', '#ffffb3', '#bebada']
ax[0, 0].bar([1, 2, 3], [0.6, 0.2, 0.8], color=colors,
width=0.5, hatch='///', align='center')
ax[0, 0].errorbar([1, 2, 3], [0.6, 0.2, 0.8], yerr=0.1, capsize=0,
ecolor='#377eb8', fmt='o:')
ax[0, 0].set_ylim(0, 1.0)
ax[0, 1].errorbar([1, 2, 3], [20, 30, 36], xerr=2, elinewidth=2,
ecolor='#4daf4a', fmt='s', label='ETN')
ax[0, 1].legend(loc=3, fancybox=True, shadow=True, fontsize=10,
borderaxespad=0.4)
ax[0, 1].set_ylim(10, 40)
ax[0, 1].set_xlim(-2, 6)
ax[0, 1].grid(ls=':', lw=1, color='gray', alpha=0.5)
x3 = np.arange(1, 10, 0.5)
y3 = np.cos(x3)
ax[0, 2].stem(x3, y3, basefmt='r-', linefmt='b-.', markerfmt='bo',
label='life signal')
ax[0, 2].legend(loc=2, frameon=False, borderpad=0.0, fontsize=8,
borderaxespad=0.6)
ax[0, 2].set_ylim(-1.1, 1.1)
ax[0, 2].set_xlim(0, 11)
x4 = np.linspace(0, 2 * np.pi, 500)
x4_1 = np.linspace(0, 2 * np.pi, 1000)
y4 = np.cos(x4) * np.exp(-x4)
y4_1 = np.sin(2 * x4_1)
line1, line2 = ax[1, 0].plot(x4, y4, "k--", x4_1, y4_1, 'r-', lw=2)
ax[1, 0].legend((line1, line2), ('energy', 'patience'), loc='upper '
'center', fontsize=8, ncol=2, framealpha=0.3, mode='expand',
columnspacing=2, borderpad=0.1)
ax[1, 0].set_ylim(-2, 2)
ax[1, 0].set_xlim(0, 2 * np.pi)
x5 = np.random.rand(100)
ax[1, 1].boxplot(x5, vert=False, showmeans=True, meanprops=dict(color='g'))
ax[1, 1].set_yticks([])
ax[1, 1].set_xlim(-1.1, 1.1)
ax[1, 1].set_ylabel('Micro SD Card')
ax[1, 1].text(-1.0, 1.2, 'net weight', fontsize=20, style='italic',
weight='black', family='monospace')
mu = 0.0
sigma = 1.0
x6 = np.random.randn(10000)
n, bins, patches = ax[1, 2].hist(x6, bins=30, histtype='stepfilled',
cumulative=True, normed=True,
color='cornflowerblue', label='Test')
y = ((1 / (np.sqrt(2 * np.pi) * sigma)) *
np.exp(-0.5 * (1 / sigma * (bins - mu))**2))
y = y.cumsum()
y /= y[-1]
ax[1, 2].plot(bins, y, 'r--', linewidth=1.5, label='Theory')
ax[1, 2].set_ylim(0.0, 1.1)
ax[1, 2].grid(ls=":", lw=1, color='gray', alpha=0.5)
ax[1, 2].legend(loc='upper left', fontsize=8, shadow=True, fancybox=True,
framealpha=0.8)
plt.subplots_adjust()
plt.savefig(r"E:\Programmer\PYTHON\Matplotlib实践\figure\Figure(Unit "
r"6)\no7.png")
plt.show()
- 本篇博文特别感谢刘大成的《Python数据可视化之matplotlib实践》
