import matplotlib as mpl import matplotlib . pyplot as plt import numpy as np 堆积柱状图 def no1 (): """ 堆积柱状图 :return: """ mpl . rcParams [ "font.sans-serif" ] = [ "SimHei" ] mpl . rcParams [ "axes.unicode_minus" ] = False x
import matplotlib.pyplot as plt
import numpy as np
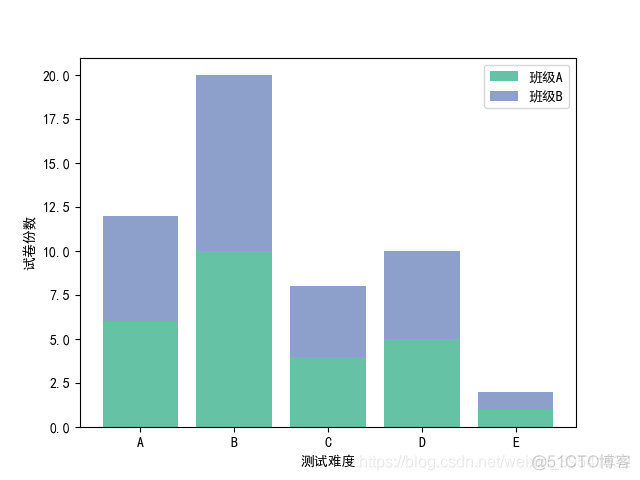
"""
堆积柱状图
:return:
"""
mpl.rcParams["font.sans-serif"] = ["SimHei"]
mpl.rcParams["axes.unicode_minus"] = False
x = [1, 2, 3, 4, 5]
y = [6, 10, 4, 5, 1]
y1 = [2, 6, 3, 8, 5]
plt.bar(
x,
y,
align="center",
color="#66c2a5",
tick_label=[
'A',
'B',
'C',
'D',
'E'],
label="班级A")
plt.bar(x, y1, align="center", bottom=y, color="#8da0cb",
tick_label=['A', 'B', 'C', 'D',
'E'], label="班级B")
plt.xlabel("测试难度")
plt.ylabel("试卷份数")
plt.legend()
plt.savefig(r"E:\Programmer\PYTHON\Matplotlib实践\figure\Figure(Unit "
r"3)\no1.png")
plt.show()
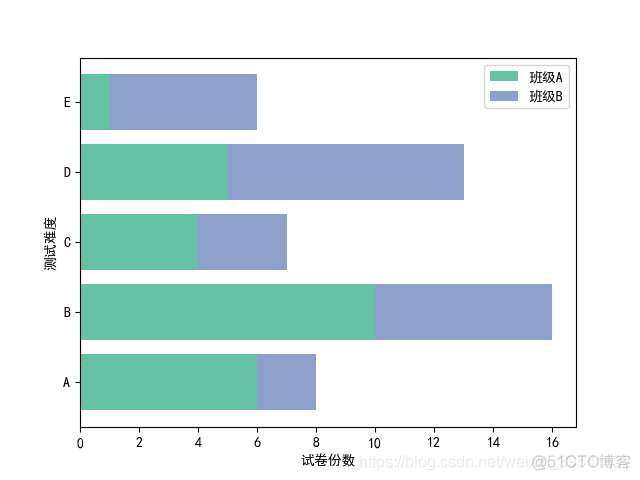
"""
堆积条形图
:return:
"""
mpl.rcParams["font.sans-serif"] = ["SimHei"]
mpl.rcParams["axes.unicode_minus"] = False
x = [1, 2, 3, 4, 5]
y = [6, 10, 4, 5, 1]
y1 = [2, 6, 3, 8, 5]
plt.barh(
x,
y,
align="center",
color="#66c2a5",
tick_label=[
'A',
'B',
'C',
'D',
'E'],
label="班级A")
plt.barh(x, y1, align="center", left=y, color="#8da0cb",
tick_label=['A', 'B', 'C', 'D',
'E'], label="班级B")
plt.ylabel("测试难度")
plt.xlabel("试卷份数")
plt.legend()
plt.savefig(r"E:\Programmer\PYTHON\Matplotlib实践\figure\Figure(Unit "
r"3)\no2.png")
plt.show()
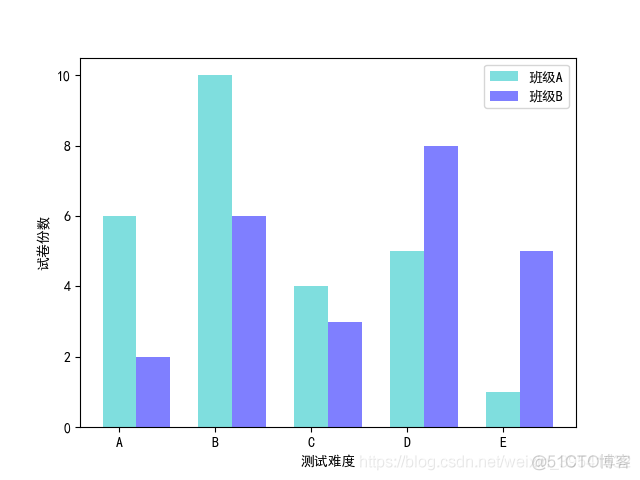
"""
多数据并列柱状图
:return:
"""
mpl.rcParams["font.sans-serif"] = ["SimHei"]
mpl.rcParams["axes.unicode_minus"] = False
x = np.arange(5)
y = [6, 10, 4, 5, 1]
y1 = [2, 6, 3, 8, 5]
bar_width = 0.35
tick_label = ['A', 'B', 'C', 'D', 'E']
plt.bar(x, y, bar_width, color='c', align='center', label='班级A', alpha=0.5)
plt.bar(x + bar_width, y1, bar_width, color='b', align='center',
label="班级B", alpha=0.5)
plt.xlabel("测试难度")
plt.ylabel("试卷份数")
plt.xticks(x + bar_width // 2, tick_label)
plt.legend()
plt.savefig(r"E:\Programmer\PYTHON\Matplotlib实践\figure\Figure(Unit "
r"3)\no3.png")
plt.show()
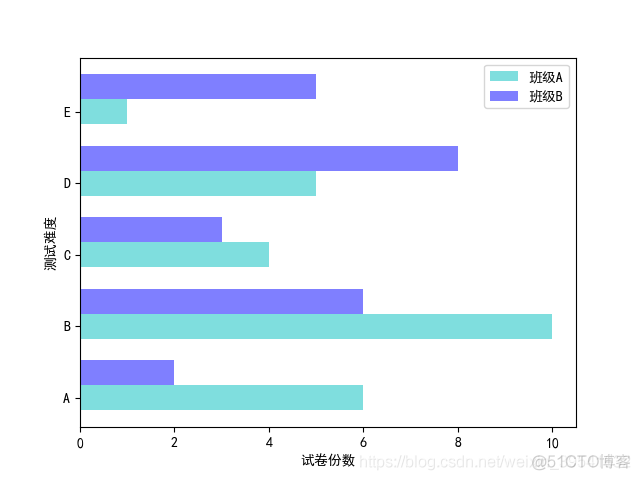
"""
多数据平行条形图
:return:
"""
mpl.rcParams["font.sans-serif"] = ["SimHei"]
mpl.rcParams["axes.unicode_minus"] = False
x = np.arange(5)
y = [6, 10, 4, 5, 1]
y1 = [2, 6, 3, 8, 5]
bar_width = 0.35
tick_label = ['A', 'B', 'C', 'D', 'E']
plt.barh(
x,
y,
bar_width,
color='c',
align='center',
label='班级A',
alpha=0.5)
plt.barh(x + bar_width, y1, bar_width, color='b', align='center',
label="班级B", alpha=0.5)
plt.ylabel("测试难度")
plt.xlabel("试卷份数")
plt.yticks(x + bar_width // 2, tick_label)
plt.legend()
plt.savefig(r"E:\Programmer\PYTHON\Matplotlib实践\figure\Figure(Unit "
r"3)\no4.png")
plt.show()
"""
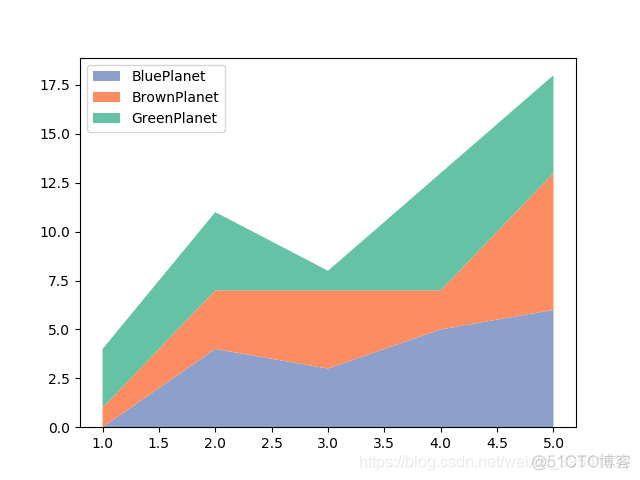
堆积折线图
:return:
"""
x = np.arange(1, 6, 1)
y = [0, 4, 3, 5, 6]
y1 = [1, 3, 4, 2, 7]
y2 = [3, 4, 1, 6, 5]
labels = ["BluePlanet", "BrownPlanet", "GreenPlanet"]
colors = ['#8da0cb', '#fc8d62', "#66c2a5"]
plt.stackplot(x, y, y1, y2, labels=labels, colors=colors)
plt.legend(loc="upper left")
plt.savefig(r"E:\Programmer\PYTHON\Matplotlib实践\figure\Figure(Unit "
r"3)\no5.png")
plt.show()
"""
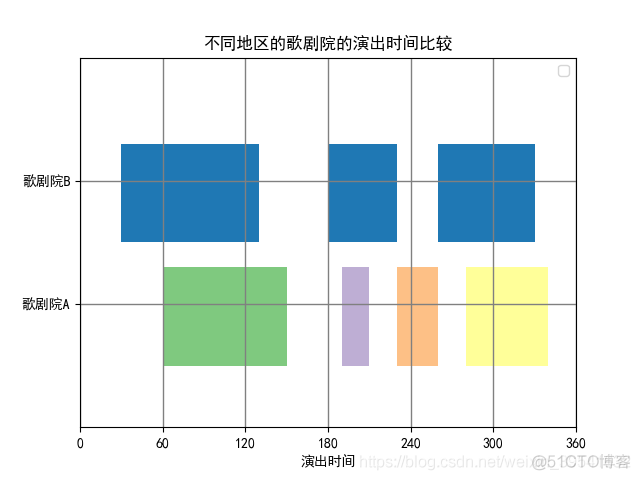
间断条形图
:return:
"""
mpl.rcParams["font.sans-serif"] = ["SimHei"]
mpl.rcParams["axes.unicode_minus"] = False
# (60,90):从x轴的数值为60的位置起,沿x轴正方向移动90个单位。
# (10, 8):从起点是y轴的数值为10的位置起,沿y轴正方向移动8个单位。
# facecolors:每个柱面的填充颜色
plt.broken_barh([(30, 100), (180, 50), (260, 70)],
(20, 8), facecolors='#1f78b4')
plt.broken_barh([(60, 90), (190, 20), (230, 30), (280, 60)], (10, 8),
facecolors=('#7fc97f', '#beaed4', '#fdc086', '#ffff99'))
plt.xlim(0, 360)
plt.ylim(5, 35)
plt.xlabel('演出时间')
plt.xticks(np.arange(0, 361, 60))
plt.yticks([15, 25], ['歌剧院A', '歌剧院B'])
plt.grid(ls='-', lw=1, color='gray')
plt.title("不同地区的歌剧院的演出时间比较")
plt.legend()
plt.savefig(r"E:\Programmer\PYTHON\Matplotlib实践\figure\Figure(Unit "
r"3)\no6.png")
plt.show()
"""
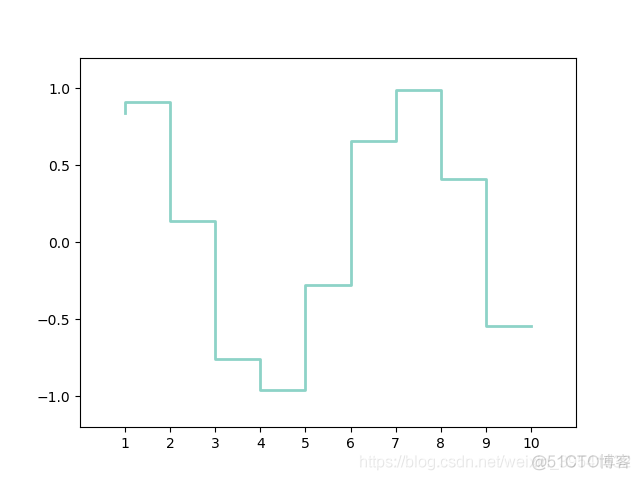
阶梯图
:return:
"""
x = np.linspace(1, 10, 10)
y = np.sin(x)
# where:默认参数是pre,表示x轴上的每个数据点对应的y轴上的数值向左侧绘制水平直线到x轴
# 上的此数据点的左侧相邻数据点为止,左开右闭数据点
# post
plt.step(x, y, color='#8dd3c7', where='pre', lw=2)
plt.xlim(0, 11)
plt.xticks(np.arange(1, 11, 1))
plt.ylim(-1.2, 1.2)
plt.savefig(r"E:\Programmer\PYTHON\Matplotlib实践\figure\Figure(Unit "
r"3)\no7.png")
plt.show()
"""
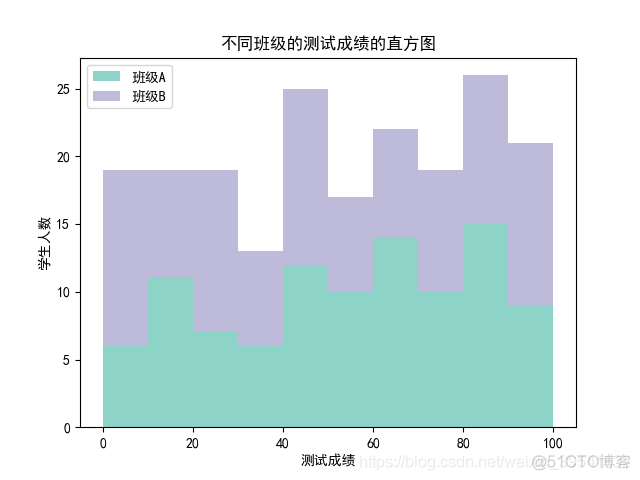
堆积直方图
:return:
"""
mpl.rcParams["font.sans-serif"] = ["SimHei"]
mpl.rcParams["axes.unicode_minus"] = False
scoreT1 = np.random.randint(1, 100, 100)
scoreT2 = np.random.randint(1, 100, 100)
x = [scoreT1, scoreT2]
colors = ['#8dd3c7', '#bebada']
labels = ['班级A', '班级B']
bins = range(0, 101, 10)
# stacked 设置为False得到并排直方图
# histtype 设置直方图形状(stepfilled:阶梯图)
plt.hist(x, bins=bins, color=colors, histtype="bar", rwidth=10,
stacked=True, label=labels)
plt.xlabel('测试成绩')
plt.ylabel("学生人数")
plt.title("不同班级的测试成绩的直方图")
plt.legend(loc='upper left')
plt.savefig(r"E:\Programmer\PYTHON\Matplotlib实践\figure\Figure(Unit "
r"3)\no8.png")
plt.show()
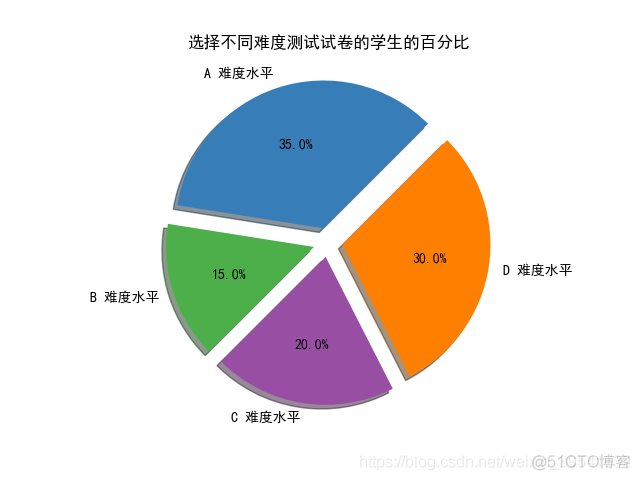
"""
饼图
:return:
"""
mpl.rcParams["font.sans-serif"] = ["SimHei"]
mpl.rcParams["axes.unicode_minus"] = False
labels = 'A 难度水平', 'B 难度水平', 'C 难度水平', 'D 难度水平'
students = [0.35, 0.15, 0.20, 0.30]
colors = ['#377eb8', '#4daf4a', '#984ea3', '#ff7f00']
explode = (0.1, 0.1, 0.1, 0.1)
# students:饼片代表的百分比
# explode:饼片边缘偏离半径的百分比
# labels:标记每份饼片的文本标签内容
# autopct: 饼片文本标签内容对应的数值百分比样式
# startangle:从x轴作为其实位置,第一个饼片逆时针旋转的角度
# shadow:是否绘制饼片的阴影
# colors: 饼片的颜色
plt.pie(students, explode=explode, labels=labels, autopct="%3.1f%%",
startangle=45, shadow=True, colors=colors)
plt.title('选择不同难度测试试卷的学生的百分比')
plt.savefig(r"E:\Programmer\PYTHON\Matplotlib实践\figure\Figure(Unit "
r"3)\no9.png")
plt.show()
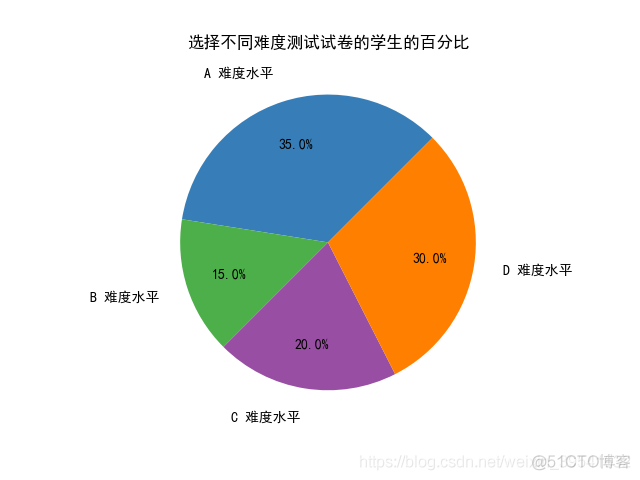
"""
非分裂式饼图
:return:
"""
mpl.rcParams["font.sans-serif"] = ["SimHei"]
mpl.rcParams["axes.unicode_minus"] = False
labels = 'A 难度水平', 'B 难度水平', 'C 难度水平', 'D 难度水平'
students = [0.35, 0.15, 0.20, 0.30]
colors = ['#377eb8', '#4daf4a', '#984ea3', '#ff7f00']
explode = (0.1, 0.1, 0.1, 0.1)
plt.pie(students, labels=labels, autopct="%3.1f%%",
startangle=45, colors=colors, pctdistance=0.7,
labeldistance=1.2)
plt.title('选择不同难度测试试卷的学生的百分比')
plt.savefig(r"E:\Programmer\PYTHON\Matplotlib实践\figure\Figure(Unit "
r"3)\no10.png")
plt.show()

"""
内嵌环形饼图
:return:
"""
mpl.rcParams["font.sans-serif"] = ["SimHei"]
mpl.rcParams["axes.unicode_minus"] = False
elements = ["面粉", '砂糖', '奶油', '草莓酱', '坚果']
weight1 = [40, 15, 20, 10, 15]
weight2 = [30, 25, 15, 20, 10]
colormapList = ["#e41a1c", '#377eb8', '#4daf4a', '#984ea3', '#ff7f00']
outer_colors = colormapList
inner_colors = colormapList
wedges1, texts1, autotexts1 = plt.pie(weight1,
autopct="%3.1f%%",
radius=1,
pctdistance=0.85,
colors=outer_colors,
textprops=dict(color='w'),
wedgeprops=dict(width=0.3,
edgecolor='w'))
wedges2, texts2, autotexts2 = plt.pie(weight2,
autopct="%3.1f%%",
radius=0.7,
pctdistance=0.75,
colors=inner_colors,
textprops=dict(color='w'),
wedgeprops=dict(width=0.3,
edgecolor='w'))
plt.legend(wedges1, elements, fontsize=12, title='配料表', loc='center left',
bbox_to_anchor=(0.91, 0, 0.3, 1))
plt.setp(autotexts1, size=15, weight='bold')
plt.setp(autotexts2, size=15, weight="bold")
plt.setp(texts1, size=12)
plt.title('不同果酱面包配料比例表的比较')
plt.savefig(r"E:\Programmer\PYTHON\Matplotlib实践\figure\Figure(Unit "
r"3)\no11.png")
plt.show()
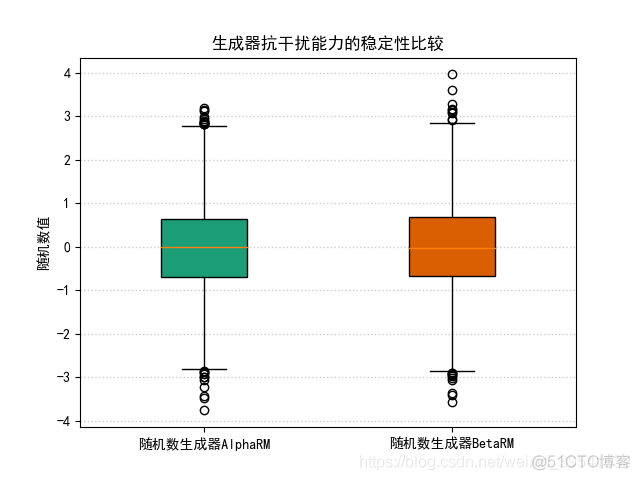
"""
多组定量数据的分布比较
:return:
"""
mpl.rcParams["font.sans-serif"] = ["SimHei"]
mpl.rcParams["axes.unicode_minus"] = False
testA = np.random.randn(5000)
testB = np.random.randn(5000)
testList = [testA, testB]
labels = ['随机数生成器AlphaRM', '随机数生成器BetaRM']
colors = ['#1b9e77', "#d95f02"]
whis = 1.6
width = 0.35
# testList 绘制箱线图的输入数据
# whis 四分位间距的倍数,用来确定箱须包含数据的范围的大小
# widths 设置箱体的宽度
# sym 离群值的标记样式
# labels 绘制每一个数据集的刻度标签
# patch_artisi 是否给箱体添加颜色
bplot = plt.boxplot(testList, whis=whis, widths=width, sym='o',
labels=labels, patch_artist=True)
for patch, color in zip(bplot["boxes"], colors):
patch.set_facecolor(color)
plt.ylabel('随机数值')
plt.title("生成器抗干扰能力的稳定性比较")
plt.grid(axis='y', ls=':', lw=1, color='gray', alpha=0.4)
plt.savefig(r"E:\Programmer\PYTHON\Matplotlib实践\figure\Figure(Unit "
r"3)\no12.png")
plt.show()

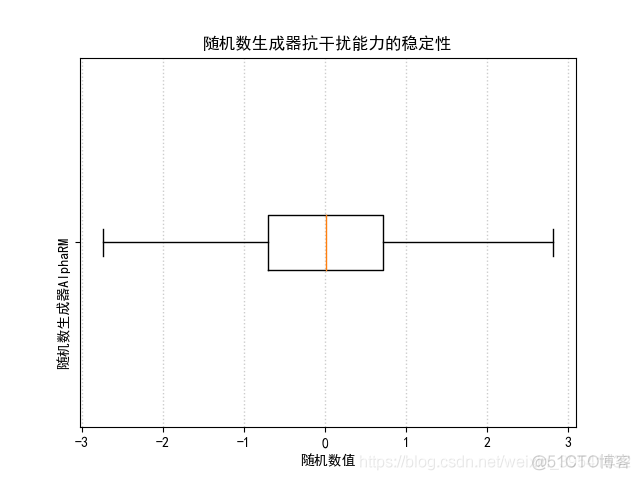
"""
水平方向的箱线图
:return:
"""
mpl.rcParams["font.sans-serif"] = ["SimHei"]
mpl.rcParams["axes.unicode_minus"] = False
x = np.random.randn(1000)
plt.boxplot(x, vert=False)
plt.xlabel('随机数值')
plt.yticks([1], ['随机数生成器AlphaRM'], rotation=90)
plt.title("随机数生成器抗干扰能力的稳定性")
plt.grid(axis='x', ls=':', lw=1, color='gray', alpha=0.4)
plt.savefig(r"E:\Programmer\PYTHON\Matplotlib实践\figure\Figure(Unit "
r"3)\no13.png")
plt.show()
"""
不绘制离群值的水平放置的箱线图
:return:
"""
mpl.rcParams["font.sans-serif"] = ["SimHei"]
mpl.rcParams["axes.unicode_minus"] = False
x = np.random.randn(1000)
plt.boxplot(x, vert=False, showfliers=False)
plt.xlabel('随机数值')
plt.yticks([1], ['随机数生成器AlphaRM'], rotation=90)
plt.title("随机数生成器抗干扰能力的稳定性")
plt.grid(axis='x', ls=':', lw=1, color='gray', alpha=0.4)
plt.savefig(r"E:\Programmer\PYTHON\Matplotlib实践\figure\Figure(Unit "
r"3)\no14.png")
plt.show()

"""
误差棒图
:return:
"""
x = np.linspace(0.1, 0.6, 10)
y = np.exp(x)
error = 0.05 + 0.15 * x
lower_error = error
upper_error = 0.3 * error
error_limit = [lower_error, upper_error]
# x, y 数据点位置
# yerr: 单一数值的非对称形式误差范围
# fmt: 数据点的标记样式和数据点标记的连接线样式
# ecolor:误差棒的线条颜色
# elinewidth:误差棒的线条粗细
# ms:数据点的标记边缘颜色
# mfc:数据点的标记颜色
# mec: 数据点的标记边缘颜色
# capthick:误差棒边界横杠的厚度
# capsize: 误差棒边界横杠的大小
plt.errorbar(x, y, yerr=error_limit, fmt=":o",
ecolor='y', elinewidth=4, ms=5,
mfc='c', mec='r', capthick=1, capsize=2)
plt.xlim(0, 0.7)
plt.savefig(r"E:\Programmer\PYTHON\Matplotlib实践\figure\Figure(Unit "
r"3)\no15.png")
plt.show()
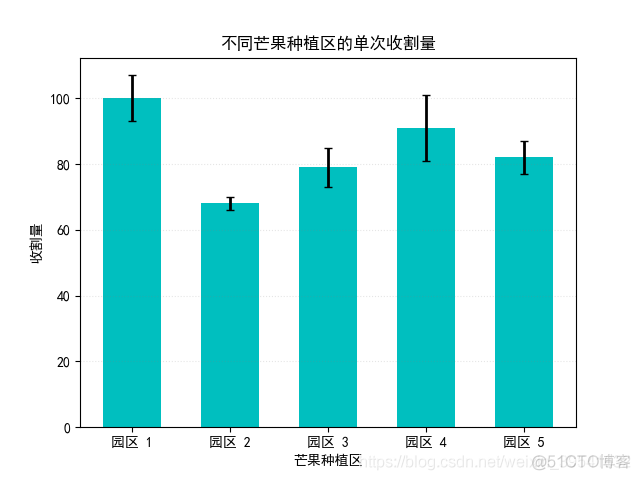
"""
带误差棒的柱状图
:return:
"""
mpl.rcParams["font.sans-serif"] = ["SimHei"]
mpl.rcParams["axes.unicode_minus"] = False
x = np.arange(5)
y = [100, 68, 79, 91, 82]
std_err = [7, 2, 6, 10, 5]
error_attri = dict(elinewidth=2, ecolor='black', capsize=3)
plt.bar(x, y,
color='c',
width=0.6,
align='center',
yerr=std_err,
error_kw=error_attri,
tick_label=["园区 1", "园区 2", "园区 3", "园区 4", "园区 5"])
plt.xlabel("芒果种植区")
plt.ylabel("收割量")
plt.title("不同芒果种植区的单次收割量")
plt.grid(True, axis='y', ls=':', color='gray', alpha=0.2)
plt.savefig(r"E:\Programmer\PYTHON\Matplotlib实践\figure\Figure(Unit "
r"3)\no16.png")
plt.show()
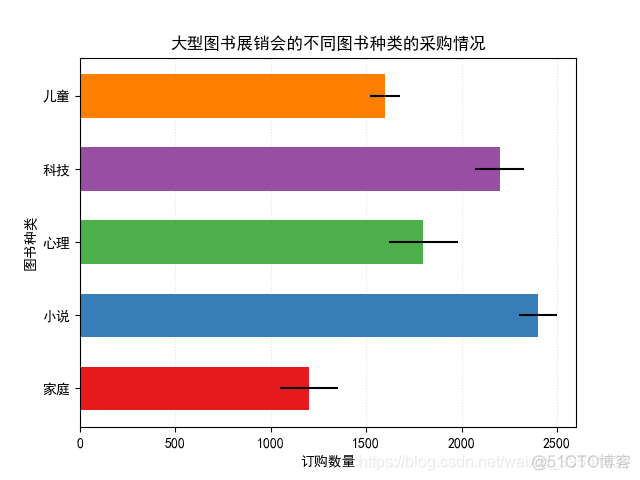
"""
绘制带误差棒的条形图
:return:
"""
mpl.rcParams["font.sans-serif"] = ["SimHei"]
mpl.rcParams["axes.unicode_minus"] = False
x = np.arange(5)
y = [1200, 2400, 1800, 2200, 1600]
std_err = [150, 100, 180, 130, 80]
bar_width = 0.6
colors = ["#e41a1c", "#377eb8", '#4daf4a', '#984ea3', '#ff7f00']
plt.barh(x, y,
bar_width,
color=colors,
align="center",
xerr=std_err,
tick_label=['家庭', '小说', '心理', '科技', '儿童'])
plt.xlabel("订购数量")
plt.ylabel("图书种类")
plt.title("大型图书展销会的不同图书种类的采购情况")
plt.grid(True, axis='x', ls=':', color='gray', alpha=0.2)
plt.xlim(0, 2600)
plt.savefig(r"E:\Programmer\PYTHON\Matplotlib实践\figure\Figure(Unit "
r"3)\no17.png")
plt.show()
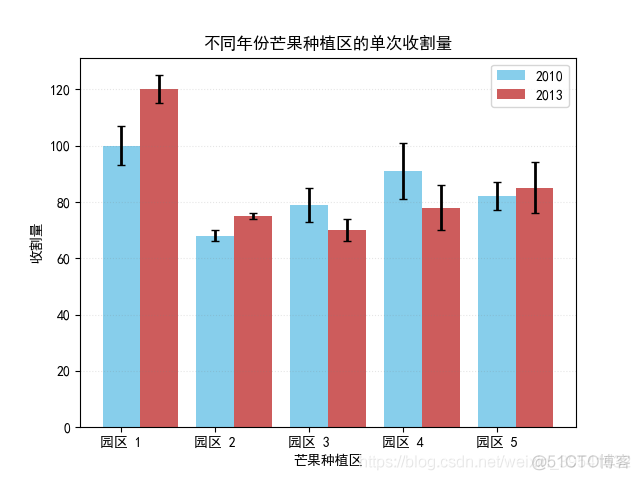
"""
带误差棒的多数据并列柱状图
:return:
"""
mpl.rcParams["font.sans-serif"] = ["SimHei"]
mpl.rcParams["axes.unicode_minus"] = False
x = np.arange(5)
y1 = [100, 68, 79, 91, 82]
y2 = [120, 75, 70, 78, 85]
std_err1 = [7, 2, 6, 10, 5]
std_err2 = [5, 1, 4, 8, 9]
error_attri = dict(elinewidth=2, ecolor='black', capsize=3)
bar_width = 0.4
tick_label = ["园区 1", "园区 2", "园区 3", "园区 4", "园区 5"]
plt.bar(x, y1,
bar_width,
color='#87CEEB',
align='center',
yerr=std_err1,
error_kw=error_attri,
label="2010")
plt.bar(x + bar_width, y2,
bar_width,
color='#CD5C5C',
align='center',
yerr=std_err2,
error_kw=error_attri,
label="2013")
plt.xlabel("芒果种植区")
plt.ylabel("收割量")
plt.xticks(x + bar_width // 2, tick_label)
plt.title("不同年份芒果种植区的单次收割量")
plt.grid(True, axis='y', ls=':', color='gray', alpha=0.2)
plt.legend()
plt.savefig(r"E:\Programmer\PYTHON\Matplotlib实践\figure\Figure(Unit "
r"3)\no18.png")
plt.show()

"""
带误差棒的堆积柱状图
:return:
"""
mpl.rcParams["font.sans-serif"] = ["SimHei"]
mpl.rcParams["axes.unicode_minus"] = False
x = np.arange(5)
y1 = [1200, 2400, 1800, 2200, 1600]
y2 = [1050, 2100, 1300, 1600, 1340]
std_err1 = [150, 100, 180, 130, 80]
std_err2 = [120, 110, 170, 150, 120]
bar_width = 0.4
tick_label = ['家庭', '小说', '心理', '科技', '儿童']
error_attri = dict(elinewidth=2, ecolor='black', capsize=0)
plt.bar(
x,
y1,
bar_width,
align="center",
color="#6495ED",
tick_label="地区 1",
error_kw=error_attri)
plt.bar(
x,
y2,
bar_width,
bottom=y1,
align="center",
color="#FFA500",
yerr=std_err2,
tick_label="地区 2",
error_kw=error_attri)
plt.xlabel("图书种类")
plt.ylabel("订购数量")
plt.title("不同地区大型图书展销会图书采购情况")
plt.grid(True, axis='y', ls=':', color='gray', alpha=0.2)
plt.xticks(x, tick_label)
plt.legend()
plt.savefig(r"E:\Programmer\PYTHON\Matplotlib实践\figure\Figure(Unit "
r"3)\no19.png")
plt.show()
- 本篇博文特别感谢刘大成的《Python数据可视化之matplotlib实践》
