本期为你们带来的文章是关于PPT的,你们晓得PPT中如何快速产生一个复杂组织架构图呢?下文就为你们带来了PPT中快速产生一个复杂组织架构图的具体操作方法。 首先在PPT中插入一个文
本期为你们带来的文章是关于PPT的,你们晓得PPT中如何快速产生一个复杂组织架构图呢?下文就为你们带来了PPT中快速产生一个复杂组织架构图的具体操作方法。

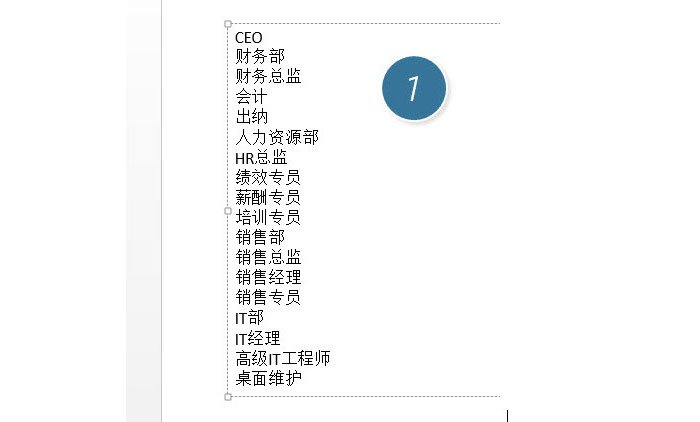
首先在PPT中插入一个文本框,并输入公司的部门或职位名称。(下图1处)
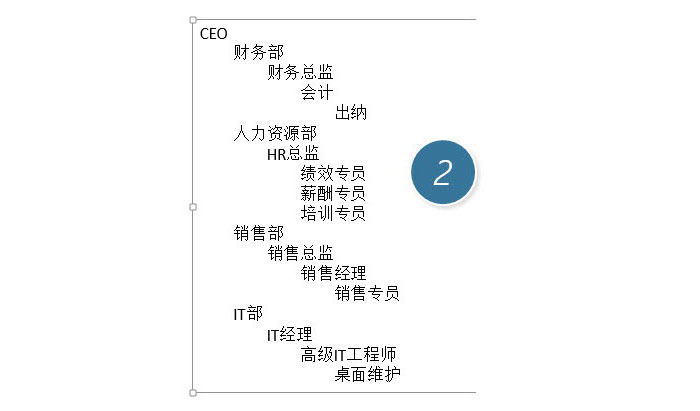
紧接着,每次单击键盘的Tab键进行“缩进”,根据公司实际的组织架构进行“缩进”设置,设置完毕后效果如下。(下图2处)
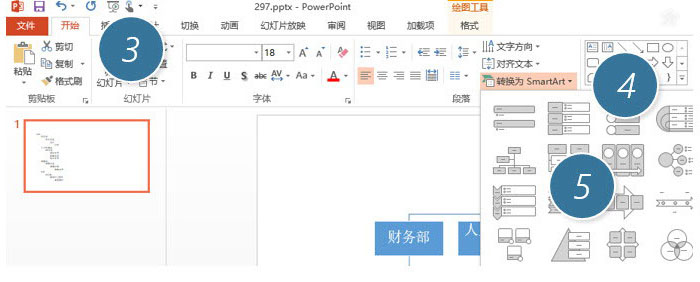
接下来关键的一步,选中上图的文本框,然后在“开始-转换为SmartArt”中选择“组织架构图”。(下图5处)
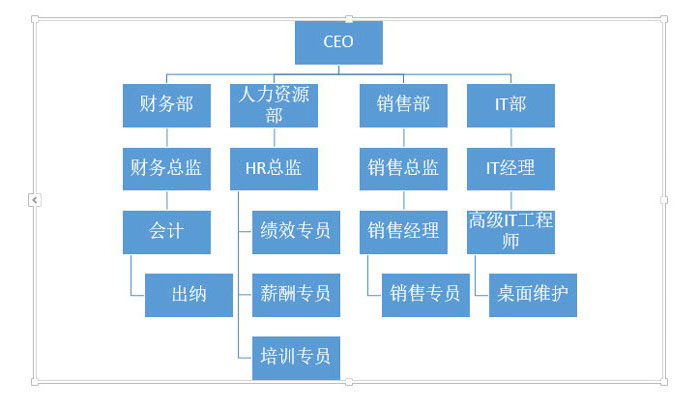
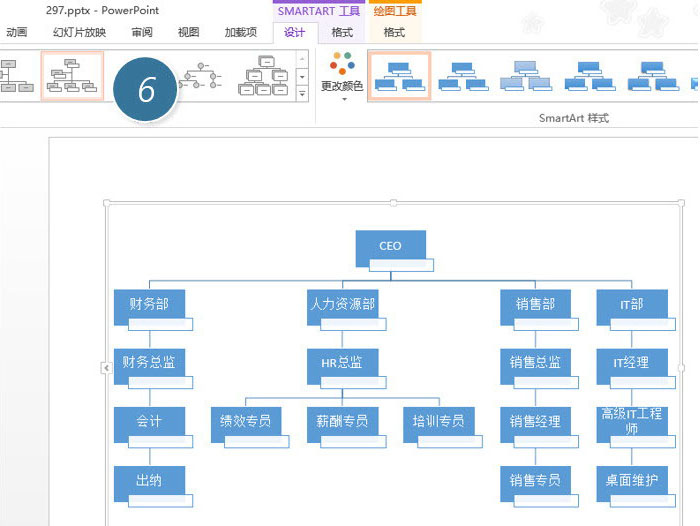
瞬间完成对复杂组织构架图的制作,如下图所示。
但似乎还不那么满意,比如第四层级,为什么连接线是歪的?,有比如“秘书”怎么放进去呢?首先来解决连接线的问题?一种方法是换一种组织架构图的表达。在SmartArt工具栏中选择下图6处的组织架构图类型。
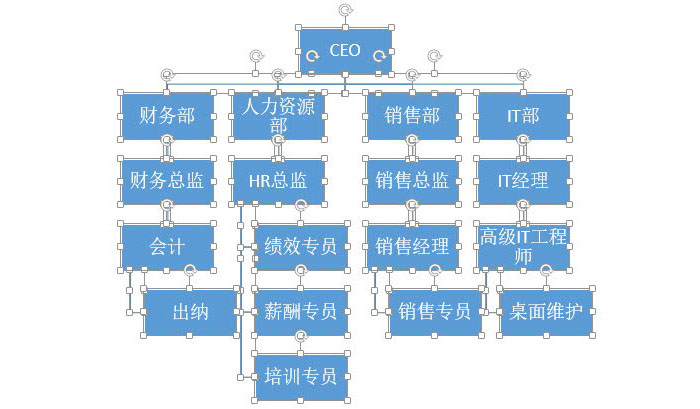
另一种方法就是把SmartArt图转换成为形状,然后自己手动微调。(下图7处)

转换完毕后,SmartArt图成为图形,如下图所示。(注意此操作不可逆转,就说不能恢复成SmartArt图)
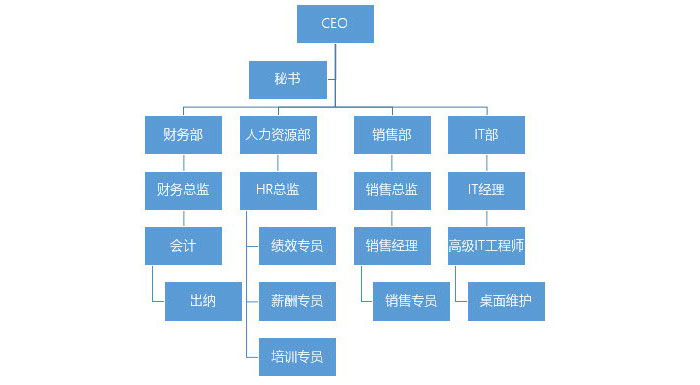
第二个问题,如何添加秘书呢?方法也很简单,选中CEO那个位置,在下图8处 添加形状,单击“添加助理”按钮。(下图8处)

添加完毕后,输入“秘书”两字即可。效果如下:
依照上文描述的PPT中快速产生一个复杂组织架构图的具体操作方法,你们是不是都学会啦!