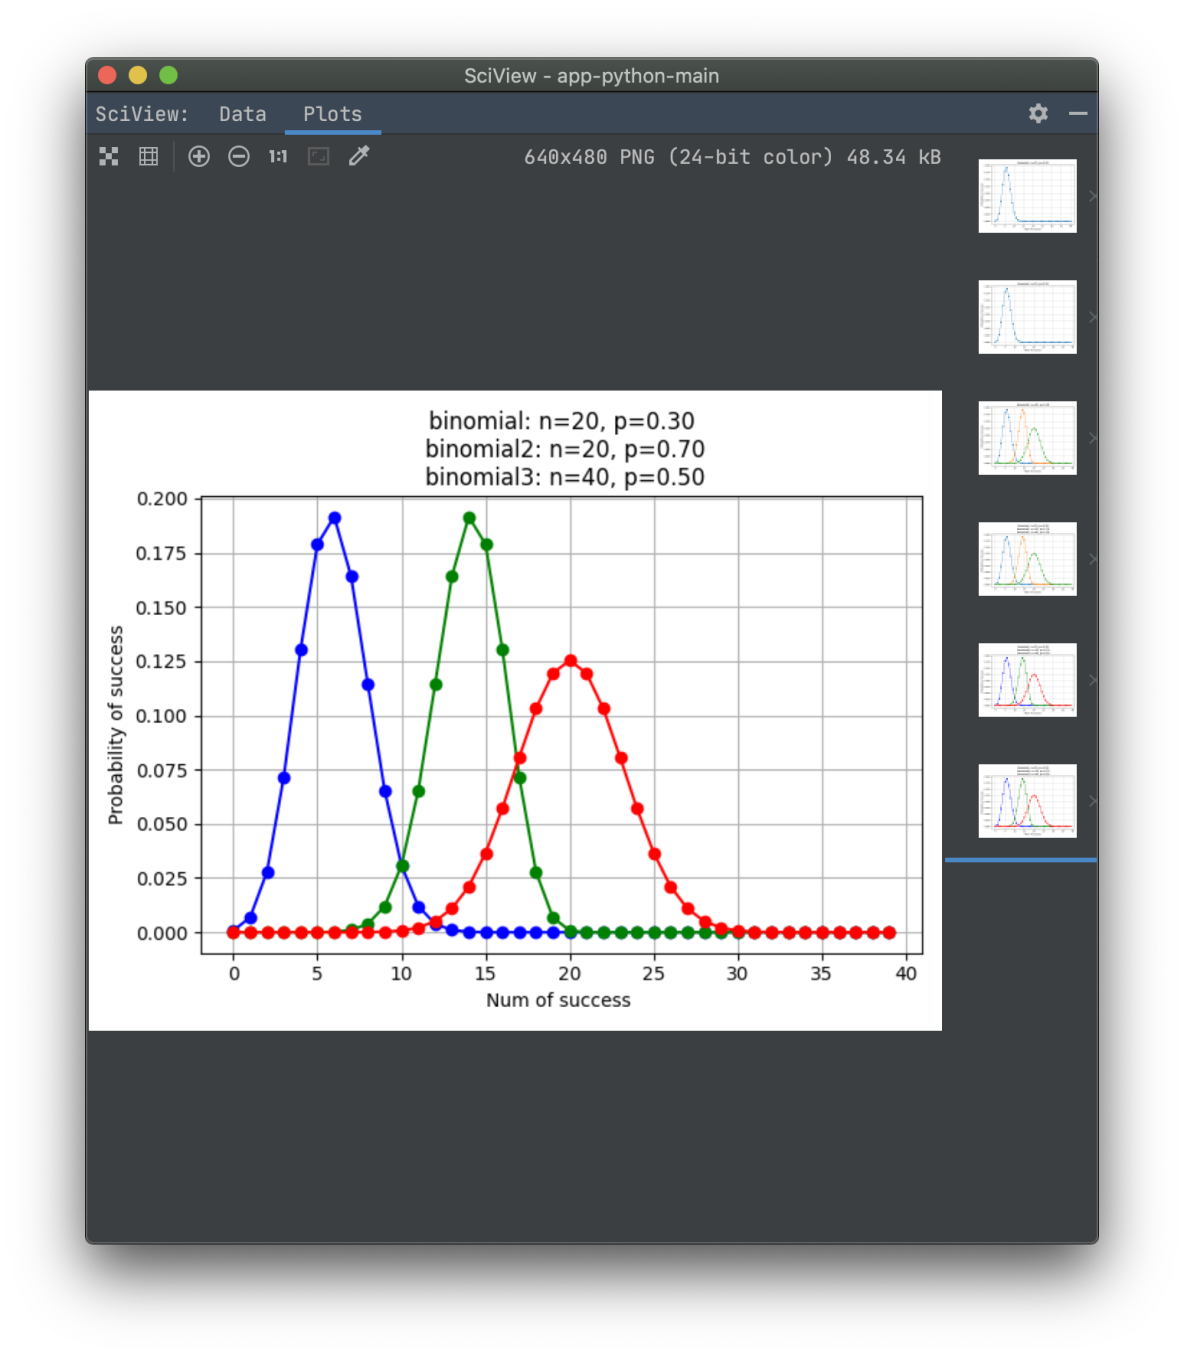
代码: import numpy as np import matplotlib . pyplot as plt import math from scipy import stats #Key n , p = 20 , 0.3 n2 , p2 = 20 , 0.7 n3 , p3 = 40 , 0.5 k = np . arange ( 40 ) binomial = stats . binom . pmf ( k , n , p ) binomial2 = s
代码:
import numpy as npimport matplotlib.pyplot as plt
import math
from scipy import stats #Key
n,p=20,0.3
n2,p2=20,0.7
n3,p3=40,0.5
k=np.arange(40)
binomial=stats.binom.pmf(k, n, p)
binomial2=stats.binom.pmf(k, n2, p2)
binomial3=stats.binom.pmf(k, n3, p3)
plt.plot(k, binomial, 'o-',color='blue')
plt.plot(k, binomial2, 'o-',color='green')
plt.plot(k, binomial3, 'o-',color='red')
plt.title("binomial: n=%i, p=%.2f\n binomial2: n=%i, p=%.2f\n binomial3: n=%i, p=%.2f" %(n,p,n2,p2,n3,p3))
plt.xlabel('Num of success ')
plt.ylabel('Probability of success')
plt.grid(True)
plt.show()
绘图结果:

