文章目录 一、净额成交量 二、标量函数矢量化 三、数据曲线平滑 一、净额成交量 1、案例分析 符号数组a: [10 -20 30 40 -50] 用法:numpy.sign(a) 结果是[1 -1 1 1 -
文章目录
- 一、净额成交量
- 二、标量函数矢量化
- 三、数据曲线平滑
一、净额成交量
1、案例分析
- 符号数组a: [10 -20 30 40 -50]
- 用法:numpy.sign(a)
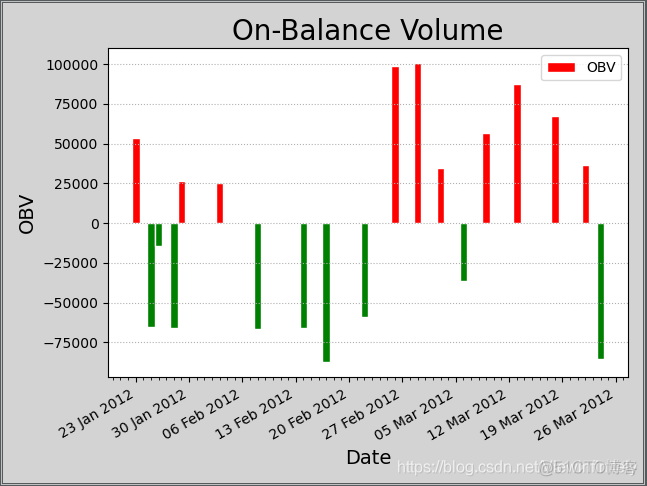
结果是[1 -1 1 1 -1] - 净额成交量:简称OBV,赚了是正,赔了是负
- 利用条件筛选来得到盈亏指标:一参是差分数组,二参是条件数组,三参是各个条件对应的值数组
2、第二种筛选方法
sign_closing_price = np.piecewise(diff_closing_price,
[diff_closing_price < 0,
diff_closing_price == 0,
diff_closing_price > 0],
[-1, 0 , 1]
)
3、案例源码
import datetime as dtimport numpy as np
import matplotlib.pylab as mp
import matplotlib.dates as md
def dmy2ymd(dmy):
dmy = str(dmy, encoding='utf-8') # 转码dmy日期
date = dt.datetime.strptime(dmy, '%d-%m-%Y').date() # 获取时间对象
ymd = date.strftime('%Y-%m-%d')
return ymd
dates, closing_prices, volumes = np.loadtxt(
'0=数据源/beer_price2.csv', delimiter=',',
usecols=(0, 4, 5), unpack=True,
dtype=np.dtype('M8[D], f8, f8'),
converters={0: dmy2ymd}
)
# 交易日的差分(后一天减去前一天)组成的差分数组,正的是赚了,负的是赔了
diff_closing_price = np.diff(closing_prices)
sign_closing_price = np.sign(diff_closing_price)
# print(diff_closing_price)
# print(sign_closing_price)
# 利用条件筛选来得到盈亏指标:一参是差分数组,二参是条件数组,三参是各个条件对应的值数组
sign_closing_price = np.piecewise(
diff_closing_price,
[diff_closing_price < 0,
diff_closing_price == 0,
diff_closing_price > 0],
[-1, 0, 1]
)
# 得到盈亏量,带正负的
obvs = volumes[1:] * sign_closing_price # 成交量乘盈亏指标,得到的是盈亏量
# 曲线图基础设置
mp.figure('On-Balance Volume', facecolor='lightgray')
mp.title('On-Balance Volume', fontsize=20)
mp.xlabel('Date', fontsize=14)
mp.ylabel('OBV', fontsize=14)
# 主刻度设置为以周一为起始的星期格式
ax = mp.gca() # 获取刻度线(坐标轴)
ax.xaxis.set_major_locator(
md.WeekdayLocator(byweekday=md.MO)
)
# 次刻度设置为以天为单位
ax.xaxis.set_minor_locator(
md.DayLocator()
)
# 主刻度的格式化
ax.xaxis.set_major_formatter(
md.DateFormatter('%d %b %Y')
)
mp.tick_params(labelsize=10) # 字体
mp.grid(axis='y', linestyle=':') # 网格线,不需要纵向
# 绘制曲线
dates = dates[1:].astype(md.datetime.datetime) # 将日期标准化成numpy的日期
# 记录所有上涨和下跌的部分
rise = obvs > 0
fall = obvs < 0
# 设置前景色与背景色
fc = np.zeros(dates.size, dtype='3f4')
ec = np.zeros(dates.size, dtype='3f4')
fc[rise], fc[fall] = (1, 0, 0), (0, 0.5, 0)
ec[rise], ec[fall] = (1, 1, 1), (1, 1, 1)
# 绘制柱形图
mp.bar(dates, obvs, 1.0, 0, color=fc, edgecolor=ec, label='OBV')
mp.legend() # 显示图例
mp.gcf().autofmt_xdate() # 设置格式展示的自动化调整
mp.show() # 显示图像

二、标量函数矢量化
1、矢量化概念
def 标量函数(标量参数1, 标量参数2, ...)...
return 标量返回值1, 标量返回值2, ...
矢量化:np.vectorize(标量函数)——>转换成矢量函数
def 矢量函数(矢量参数1, 矢量参数2, ...)...
矢量返回值1, 矢量返回值2, ...
2、练习代码
import numpy as npdef fun1(a, b):
return a+b, a-b, a*b
A = np.array([10, 20, 30])
B = np.array([100, 200, 300])
# 不需要循环迭代,就可以对传入的数组对应着进行处理
# 此处表示将A与B两个数组中的值一一对应传入fun1中进行处理,处理结果返回给C数组
C = np.vectorize(fun1)(A, B)
print(C)
三、数据曲线平滑
1、数据平滑
卷积降噪(消除随机噪声干扰)——>曲线拟合(获得数学模型)——>求特征值(反映业务特征)
2、平滑过程
y=f(x)
y=g(x)
y1=f(x1)
y1=g(x1)
f(x1)=g(x1)
f(x1)-g(x1)=0
f(x)-g(x)=0的根就是x1
np.polysub(p1, p2)得到p3,即为方程f(x)-g(x)=0的各个项系数
np.roots(p3) 得到p3的根,即x1
3、案例源码
import datetime as dtimport numpy as np
import matplotlib.pylab as mp
import matplotlib.dates as md
def dmy2ymd(dmy):
dmy = str(dmy, encoding='utf-8') # 转码dmy日期
date = dt.datetime.strptime(dmy, '%d-%m-%Y').date() # 获取时间对象
ymd = date.strftime('%Y-%m-%d')
return ymd
dates, beer_closing_prices = np.loadtxt(
'0=数据源/beer_price2.csv', delimiter=',',
usecols=(0, 4), unpack=True,
dtype=np.dtype('M8[D], f8'),
converters={0: dmy2ymd}
)
__, apple_closing_prices = np.loadtxt(
'0=数据源/apple_price.csv', delimiter=',',
usecols=(0, 4), unpack=True,
dtype=np.dtype('M8[D], f8'),
converters={0: dmy2ymd}
)
# 用理想差分(后一天减去前一天的值)求日收益,再除每天的收盘价
beer_returns = np.diff(beer_closing_prices)/beer_closing_prices[:-1]
apple_returns = np.diff(apple_closing_prices)/apple_closing_prices[:-1]
# 卷积降噪
N = 8 # 卷积和的宽度
weights = np.hanning(N) # 权重是大小为8的汉宁窗,8各自对称的数据
# print(weights)
weights /= weights.sum() # 除权重和
# 两条曲线的卷积
beer_smooth_returns = np.convolve(beer_closing_prices, weights, 'valid')
apple_smooth_returns = np.convolve(apple_closing_prices, weights, 'valid')
# 拟合曲线
days = dates[N-2:-1].astype(int) # 转化成以天为单位
degree = 5
beer_p = np.polyfit(days, beer_smooth_returns, degree)
beer_fitted_returns = np.polyval(beer_p, days)
apple_p = np.polyfit(days, apple_smooth_returns, degree)
apple_fitted_returns = np.polyval(apple_p, days)
# polysub处理
sub_p = np.polysub(beer_p, apple_p)
roots = np.roots(sub_p) # 取根
reals = roots[np.isreal(roots)].real # 取实根
inters = []
for real in reals:
if days[0] <= real <= days[-1]:
inters.append([real, np.polyval(beer_p, real)])
inters.sort() # 按照横坐标进行排序
inters = np.array(inters) # 变成numpy的数组
# 曲线图基础设置
mp.figure('Smooth returns', facecolor='lightgray')
mp.title('Smooth returns', fontsize=20)
mp.xlabel('Date', fontsize=14)
mp.ylabel('Returns', fontsize=14)
# 主刻度设置为以周一为起始的星期格式
ax = mp.gca() # 获取刻度线(坐标轴)
ax.xaxis.set_major_locator(
md.WeekdayLocator(byweekday=md.MO)
)
# 次刻度设置为以天为单位
ax.xaxis.set_minor_locator(
md.DayLocator()
)
# 主刻度的格式化
ax.xaxis.set_major_formatter(
md.DateFormatter('%d %b %Y')
)
mp.tick_params(labelsize=10) # 字体
mp.grid(linestyle=':') # 网格线
# 绘制曲线
dates = dates.astype(md.datetime.datetime) # 将日期标准化成numpy的日期
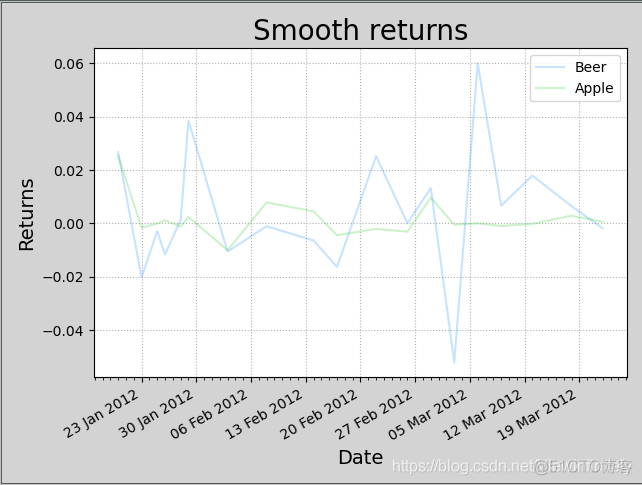
mp.plot(dates[:-1], beer_returns, c='dodgerblue', alpha=0.25, label='Beer')
mp.plot(dates[:-1], apple_returns, c='limegreen', alpha=0.25, label='Apple')
'''
此处由于数据不够匹配,因此差别很大,绘制不出想要的效果
'''
# 绘制卷积后的曲线:卷积之前的数据是没有算入曲线的,所以N-2
# mp.plot(dates[N-2:-1], beer_smooth_returns, c='dodgerblue', alpha=0.75, label='Smooth Beer')
# mp.plot(dates[N-2:-1], apple_smooth_returns, c='limegreen', alpha=0.75, label='Smooth Apple')
# 绘制拟合曲线
# mp.plot(dates[N-2:-1], beer_fitted_returns, c='dodgerblue', linewidth=3, label='Fitted Beer')
# mp.plot(dates[N-2:-1], apple_fitted_returns, c='limegreen', linewidth=3, label='Fitted Apple')
# 绘制polysub后的点
dates, returns = np.hsplit(inters, 2)
dates = dates.astype(int).astype('M8[D]').astype(md.datetime.datetime)
mp.scatter(dates, returns, marker='x', c='firebrick', s=100, lw=3, zorder=3)
mp.legend() # 显示图例
mp.gcf().autofmt_xdate() # 设置格式展示的自动化调整
mp.show() # 显示图像

