一、数据概览 该数据集包含了超过100多万名已故人的生活、工作和死亡的结构化信息。 数据集: AgeDatasetV1.csv 数据集来自kaggle 一共1223009条数据。 通过全球122万名人的死亡
一、数据概览
该数据集包含了超过100多万名已故人的生活、工作和死亡的结构化信息。
数据集: AgeDatasetV1.csv 数据集来自kaggle 一共1223009条数据。
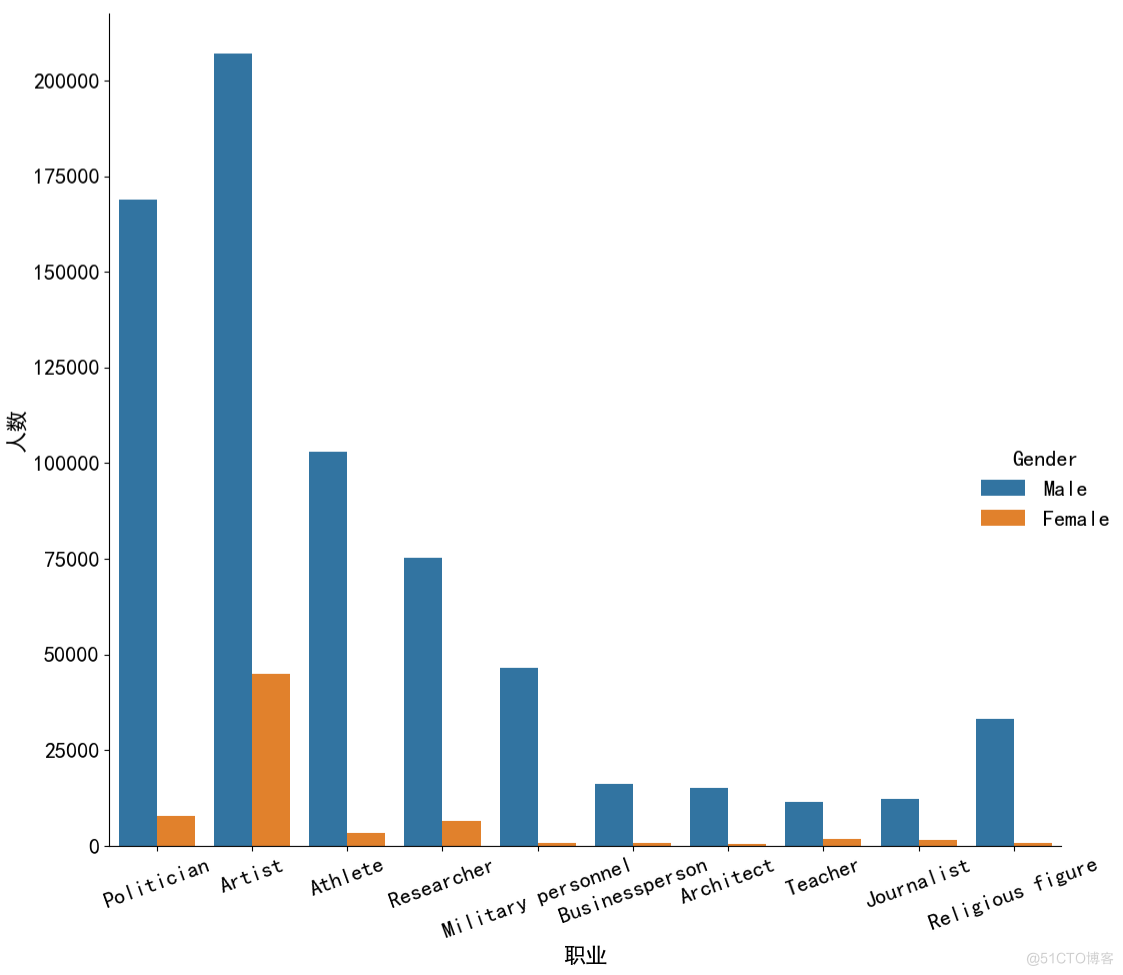
通过全球122万名人的死亡数据,我们可以了解大部分人的寿命,在过去哪些年份的死亡人数较多,哪些年份出生的人死亡人数较多,以及不同性别的死亡年龄趋势,不同职业的男性和女性的死亡人数。
在本案例中我们用到pandas,pyplot,seaborn绘饼状图、长条图、堆积条形图、折线图
列名
描述
'Id',
编号
'Name',
名字
'Short description',
简述
Gender',
性别
Country',
国家
Occupation',
职业
'Birth year',
出生年份
'Death year',
逝世年份
'Manner of death',
死亡方式
'Age of death'
去世年龄
二、数据预处理
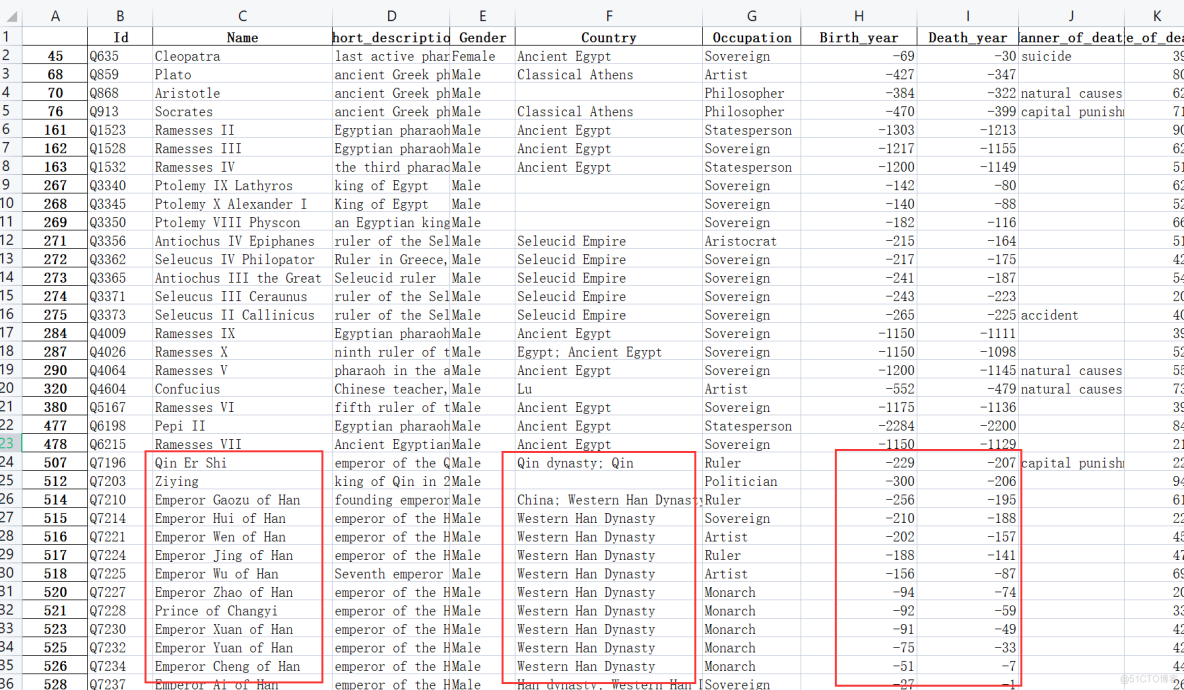
发现有出生年份为负数的,其实是正常值,负值表示公元前。
import pandas as pddf = pd.read_csv('.\data\AgeDatasetV1.csv')
df.info()
df.describe().to_excel(r'.\result\describe.xlsx')
df.isnull().sum().to_excel(r'.\result\nullsum.xlsx')
df[df.duplicated()].to_excel(r'.\result\duplicated.xlsx')
df.rename(columns=lambda x: x.replace(' ', '_').replace('-', '_'), inplace=True)
print(df.columns)
print(df[df['Birth_year'] < 0].to_excel(r'.\result\biryear0.xlsx'))
三、数据可视化
0、导入包和数据
import pandas as pdimport matplotlib.pyplot as plt
import seaborn as sns
plt.rcParams['font.sans-serif'] = ['SimHei'] # 显示中文标签
plt.rcParams['axes.unicode_minus'] = False
df1 = pd.read_csv('./data/AgeDatasetV1.csv')
# 列名规范化 重命名
df1.rename(columns=lambda x: x.replace(' ', '_').replace('-', '_'), inplace=True)
print(df1.columns)
1、按不同年龄范围的死亡率百分比
plt.figure(figsize=(12, 10))count = [df1[df1['Age_of_death'] > 100].shape[0],
df1.shape[0] - df1[(df1['Age_of_death'] <= 100) & (df1['Age_of_death'] > 90)].shape[0],
df1[(df1['Age_of_death'] <= 90) & (df1['Age_of_death'] > 70)].shape[0],
df1[(df1['Age_of_death'] <= 70) & (df1['Age_of_death'] > 50)].shape[0],
df1.shape[0] - (df1[df1['Age_of_death'] > 100].shape[0] +
df1[(df1['Age_of_death'] <= 100) & (df1['Age_of_death'] > 90)].shape[0]
+ df1[(df1['Age_of_death'] <= 70) & (df1['Age_of_death'] > 50)].shape[0]
+ df1[(df1['Age_of_death'] <= 90) & (df1['Age_of_death'] > 70)].shape[0])
]
age = ['> 100', '> 90 & <= 100', '> 70 & <= 90', '> 50 & <= 70', '< 50']
explode = [0.1, 0, 0.02, 0, 0] # 设置各部分突出
palette_color = sns.color_palette('pastel')
plt.rc('font', family='SimHei', size=16)
plt.pie(count, labels=age, colors=palette_color,
explode=explode, autopct='%.4f%%')
plt.title("按不同年龄范围的死亡率百分比")
plt.savefig(r'.\result\不同年龄范围的死亡率百分比.png')
plt.show()

我们可以发现90岁以上的死亡比例占了至少一半,70岁以上死亡的占了75%,大部分人还是长寿的,50岁之前就死亡的不到18%。
2、死亡人数前20的职业
Occupation = list(df1['Occupation'].value_counts()[:20].keys())Occupation_count = list(df1['Occupation'].value_counts()[:20].values)
plt.rc('font', family='SimHei', size=16)
plt.figure(figsize=(14, 8))
# sns.set_theme(style="darkgrid")
p = sns.barplot(x=Occupation_count, y=Occupation) # 长条图
p.set_xlabel("人数", fontsize=20)
p.set_ylabel("职业", fontsize=20)
plt.title("前20的职业", fontsize=20)
plt.subplots_adjust(left=0.18)
plt.savefig(r'.\result\死亡人数前20的职业.png')
plt.show()

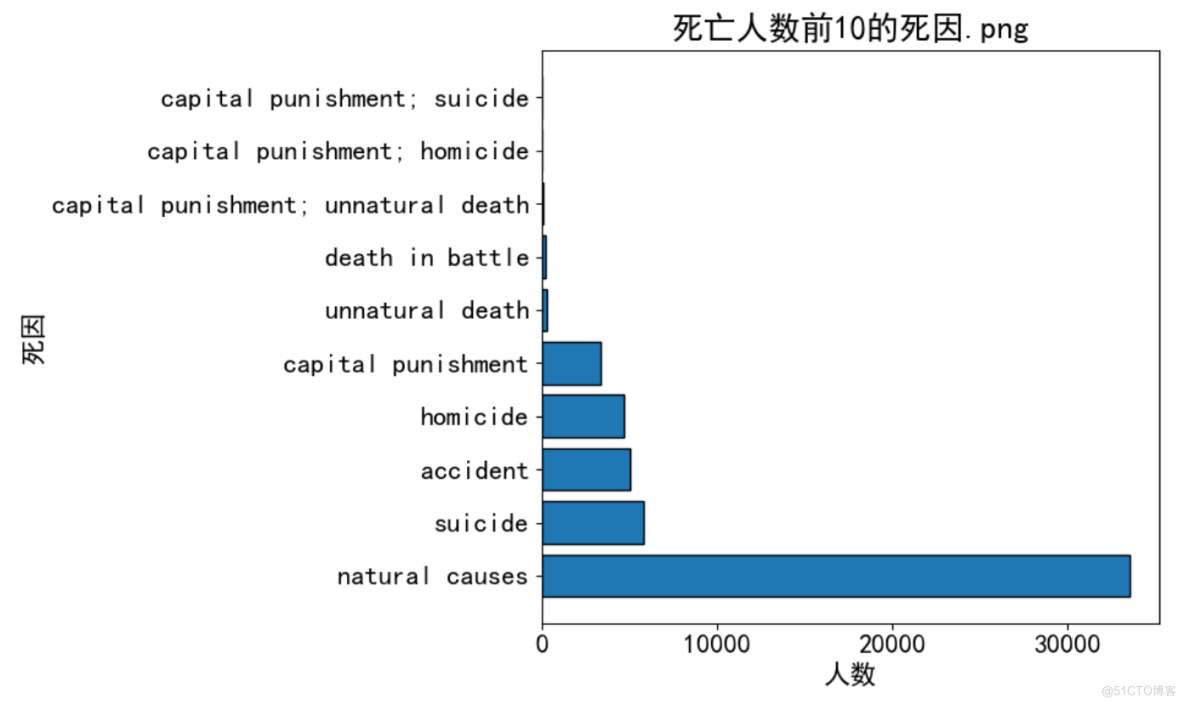
3、死亡人数前10的死因
top_causes = df1.groupby('Manner_of_death').size().reset_index(name='count')top_causes = top_causes.sort_values(by='count', ascending=False).iloc[:10]
fig = plt.figure(figsize=(10, 6))
plt.barh(top_causes['Manner_of_death'], top_causes['count'], edgecolor='black') # 堆积条形图
plt.title('死亡人数前10的死因.png')
plt.xlabel('人数')
plt.ylabel('死因')
plt.tight_layout() # 自动调整子图参数,使之填充整个图像区域
plt.savefig(r'.\result\死亡人数前10的死因.png')
plt.show()
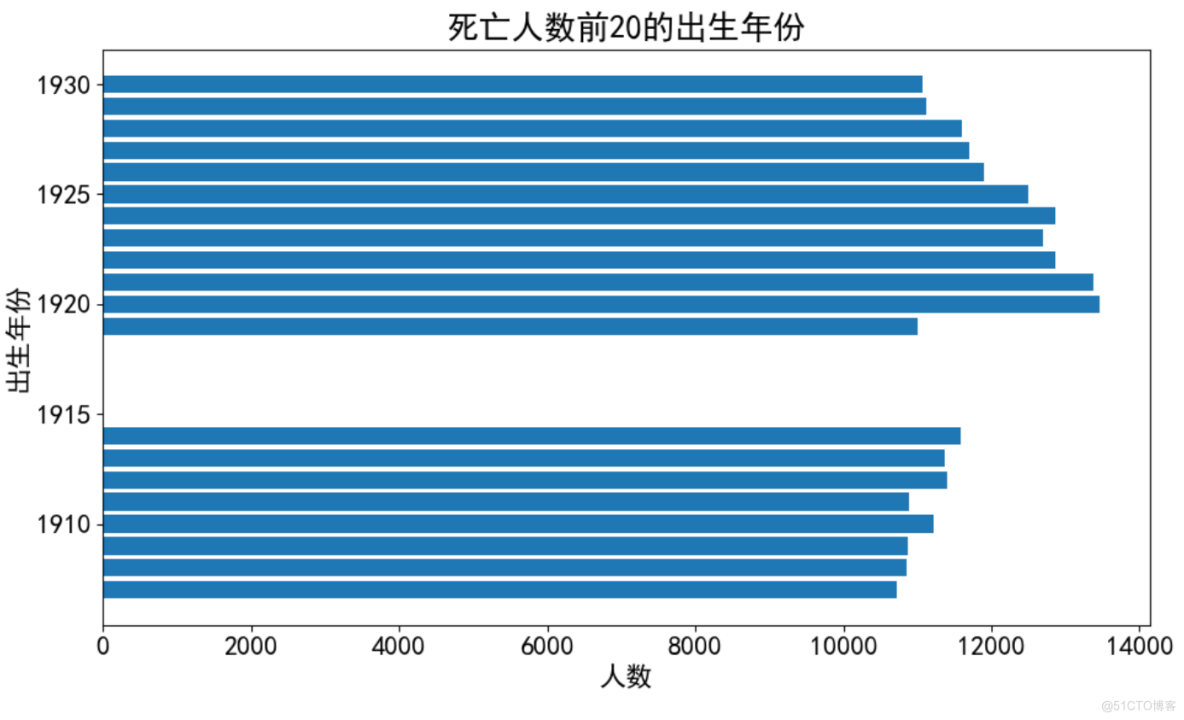
4、死亡人数前20的出生年份
birth_year = df1.groupby('Birth_year').size().reset_index(name='count')birth_year = birth_year.sort_values(by='count', ascending=False).iloc[:20]
fig = plt.figure(figsize=(10, 6))
plt.barh(birth_year['Birth_year'], birth_year['count'])
plt.title('死亡人数前20的出生年份')
plt.xlabel('人数')
plt.ylabel('出生年份')
plt.tight_layout() # 自动调整子图参数,使之填充整个图像区域
plt.savefig(r'.\result\死亡人数前20的出生年份.png')
plt.show()
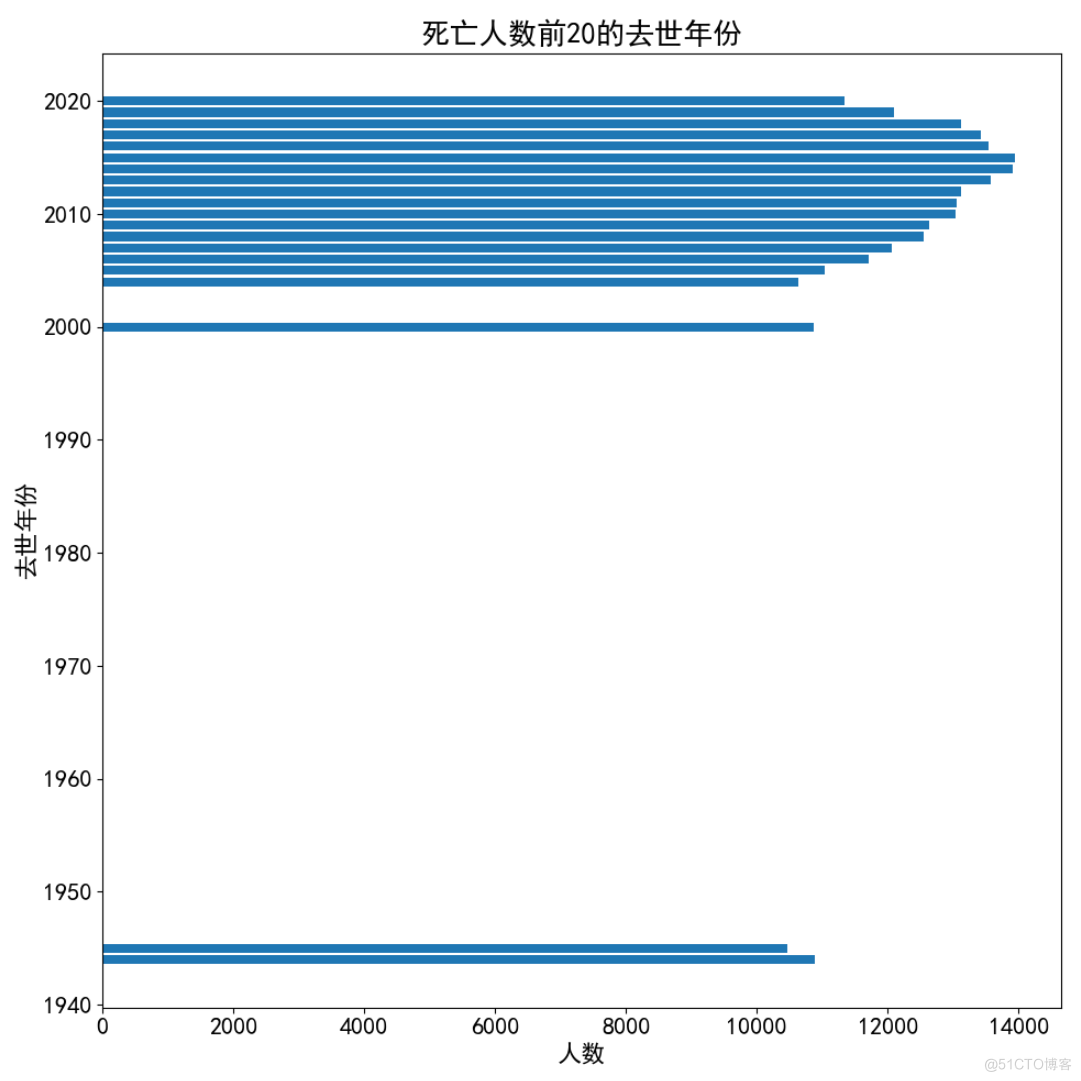
5、死亡人数前20的去世年份
death_year = df1.groupby('Death_year').size().reset_index(name='count')print(death_year)
death_year = death_year.sort_values(by='count', ascending=False).iloc[:20]
fig = plt.figure(figsize=(10, 10))
plt.barh(death_year['Death_year'], death_year['count'])
plt.title('死亡人数前20的去世年份')
plt.xlabel('人数')
plt.ylabel('去世年份')
plt.tight_layout()
plt.savefig(r'.\result\死亡人数前20的去世年份.png')
plt.show()
6、按性别分列的死亡年龄趋势
data = pd.DataFrame(df1.groupby(['Gender', 'Age_of_death']).size().reset_index(name='count').sort_values(by='count', ascending=False))
fig = plt.figure(figsize=(10, 10))
sns.lineplot(data=data, x='Age_of_death', y='count', hue='Gender', linewidth=2) # 折线图
plt.legend(fontsize=8)
plt.title('按性别分列的死亡年龄趋势')
plt.xlabel('死亡年龄')
plt.ylabel('人数')
plt.tight_layout()
plt.savefig(r'.\result\死亡人数前20的去世年份.png')
plt.show()

7、前10的职业中 男性与女性的人数
occupation = pd.DataFrame(df1['Occupation'].value_counts())top10_occupation = occupation.head(10)
top_index = [i for i in top10_occupation.index]
age_data = df1[df1['Occupation'].isin(top_index)]
age_data = age_data[age_data['Gender'].isin(['Male', 'Female'])]
sns.catplot(data=age_data, x='Occupation', kind='count', hue='Gender', height=10)
plt.xticks(rotation=20)
plt.xlabel('职业')
plt.ylabel('人数')
plt.tight_layout()
plt.savefig(r'.\result\前10的职业中男女性人数.png')
plt.show()
