目录
- 前言
- 界面设计
- 效果展示
- 代码逻辑
前言
将Chart的X轴设置为时间轴是一个说简单不简单的问题,说难也不难的问题,你用过之后呢就感觉很容易,你没用过呢,就比较难,所以这个是很值得我们学习的,我看了别的社区也没有具体讲,所以我想分享一下,万一我自己忘记了,也可以翻这篇文章去复习,我们一起来学习一下吧,虽然这篇文章比较简单,也是值得学习的,创作不易,点赞关注评论收藏,谢谢大家啦!!!
界面设计
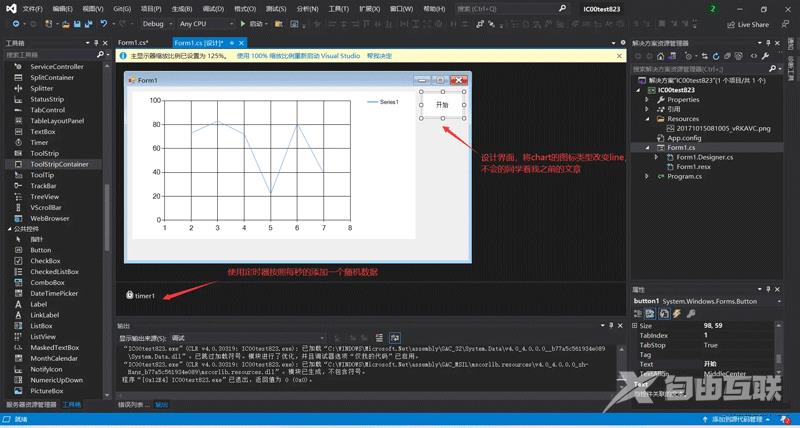
对界面的设计,使用timer定时器按照每秒循环生成随机数添加进Chart里面,使我们实现每秒添加值,形成曲线运动,开始按钮是对于定时器的控制,然后我们将代码复制到我们的项目中对于chart的折线图设置,就可以实现时间轴为X轴。注意:虽然我们是有AddXY的方法,但是如果你不设置X轴就会出现你添加的时间是有问题的,另外,如果我们要把自己的时间添加进去需要对时间进行.ToOADate()操作才可以。


效果展示
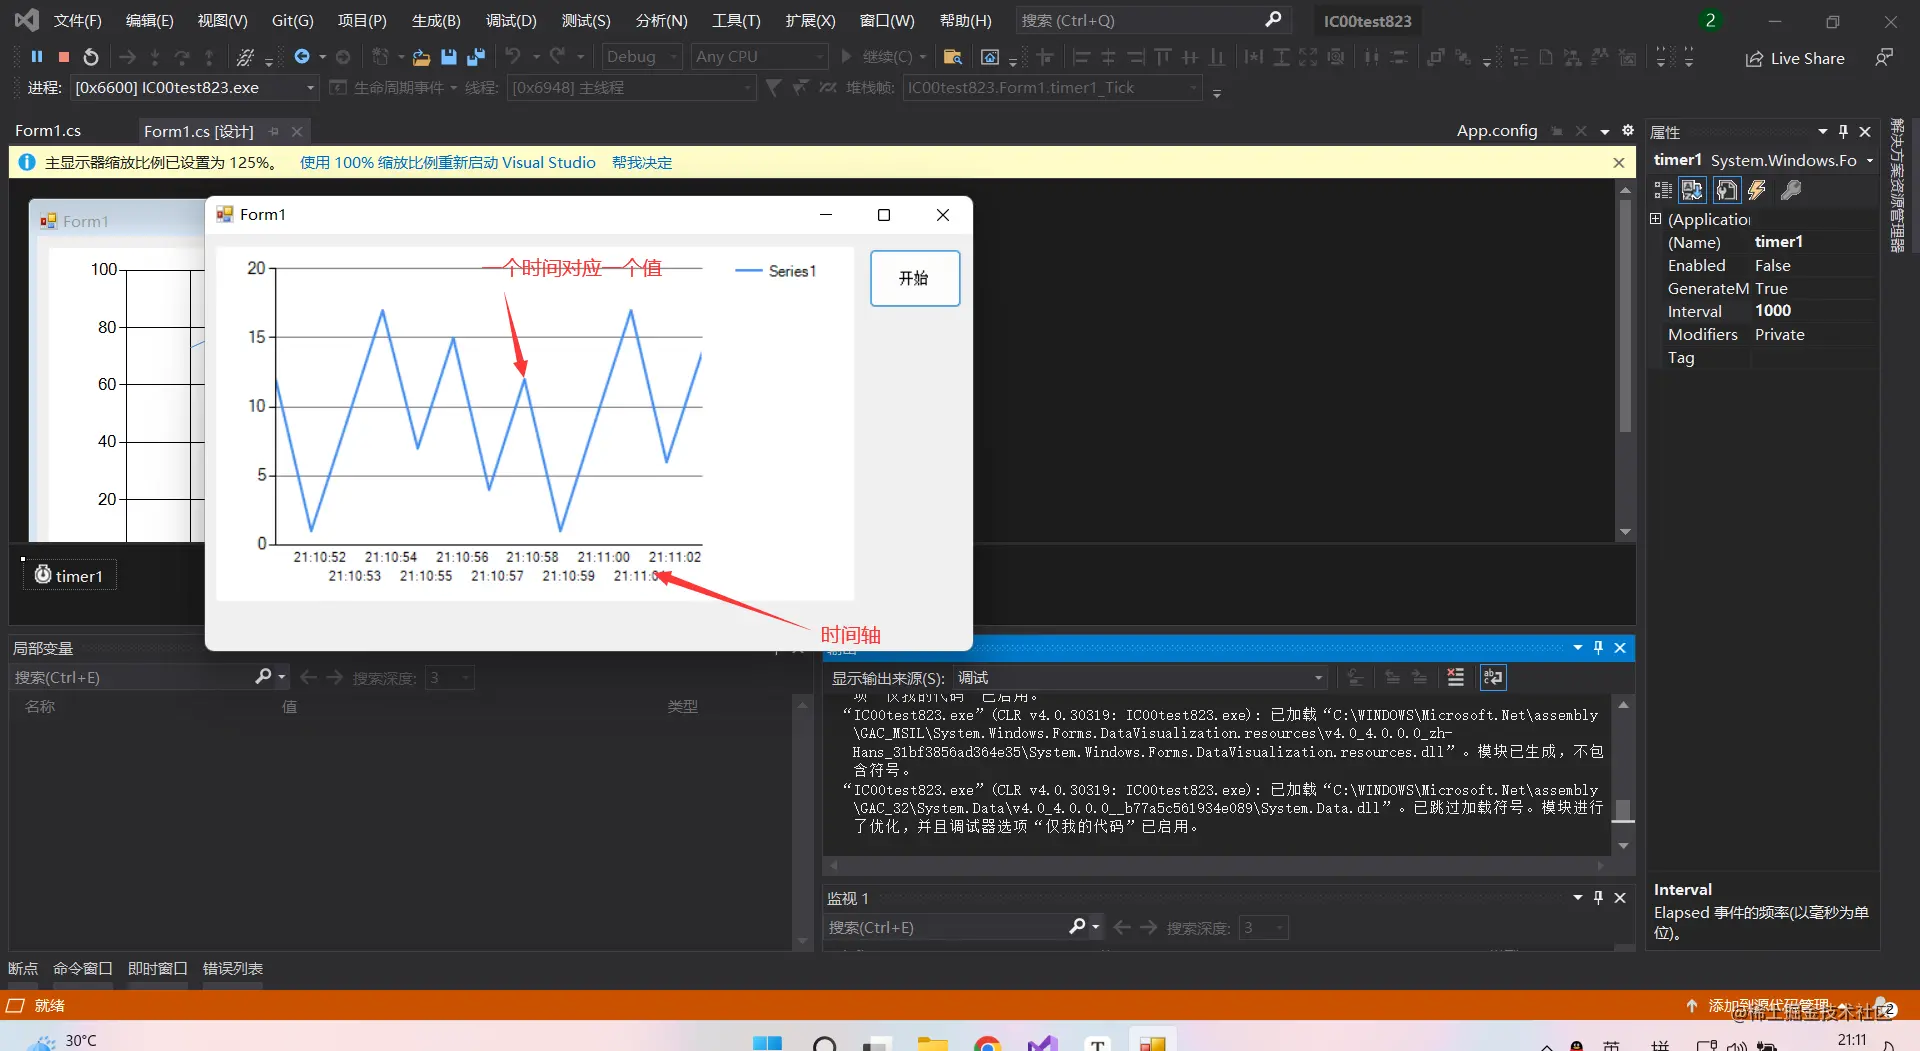
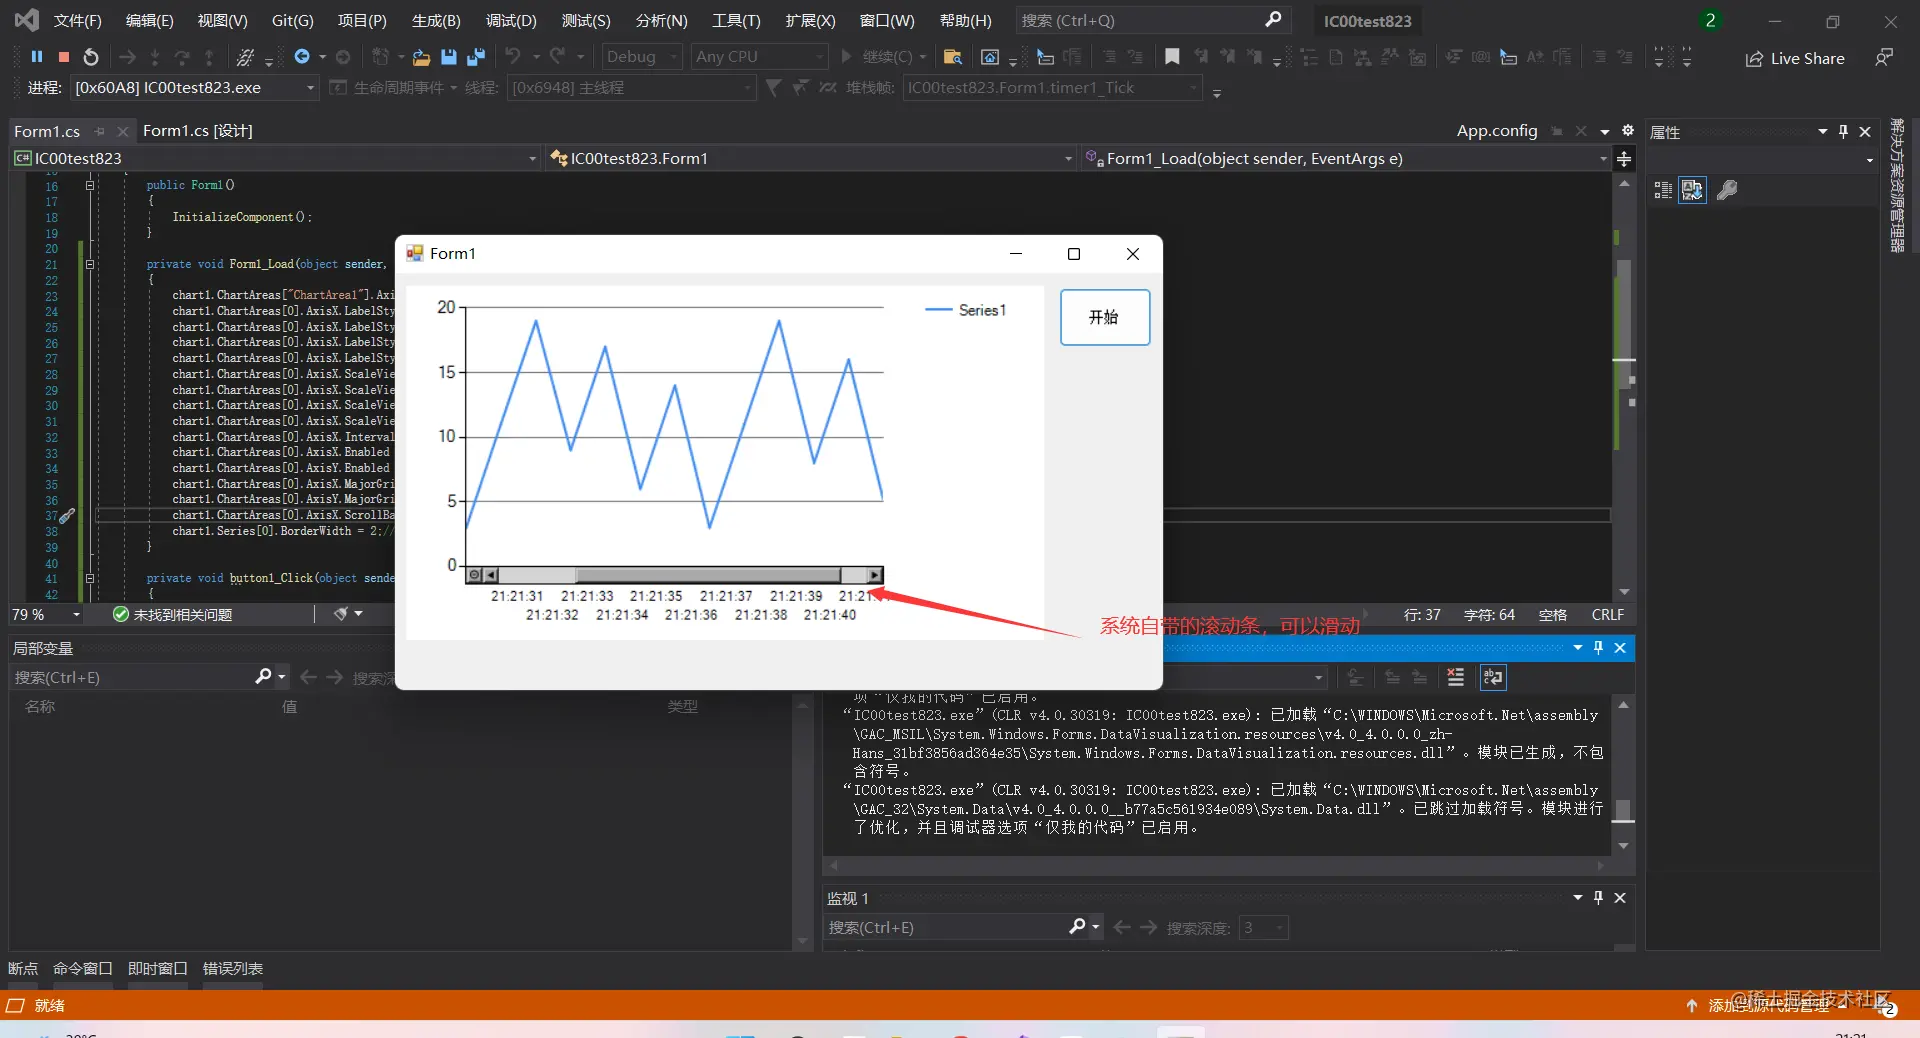
效果展示就是下图,最下面的是启用了系统滚动条,样子有点丑


如果你的时间不是采用系统时间添加,可能会出现添加时间不进去或者出现错误,如果你想添加你自己的时间需要对这个时间进行“.ToOADate()”操作,datetime.AddSeconds(1).ToOADate(),假设datetime是你的时间,AddSeconds(1)是代表在你的datetime的基础上加一秒,.ToOADate()这是自动化日期,类似时间戳,datetime.ToOADate(),也可直接这样不用加一秒,就是你的那个时间,注意一定要加.ToOADate()!!!!
代码逻辑
复制那段对于chart的折线图的设置,直接用我都有备注,注意:里面有条语句chart1.ChartAreas[0].AxisX.ScaleView.Scroll(System.Windows.Forms.DataVisualization.Charting.ScrollType.Last)是关于滚动条视图的,就是说我们的数据可以一直往前跑我们可以看得到,实现数据滚动, 但是建议跟着我那个if一起用避免报错,代码如下,你们可以直接复制。
using System;
using System.Collections.Generic;
using System.ComponentModel;
using System.Data;
using System.Drawing;
using System.Linq;
using System.Text;
using System.Threading.Tasks;
using System.Windows.Forms;
using System.Windows.Forms.DataVisualization.Charting;
namespace IC00test823
{
public partial class Form1 : Form
{
public Form1()
{
InitializeComponent();
}
private void Form1_Load(object sender, EventArgs e)
{
chart1.ChartAreas["ChartArea1"].AxisX.ScaleView.Size = 10;//x坐标显示的个数------------控制这个数量的大小进行缩放
chart1.ChartAreas[0].AxisX.LabelStyle.IntervalType = DateTimeIntervalType.Seconds;//设置x轴间隔值单位:秒
chart1.ChartAreas[0].AxisX.LabelStyle.Interval = 1;//设置X轴的值的间隔大小
chart1.ChartAreas[0].AxisX.LabelStyle.IsEndLabelVisible = false;//是否在轴末尾显示标记
chart1.ChartAreas[0].AxisX.LabelStyle.Format = "HH:mm:ss";//设置X轴的数据样式
chart1.ChartAreas[0].AxisX.ScaleView.MinSizeType = DateTimeIntervalType.Seconds;
chart1.ChartAreas[0].AxisX.ScaleView.SizeType = DateTimeIntervalType.Seconds; //度量单位
chart1.ChartAreas[0].AxisX.ScaleView.SmallScrollMinSize = 1;
chart1.ChartAreas[0].AxisX.ScaleView.SmallScrollMinSizeType = DateTimeIntervalType.Seconds;
chart1.ChartAreas[0].AxisX.IntervalType = DateTimeIntervalType.Seconds;
chart1.ChartAreas[0].AxisX.Enabled = AxisEnabled.True;//将X轴始终展示
chart1.ChartAreas[0].AxisY.Enabled = AxisEnabled.True;//将Y轴始终展示
chart1.ChartAreas[0].AxisX.MajorGrid.LineColor = Color.Gray;//设置X轴网格线颜色
chart1.ChartAreas[0].AxisY.MajorGrid.LineColor = Color.Gray;//设置Y轴网格线颜色
chart1.ChartAreas[0].AxisX.ScrollBar.Enabled = false;//关闭系统的滚动条,也可以不关闭,就可以滑动
chart1.Series[0].BorderWidth = 2;//线宽
}
private void button1_Click(object sender, EventArgs e)
{
timer1.Enabled = !timer1.Enabled;
}
private void timer1_Tick(object sender, EventArgs e)
{
Random random = new Random();
chart1.Series[0].Points.AddXY(DateTime.Now,random.Next(1,20));
if(chart1.ChartAreas[0].AxisX.ScaleView.Size>0)
{
chart1.ChartAreas[0].AxisX.ScaleView.Scroll(System.Windows.Forms.DataVisualization.Charting.ScrollType.Last);
}
}
}
}
到此这篇关于C# 设置Chart的X轴为时间轴详情的文章就介绍到这了,更多相关C# 时间轴内容请搜索自由互联以前的文章或继续浏览下面的相关文章希望大家以后多多支持自由互联!
