Zabbix对memcached的监控的主要思路是可以memcached自带的的查询状态命令stats,在通过脚本来使用此命令进行数据的展示并结合相关命令将数值取出来完成zabbix对memcached的实时监控。这
Zabbix对memcached的监控的主要思路是可以memcached自带的的查询状态命令stats,在通过脚本来使用此命令进行数据的展示并结合相关命令将数值取出来完成zabbix对memcached的实时监控。这里的memcached服务我就安装Linux主机上了,监控的话也就在zabbix web界面上添加自定义的模板就好了。
1、准备memcached服务
安装memcached,并配置好memcached,同时也需要安装zabbix agent、nmap基本工具包。
root@Linux:~# wget https://repo.zabbix.com/zabbix/5.0/ubuntu/pool/main/z/zabbix-release/zabbix-release_5.0-1%2Bfocal_all.deb root@Linux:~# dpkg -i zabbix-release_5.0-1+focal_all.deb root@Linux:~# apt update root@Linux:~# apt -y install zabbix-agent memcached nmap ncat root@Linux:~# vi /etc/memcached.conf root@Linux:~# grep -Ev "#|^$" /etc/memcached.conf -d logfile /var/log/memcached.log -m 512 -p 11211 -u memcache -l 0.0.0.0 -P /var/run/memcached/memcached.pid root@Linux:~# systemctl restart memcached.service root@Linux:~# systemctl enable memcached root@Linux:~# lsof -i:11211 COMMAND PID USER FD TYPE DEVICE SIZE/OFF NODE NAME memcached 5380 memcache 26u IPv4 55532 0t0 TCP *:11211 (LISTEN)2、监控脚本
#首先先用stats查看一下memcached的运行状态 root@Linux:~# telnet 127.0.0.1 11211 Trying 127.0.0.1... Connected to 127.0.0.1. Escape character is '^]'. stats STAT pid 5380 STAT uptime 154 STAT time 1670232197 STAT version 1.5.22 STAT libevent 2.1.11-stable STAT pointer_size 64 STAT rusage_user 0.000000 STAT rusage_system 0.037778 STAT max_connections 1024 STAT curr_connections 1 STAT total_connections 2 STAT rejected_connections 1 STAT connection_structures 2 STAT reserved_fds 20 STAT cmd_get 0 STAT cmd_set 0 STAT cmd_flush 0 STAT cmd_touch 0 STAT cmd_meta 0 STAT get_hits 0 STAT get_misses 0 STAT get_expired 0 STAT get_flushed 0 STAT delete_misses 0 STAT delete_hits 0 STAT incr_misses 0 STAT incr_hits 0 STAT decr_misses 0 STAT decr_hits 0 STAT cas_misses 0 STAT cas_hits 0 STAT cas_badval 0 STAT touch_hits 0 STAT touch_misses 0 STAT auth_cmds 0 STAT auth_errors 0 STAT bytes_read 7 STAT bytes_written 0 STAT limit_maxbytes 536870912 STAT accepting_conns 1 STAT listen_disabled_num 0 STAT time_in_listen_disabled_us 0 STAT threads 4 STAT conn_yields 0 STAT hash_power_level 16 STAT hash_bytes 524288 STAT hash_is_expanding 0 STAT slab_reassign_rescues 0 STAT slab_reassign_chunk_rescues 0 STAT slab_reassign_evictions_nomem 0 STAT slab_reassign_inline_reclaim 0 STAT slab_reassign_busy_items 0 STAT slab_reassign_busy_deletes 0 STAT slab_reassign_running 0 STAT slabs_moved 0 STAT lru_crawler_running 0 STAT lru_crawler_starts 510 STAT lru_maintainer_juggles 204 STAT malloc_fails 0 STAT log_worker_dropped 0 STAT log_worker_written 0 STAT log_watcher_skipped 0 STAT log_watcher_sent 0 STAT bytes 0 STAT curr_items 0 STAT total_items 0 STAT slab_global_page_pool 0 STAT expired_unfetched 0 STAT evicted_unfetched 0 STAT evicted_active 0 STAT evictions 0 STAT reclaimed 0 STAT crawler_reclaimed 0 STAT crawler_items_checked 0 STAT lrutail_reflocked 0 STAT moves_to_cold 0 STAT moves_to_warm 0 STAT moves_within_lru 0 STAT direct_reclaims 0 STAT lru_bumps_dropped 0 END #测试使用命令行取出需要的数据 root@Linux:~# echo -e "stats\nquit" | ncat 10.0.0.102 11211 | grep "STAT connection_structures" STAT connection_structures 2 root@Linux:~# echo -e "stats\nquit" | ncat 10.0.0.102 11211 | grep "STAT connection_structures" | awk '{print $3}' 2 #按照上面的逻辑可以来完成脚本的编辑 root@Linux:~# vi memcache_monitor.sh #!/bin/bash memcache_status(){ M_PORT=$1 M_COMMAND=$2 echo -e "stats\nquit" | ncat 127.0.0.1 "$M_PORT" | grep "STAT $M_COMMAND" | awk '{print $3}' } main(){ case $1 in memcached_status) memcache_status $2 $3 ;; esac } main $1 $2 $3 #授权并测试脚本可用性 root@Linux:~# chmod a+x memcache_monitor.sh root@Linux:~# bash memcache_monitor.sh memcached_status 11211 curr_connections 1 root@Linux:~# bash memcache_monitor.sh memcached_status 11211 threads 43、添加zabbix agent的自定义监控项
root@Linux:~# vi /etc/zabbix/zabbix_agentd.conf root@Linux:~# grep -Ev "#|^$" /etc/zabbix/zabbix_agentd.conf PidFile=/tmp/zabbix_agentd.pid LogFile=/tmp/zabbix_agentd.log LogFileSize=0 Server=10.0.0.100,10.0.0.104 ListenPort=10050 ListenIP=0.0.0.0 StartAgents=3 ServerActive=10.0.0.104 Hostname=10.0.0.102 Timeout=30 AllowRoot=1 User=root Include=/etc/zabbix/zabbix_agentd.d/*.conf UserParameter=linux_status[*],/etc/zabbix/zabbix_agentd.d/tcp_conn_plugin.sh "$1" "$2" UserParameter=memcache_status[*],/etc/zabbix/zabbix_agentd.d/memcache_monitor.sh "$1" "$2" "$3" root@Linux:~# mv memcache_monitor.sh /etc/zabbix/zabbix_agentd.d/ root@Linux:~# systemctl restart zabbix-agent root@Linux:~# ss -tnl State Recv-Q Send-Q Local Address:Port Peer Address:Port Process LISTEN 0 1024 0.0.0.0:11211 0.0.0.0:* LISTEN 0 4096 0.0.0.0:111 0.0.0.0:* LISTEN 0 511 0.0.0.0:80 0.0.0.0:* LISTEN 0 4096 127.0.0.53%lo:53 0.0.0.0:* LISTEN 0 128 0.0.0.0:22 0.0.0.0:* LISTEN 0 128 127.0.0.1:6010 0.0.0.0:* LISTEN 0 4096 0.0.0.0:64958 0.0.0.0:* LISTEN 0 4096 0.0.0.0:46302 0.0.0.0:* LISTEN 0 64 0.0.0.0:2049 0.0.0.0:* LISTEN 0 4096 0.0.0.0:10050 0.0.0.0:* LISTEN 0 64 0.0.0.0:35654 0.0.0.0:* LISTEN 0 4096 0.0.0.0:54694 0.0.0.0:* LISTEN 0 4096 [::]:22476 [::]:* LISTEN 0 4096 [::]:111 [::]:* LISTEN 0 128 [::]:22 [::]:* LISTEN 0 4096 [::]:59638 [::]:* LISTEN 0 64 [::]:33208 [::]:* LISTEN 0 128 [::1]:6010 [::]:* LISTEN 0 4096 [::]:46462 [::]:* LISTEN 0 64 [::]:2049 [::]:*4、在zabbix server上用zabbix_get工具测试监控项数据
root@zabbix-server:~# zabbix_get -s 10.0.0.102 -p 10050 -k "memcache_status["memcached_status","11211","curr_connections"]" 1 root@zabbix-server:~# zabbix_get -s 10.0.0.102 -p 10050 -k "memcache_status["memcached_status","11211","threads"]" 45、zabbix web界面制作memcached模板
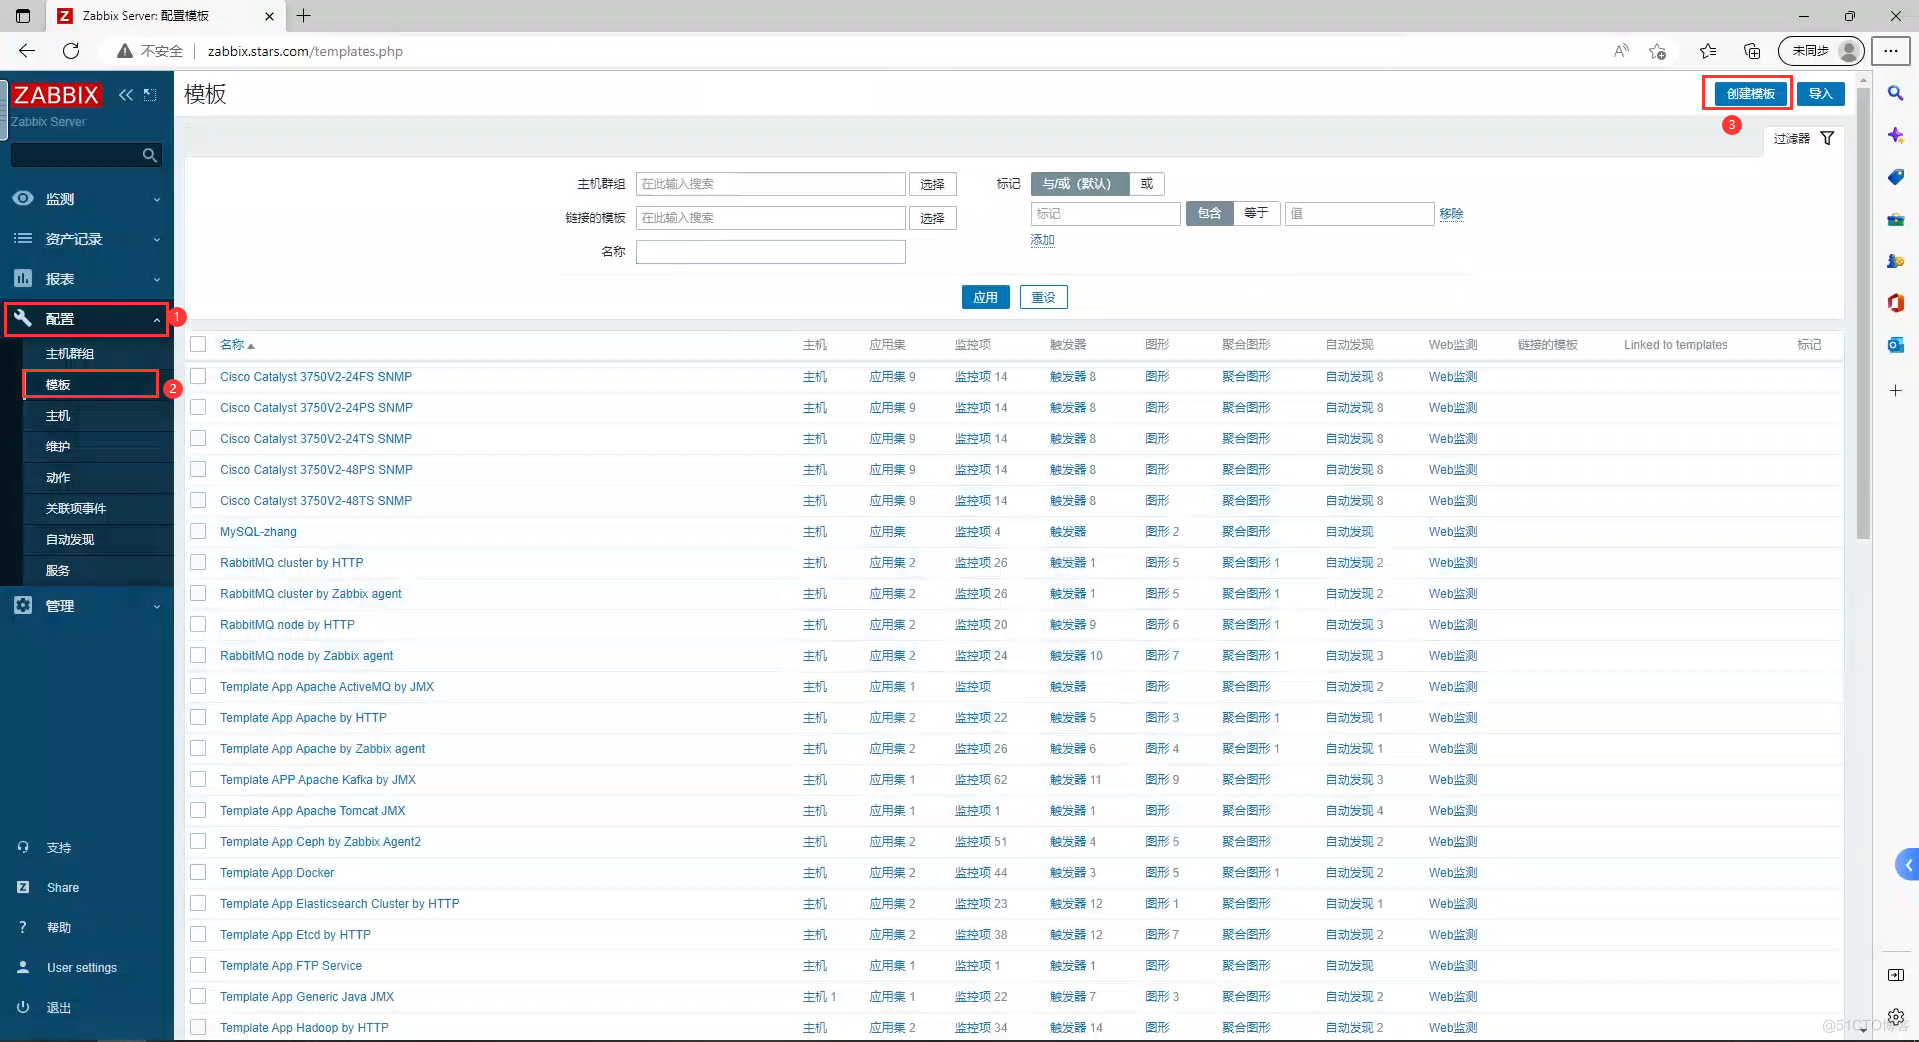
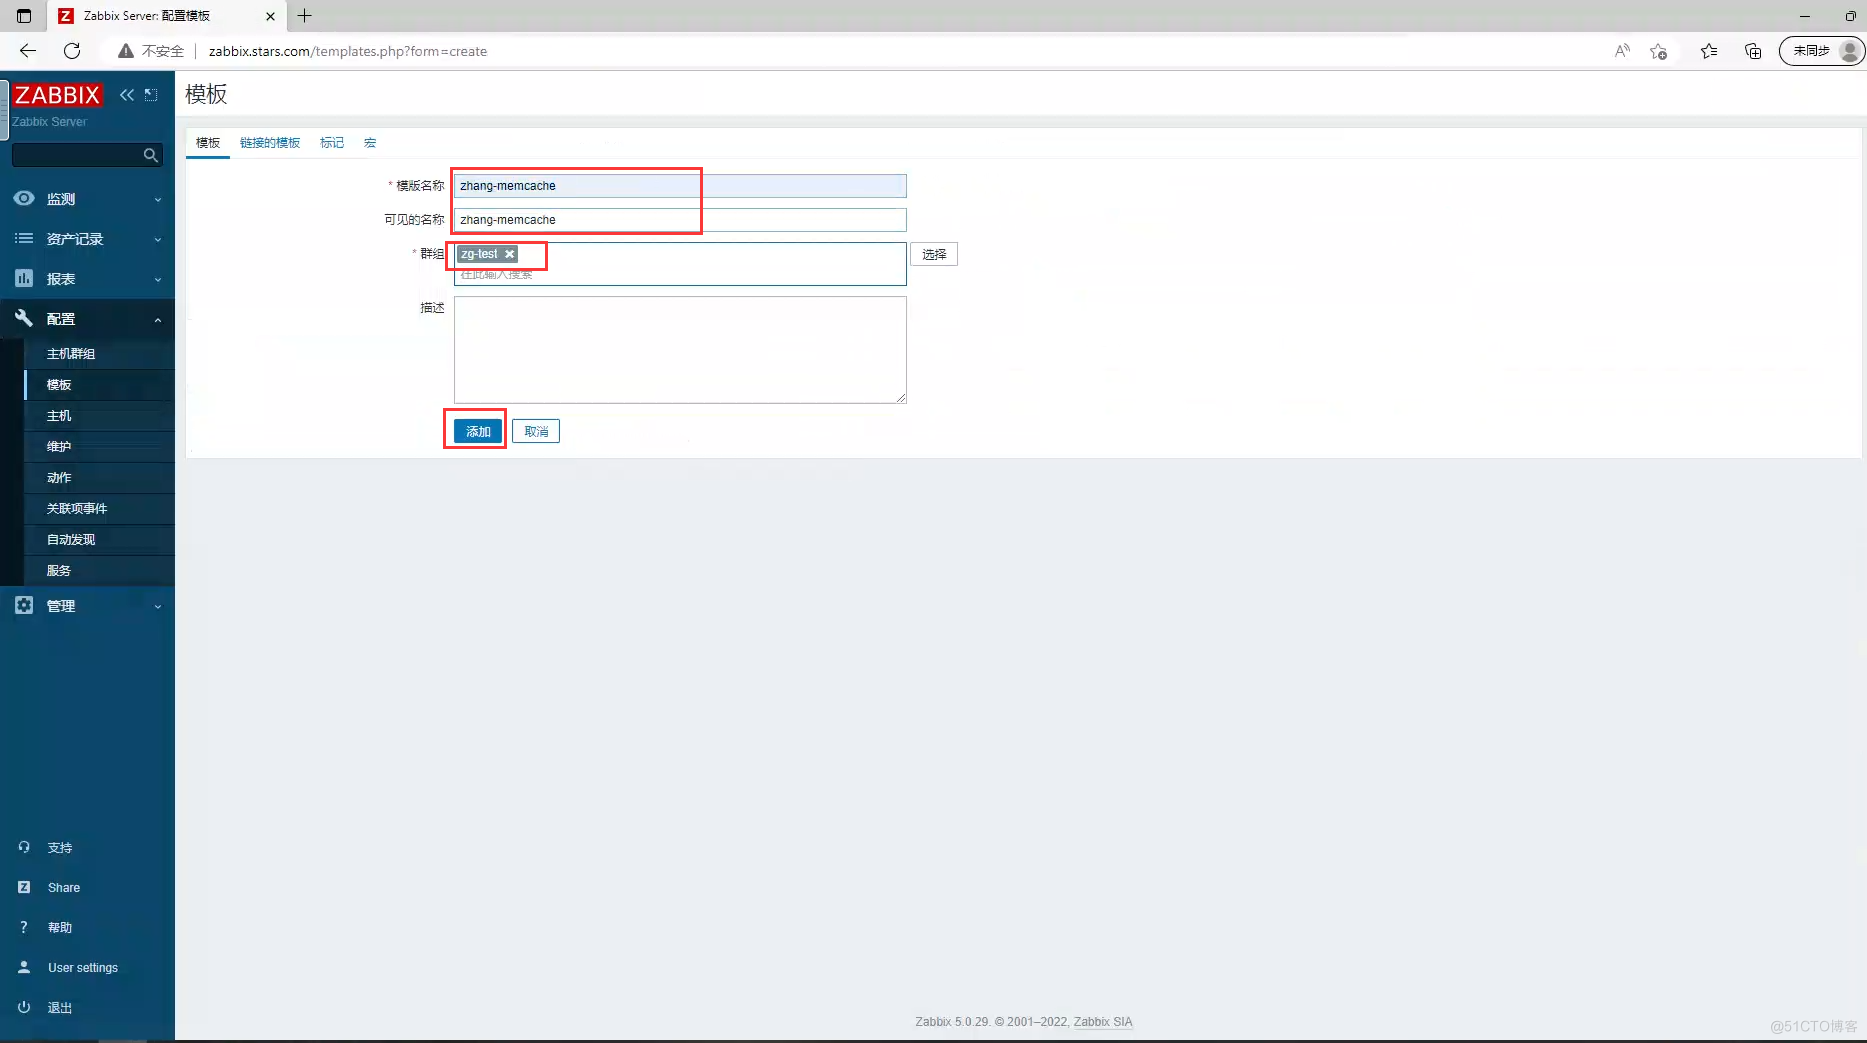
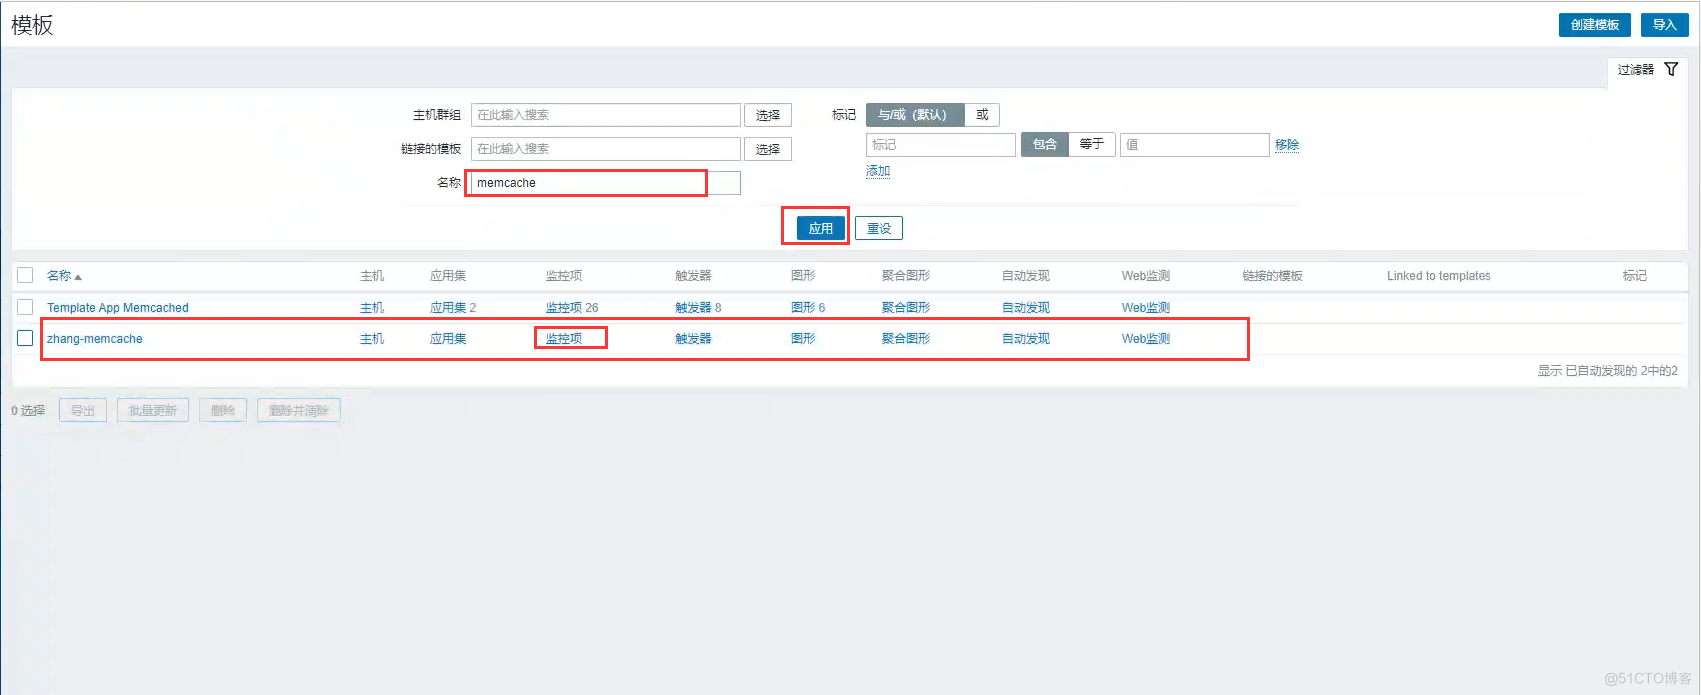
5.1、创建模板
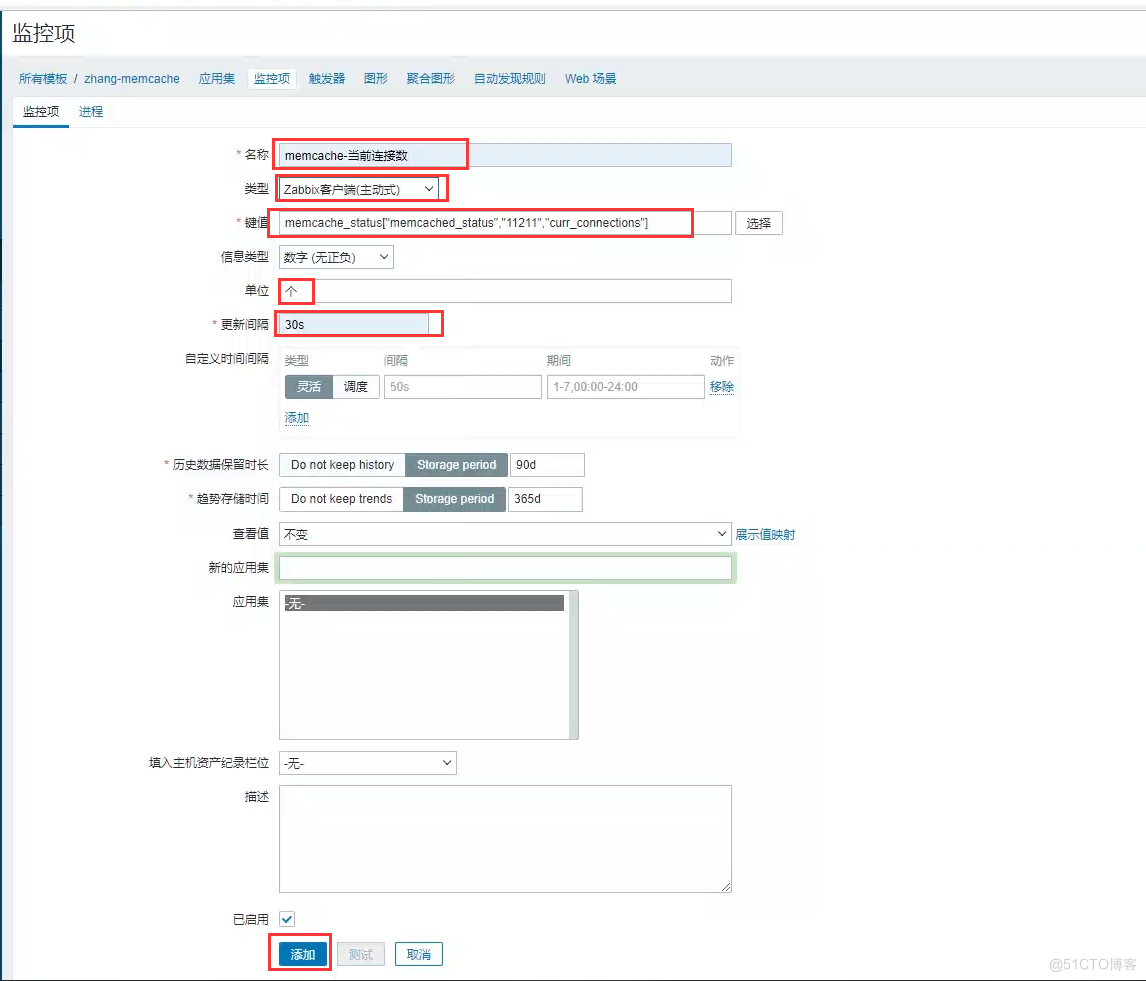
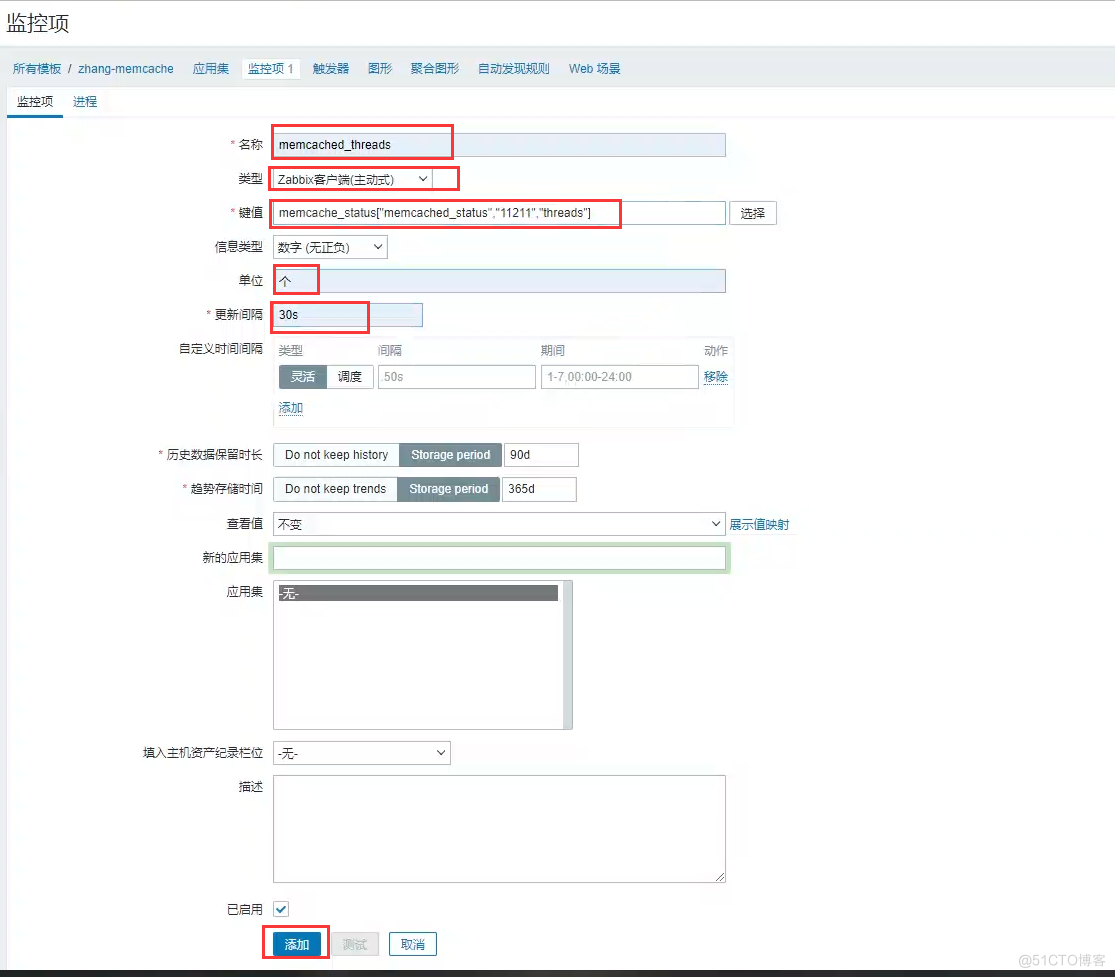
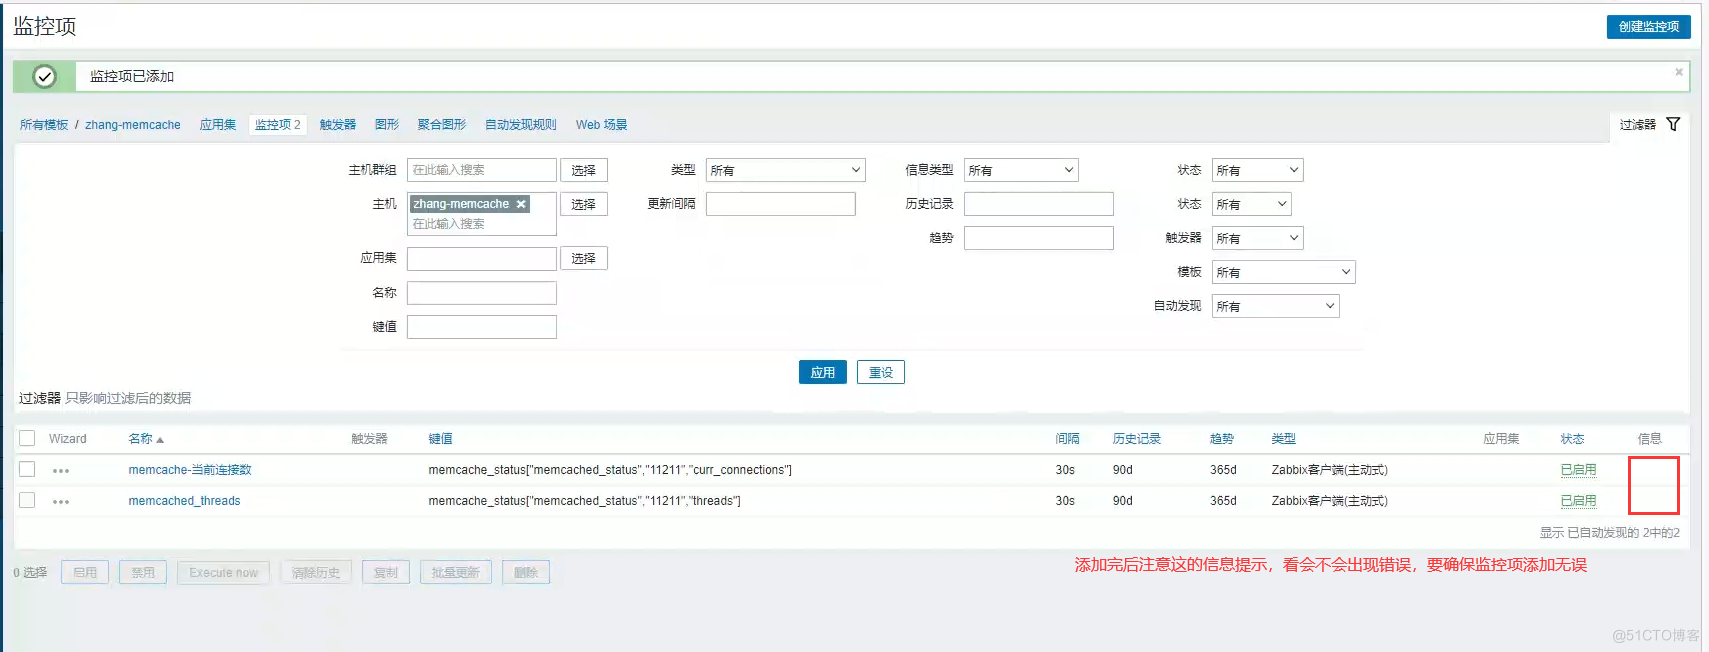
5.2、创建监控项

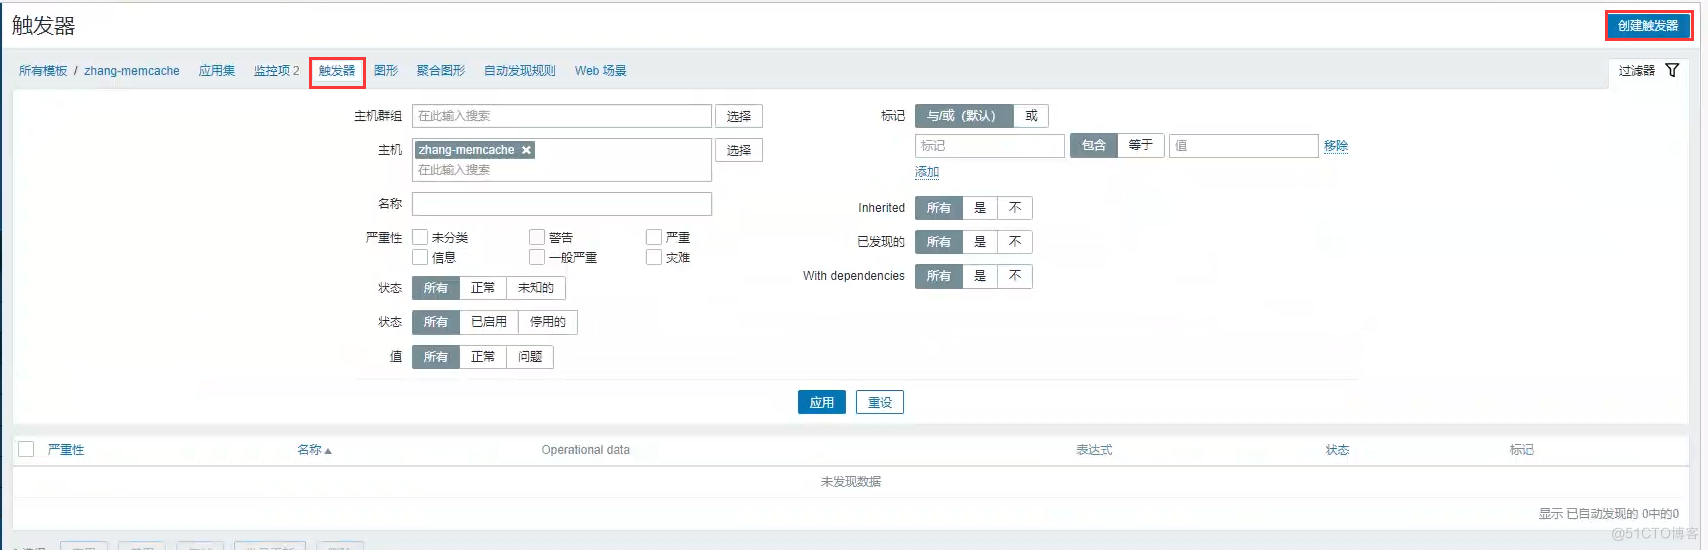
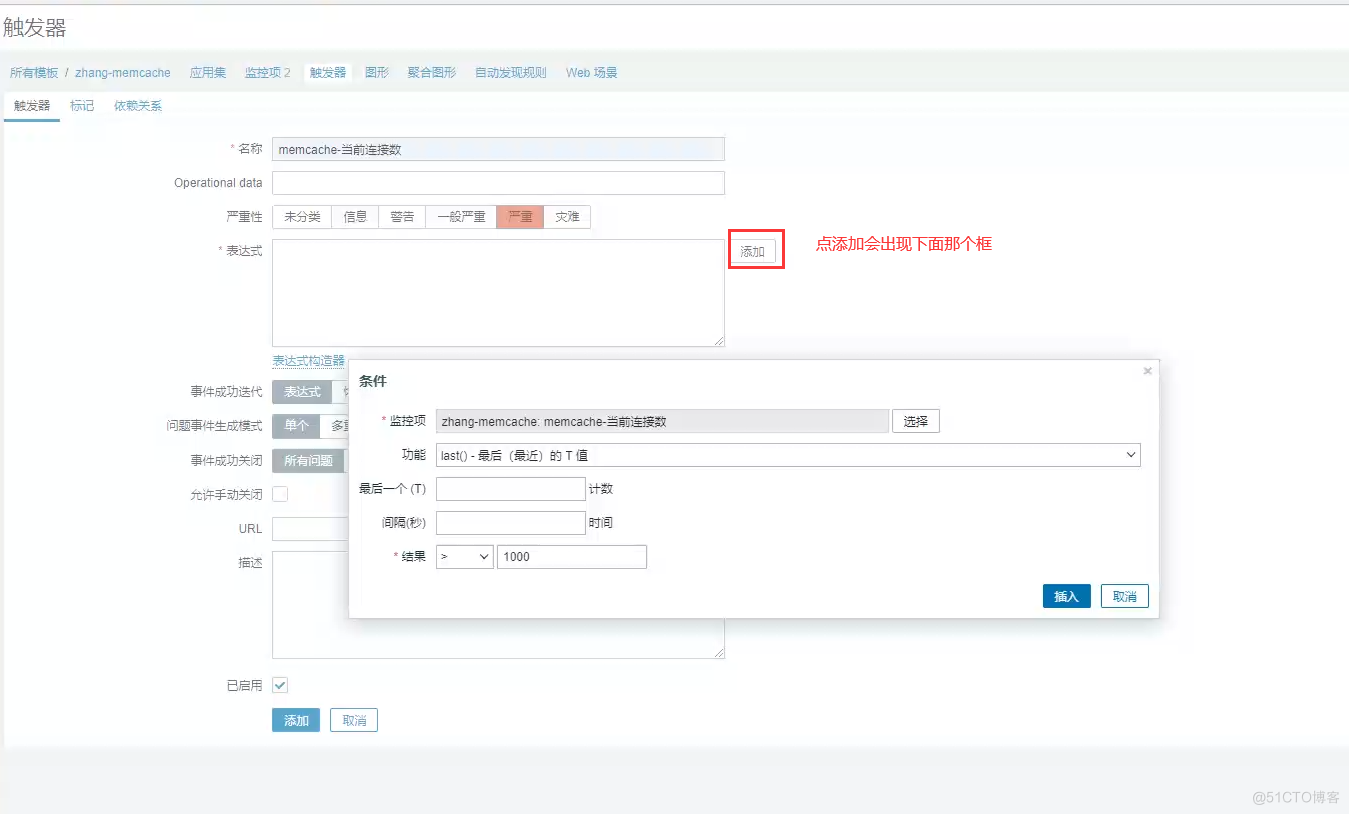
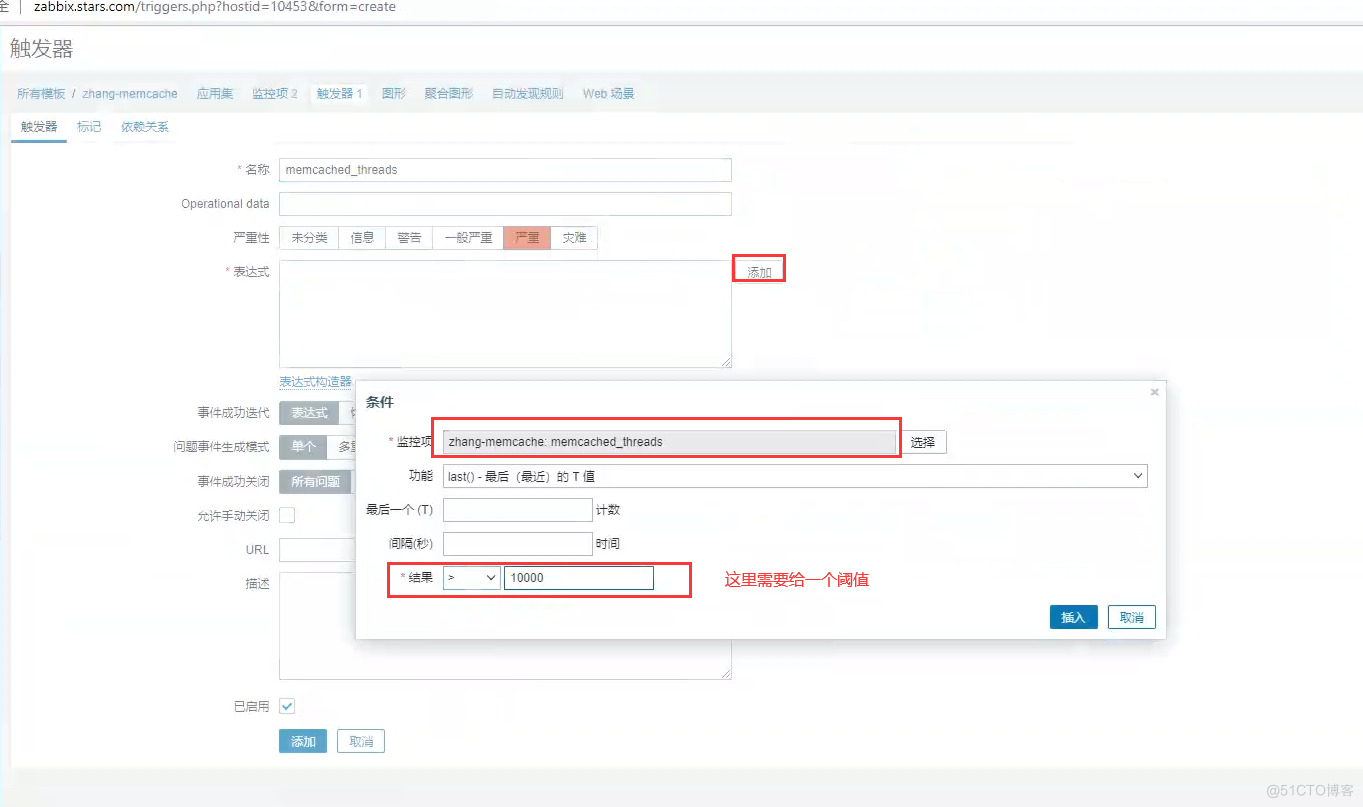
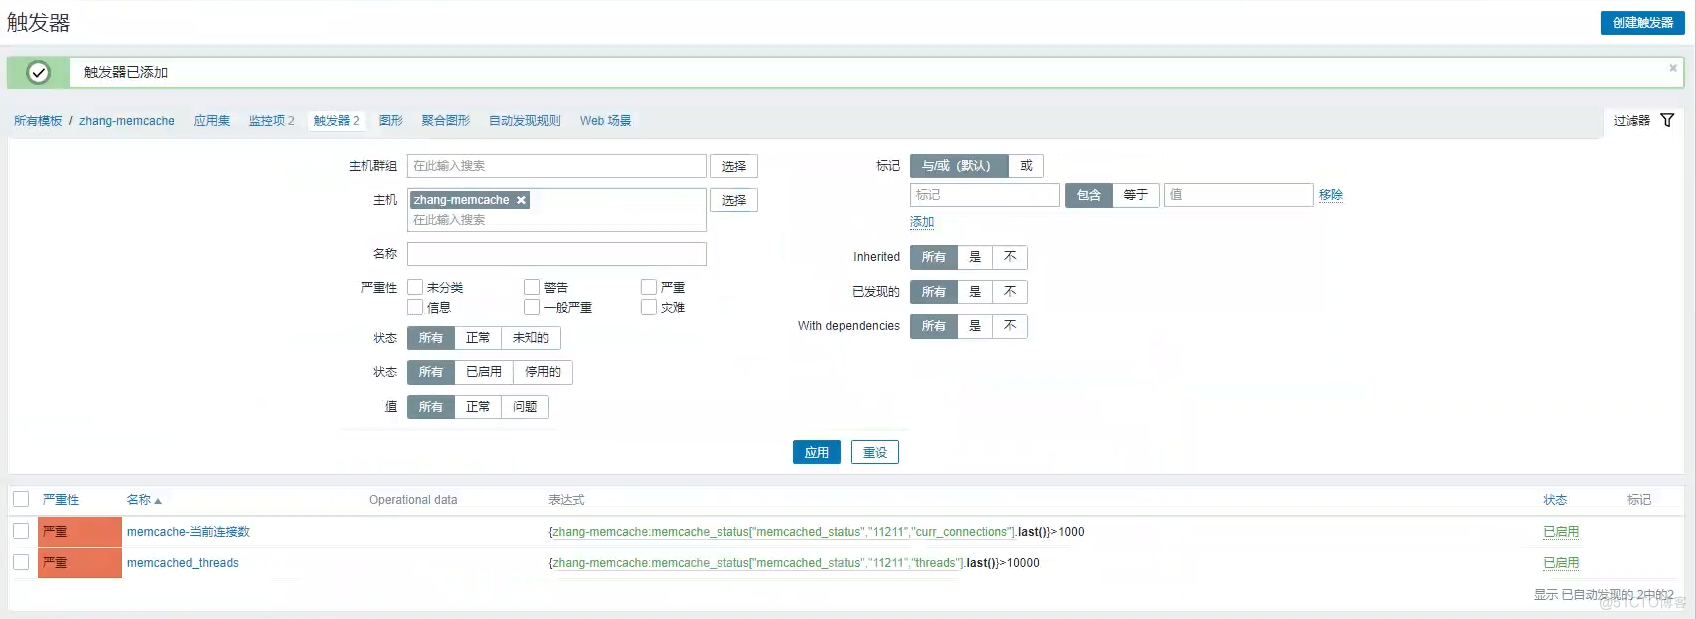
5.3、创建触发器
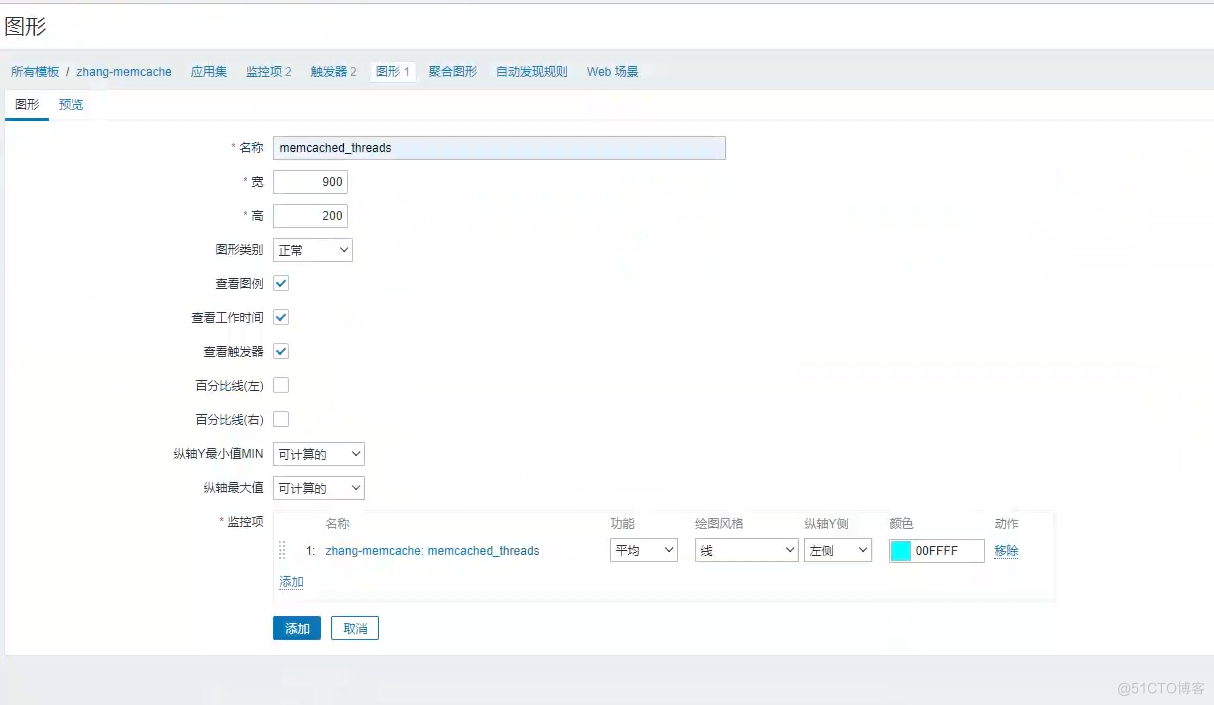
5.4、创建图形


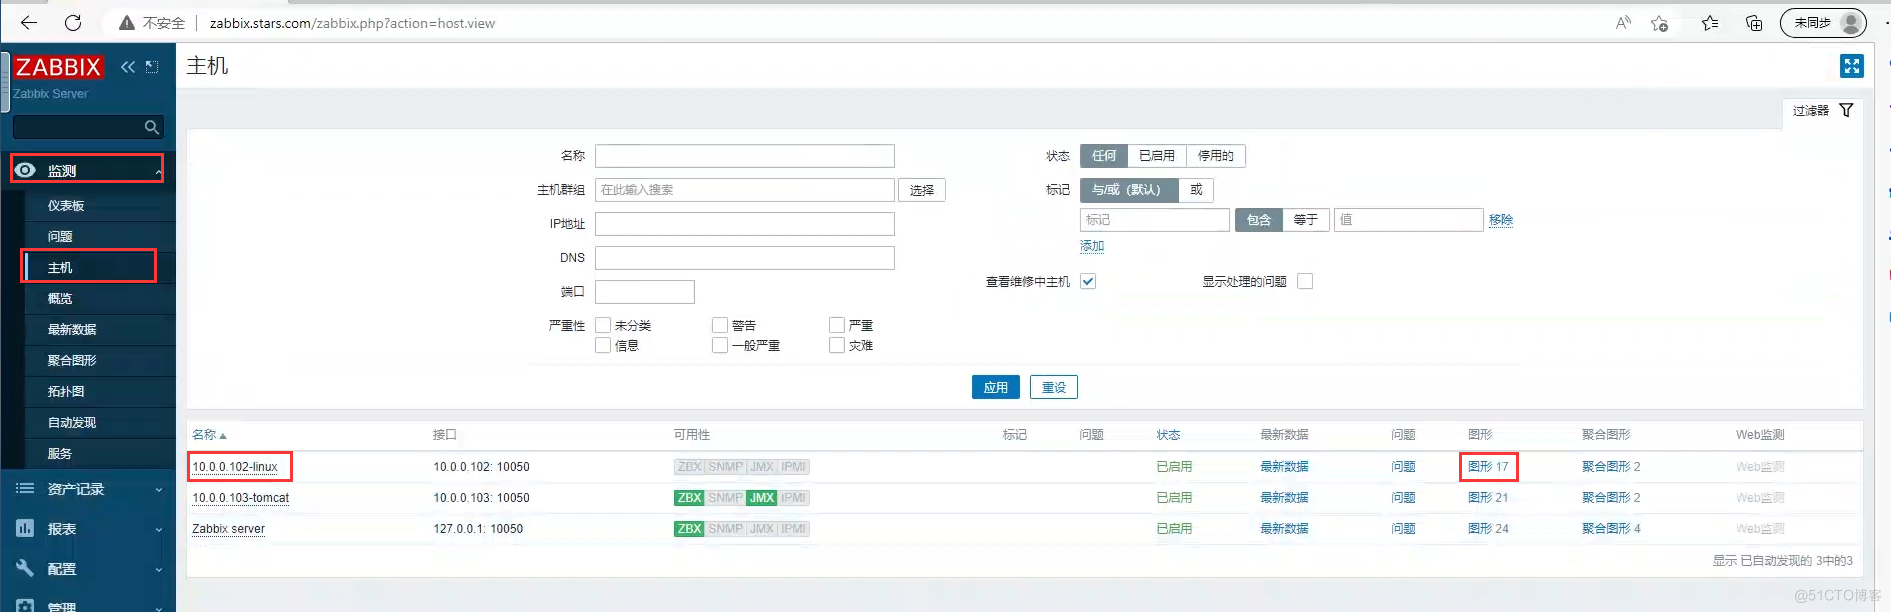
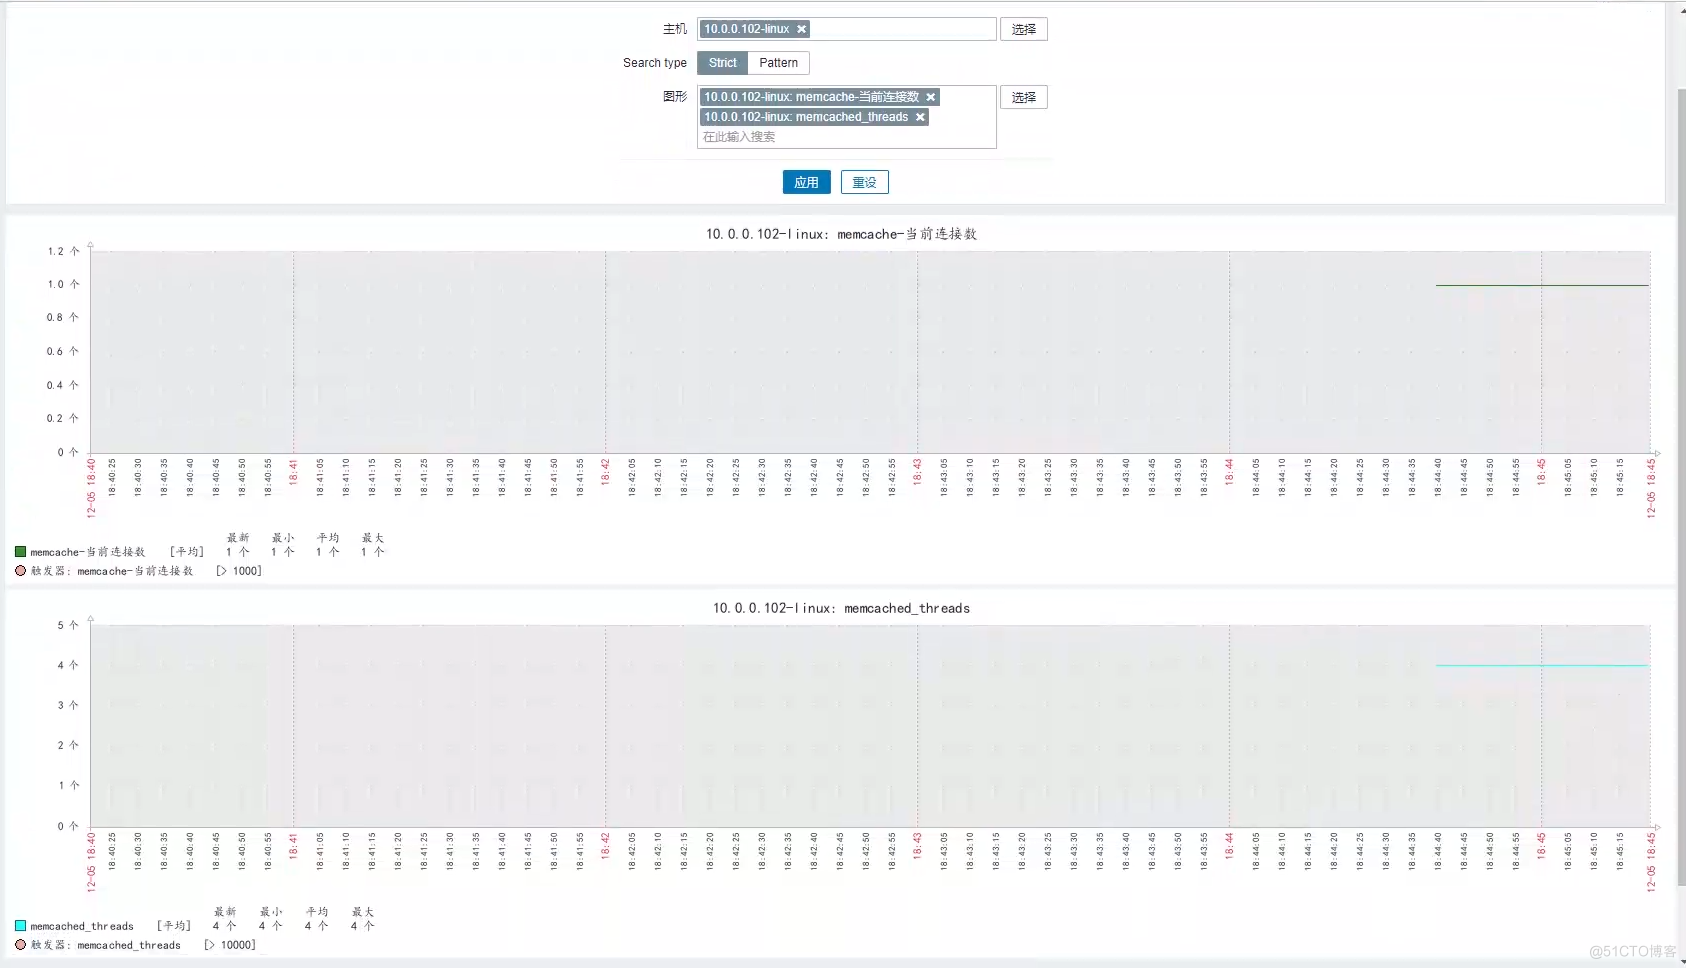
6、关联模板、验证监控数据
这个主机是我前面加好了,这里我就不重复添加了