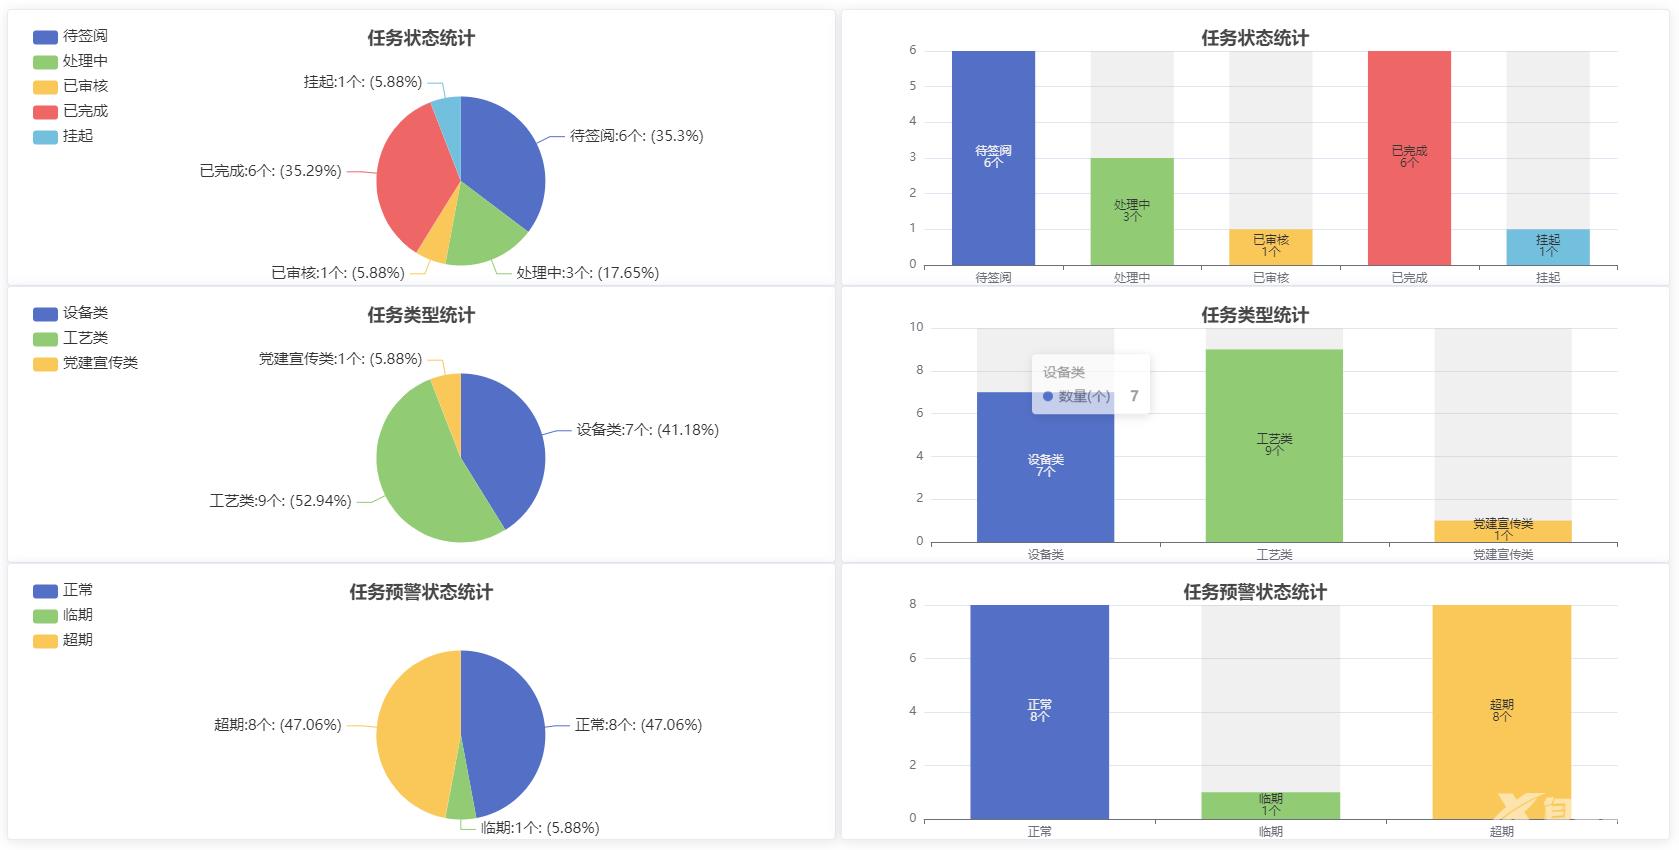
今天项目中需要使用到 echarts 为了自适应。找到了。以下解决方案、 效果图 代码 template !-- 这是图表开始 -- div class="chart" div ref="main1" style="width: 600px;height:400px;" /div div ref="main2" style="
今天项目中需要使用到 echarts 为了自适应。找到了。以下解决方案、
效果图

代码
<template>
 <!-- 这是图表开始 -->
    <div class="chart">
      <div
        ref="main1"
        style="width: 600px;height:400px;"
      ></div>
      <div
        ref="main2"
        style="width: 600px;height:400px;"
      ></div>
    </div>
    <!-- 这是图表结束 -->
</template>
<script>
// 导入echarts
import echarts from 'echarts'

export default {
  name: 'HomeIndex',
  components: {

  },
  props: {},
  data () {
    return {
    }
  },
  computed: {

  },
  watch: {

  },
  created () {

  },
  mounted () {
    var myChart1 = echarts.init(this.$refs.main1)
    var myChart2 = echarts.init(this.$refs.main2)
    var option = {
      xAxis: {
        type: 'category',
        data: ['Mon', 'Tue', 'Wed', 'Thu', 'Fri', 'Sat', 'Sun']
      },
      yAxis: {
        type: 'value'
      },
      series: [{
        data: [120, 200, 150, 80, 70, 110, 130],
        type: 'bar'
      }]
    }
    myChart1.setOption(option)
    myChart2.setOption(option)
    window.addEventListener('resize', () => { myChart1.resize() })
    window.addEventListener('resize', () => { myChart2.resize() })
    window.onresize = () => {
      clearTimeout(this.timer)
      this.timer = setTimeout(() => {
      }, 300)
    }
  },
  methods: {

  }
}
</script>
补充:下面看下VUE+ECharts 自适应宽度

card的边框,chart divwidth: '100%'
代码:
 <el-row :gutter="5" style="padding-top: 0px">
      <el-col :span="12">
        <el-card>
          <div id="myChart1" :style="{ width: '100%', height: '260px' }"></div>
        </el-card>
      </el-col>
      <el-col :span="12">
        <el-card>
          <div id="myChart2" :style="{ width: '100%', height: '260px' }"></div>
        </el-card>
      </el-col>
    </el-row>
    <el-row :gutter="5" style="padding-top: 0px">
      <el-col :span="12">
        <el-card>
          <div id="myChart3" :style="{ width: '100%', height: '260px' }"></div>
        </el-card>
      </el-col>
      <el-col :span="12">
        <el-card>
          <div id="myChart4" :style="{ width: '100%', height: '260px' }"></div>
        </el-card>
      </el-col>
    </el-row>
    <el-row :gutter="5" style="padding-top: 0px">
      <el-col :span="12">
        <el-card>
          <div id="myChart5" :style="{ width: '100%', height: '260px' }"></div>
        </el-card>
      </el-col>
      <el-col :span="12">
        <el-card>
          <div id="myChart6" :style="{ width: '100%', height: '260px' }"></div>
        </el-card>
      </el-col>
    </el-row>
以上内容转载链接:https://www.cnblogs.com/xiaosheng1989/p/16415660.html
到此这篇关于vue中的echarts实现宽度自适应的文章就介绍到这了,更多相关vue echarts宽度自适应内容请搜索易盾网络以前的文章或继续浏览下面的相关文章希望大家以后多多支持易盾网络!
