目录 一、引入ECharts 1、直接引入echarts (安装echarts项目依赖) 2、全局引入 (我们安装完成之后,可以在main.js中全局引入 echarts) 3、我们可以将Echar封装成组件的形式,方便调用 4、此时我
目录
- 一、引入ECharts
- 1、直接引入echarts (安装echarts项目依赖)
- 2、全局引入 (我们安装完成之后,可以在main.js中全局引入 echarts)
- 3、我们可以将Echar封装成组件的形式,方便调用
- 4、此时我们可以通过Echart官网引入我们需要的图
- 二、效果展示
一、引入ECharts
1、直接引入echarts (安装echarts项目依赖)
npm install echarts --save
2、全局引入 (我们安装完成之后,可以在main.js中全局引入 echarts)
import echarts from "echarts";
Vue.prototype.$echarts = echarts;
3、我们可以将Echar封装成组件的形式,方便调用
封装在组件中:封装成 Echarts.vue 文件放在ElementUI前端框架中
<template>
  <div ref="chartDom" ></div>
</template>

<script>
import * as echarts from 'echarts';
import debounce from "lodash/debounce";
import { addListener, removeListener} from "resize-detector";

export default {
  props: {
    option: {
      type: Object,
      default: ()=> {}
    }
  },
  watch: {
    // option(val) {
    //   this.chart.setOption(val);
    // },
    option: {
      handler(val) {
        this.chart.setOption(val);
      },
      deep: true
    }
  },
  created() {
    this.resize = debounce(this.resize, 300);
  },
  mounted() {
    this.renderChart();
    addListener(this.$refs.chartDom, this.resize);
  },
  beforeDestroy() {
    removeListener(this.$refs.chartDom, this.resize);
    this.chart.dispose();
    this.chart = null;
  },
  methods:{
    resize(){
      this.chart.resize();
    },
    renderChart() {
      this.chart = echarts.init(this.$refs.chartDom);
      this.chart.setOption(this.option);
    }
  },
}
</script>
<style>
</style>
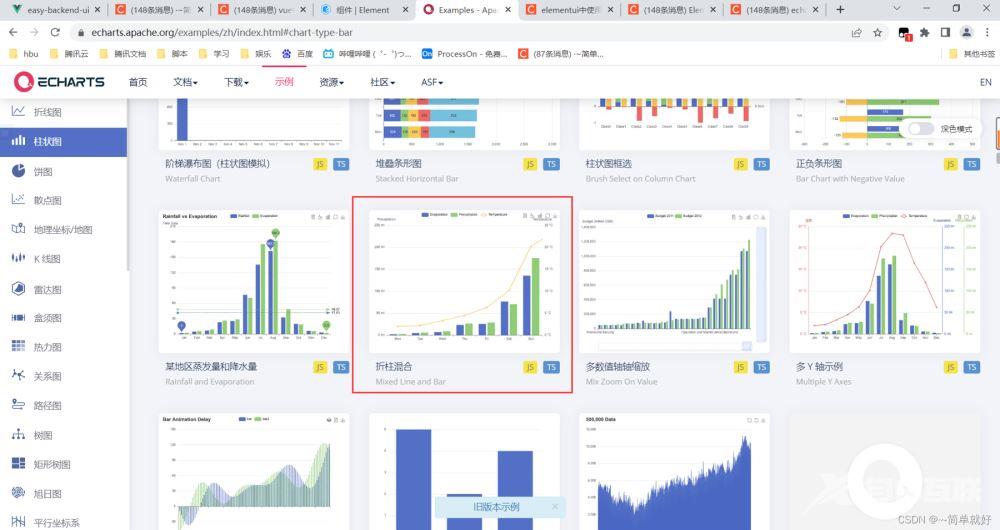
4、此时我们可以通过Echart官网引入我们需要的图
Echart官网 https://echarts.apache.org/zh/index.html
例如:以所选的折柱混合图为例
引入(需要引入Echarts刚刚封装好的组件)
从Echart官网获取对应图的代码
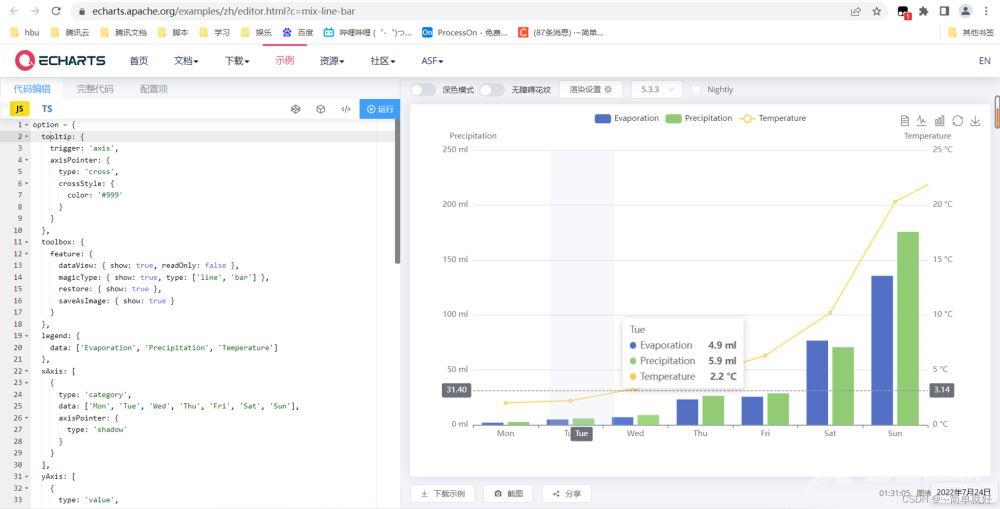
引入代码:
<template>
    <div>
        <el-row>
          <Echarts :option="option" style="height: 400px;width: 630px" />
        </el-row>
  </div>
</template>

<script>

//引入Echart的包
import Echarts from "../../components/charts/Echarts";
export default {
  components:{
    Echarts,
  },
  data(){
    return{
      option:{
  		tooltip: {
    	trigger: 'axis',
    	axisPointer: {
      	type: 'cross',
      	crossStyle: {
        color: '#999'
      }
    }
  },
  toolbox: {
    feature: {
      dataView: { show: true, readOnly: false },
      magicType: { show: true, type: ['line', 'bar'] },
      restore: { show: true },
      saveAsImage: { show: true }
    }
  },
  legend: {
    data: ['Evaporation', 'Precipitation', 'Temperature']
  },
  xAxis: [
    {
      type: 'category',
      data: ['Mon', 'Tue', 'Wed', 'Thu', 'Fri', 'Sat', 'Sun'],
      axisPointer: {
        type: 'shadow'
      }
    }
  ],
  yAxis: [
    {
      type: 'value',
      name: 'Precipitation',
      min: 0,
      max: 250,
      interval: 50,
      axisLabel: {
        formatter: '{value} ml'
      }
    },
    {
      type: 'value',
      name: 'Temperature',
      min: 0,
      max: 25,
      interval: 5,
      axisLabel: {
        formatter: '{value} °C'
      }
    }
  ],
  series: [
    {
      name: 'Evaporation',
      type: 'bar',
      tooltip: {
        valueFormatter: function (value) {
          return value + ' ml';
        }
      },
      data: [
        2.0, 4.9, 7.0, 23.2, 25.6, 76.7, 135.6, 162.2, 32.6, 20.0, 6.4, 3.3
      ]
    },
    {
      name: 'Precipitation',
      type: 'bar',
      tooltip: {
        valueFormatter: function (value) {
          return value + ' ml';
        }
      },
      data: [
        2.6, 5.9, 9.0, 26.4, 28.7, 70.7, 175.6, 182.2, 48.7, 18.8, 6.0, 2.3
      ]
    },
    {
      name: 'Temperature',
      type: 'line',
      yAxisIndex: 1,
      tooltip: {
        valueFormatter: function (value) {
          return value + ' °C';
        }
      },
      data: [2.0, 2.2, 3.3, 4.5, 6.3, 10.2, 20.3, 23.4, 23.0, 16.5, 12.0, 6.2]
    }
  ]
};
  },
  created: function () {

  },
  methods:{

  }
}
</script>
<style scoped>
</style>
二、效果展示
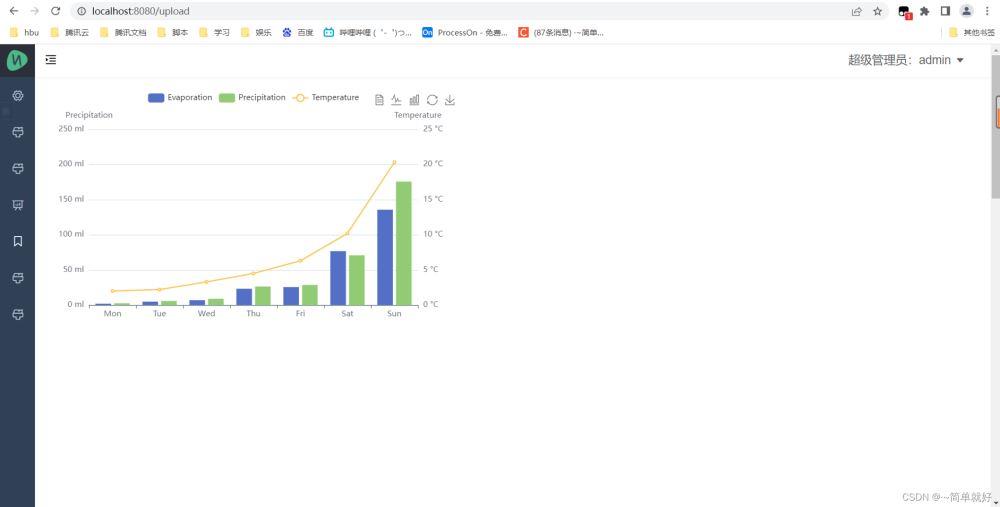
到此这篇关于Element中使用ECharts的项目实践的文章就介绍到这了,更多相关Element使用ECharts内容请搜索易盾网络以前的文章或继续浏览下面的相关文章希望大家以后多多支持易盾网络!