目录
- 前言
- 1、默认效果
- 1.1) 默认label 如下
- 1.2)默认样式代码如下
- 2、使用字符串模板进行格式化
- 2.1) 通过 formatter 进行文本的格式化,效果如下
- 2.2) 样式代码如下
- 3、使用富文本标签样式
- 4、使用回调函数进行内容格式化
- 总结
前言
最近公司项目中在使用 Echarts 绘制图表时,由于默认的 label 标签不能满足设计稿需求,所以研究了对 label标签进行格式化的方案,了解到可以使用 formatter 内容格式器对标签内容进行调整, formatter 支持字符串模板和回调函数两种形式,下面以饼图为例对 formatter 格式化标签 label标签遇到的情况记录如下
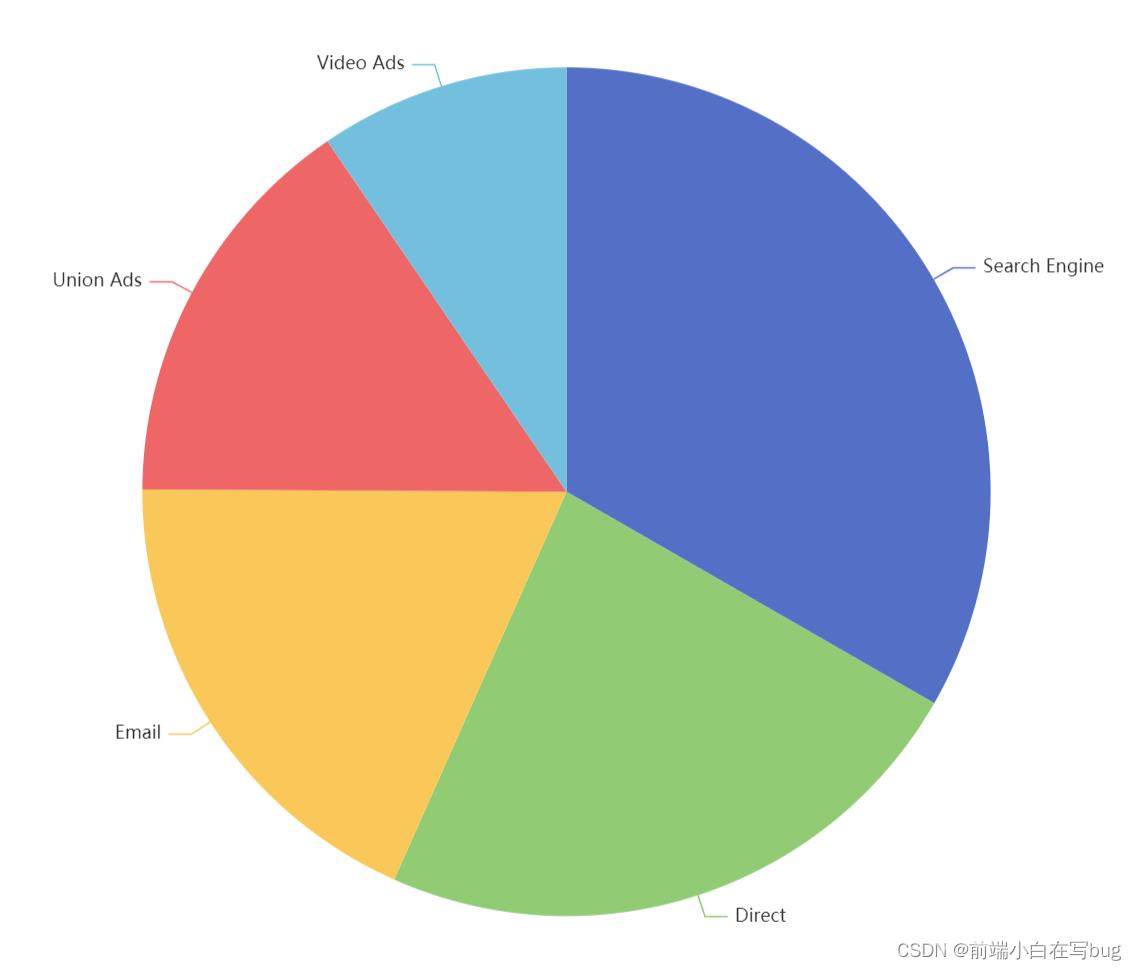
1、默认效果
1.1) 默认label 如下
1.2)默认样式代码如下
option = {
  title: {
    text: 'Referer of a Website',
    subtext: 'Fake Data',
    left: 'center'
  },
  tooltip: {
    trigger: 'item'
  },
  legend: {
    orient: 'vertical',
    left: 'left'
  },
  series: [
    {
      name: 'Access From',
      type: 'pie',
      radius: '50%',
      data: [
        { value: 1048, name: 'Search Engine' },
        { value: 735, name: 'Direct' },
        { value: 580, name: 'Email' },
        { value: 484, name: 'Union Ads' },
        { value: 300, name: 'Video Ads' }
      ],
      emphasis: {
        itemStyle: {
          shadowBlur: 10,
          shadowOffsetX: 0,
          shadowColor: 'rgba(0, 0, 0, 0.5)'
        }
      }
    }
  ]
};
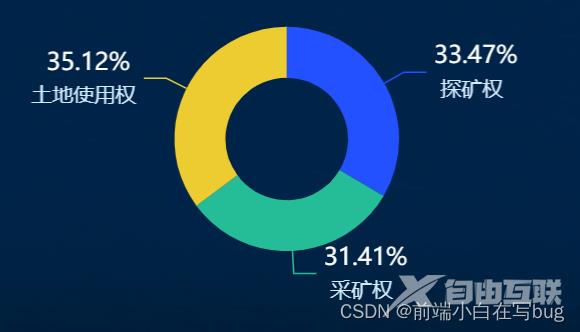
2、使用字符串模板进行格式化
2.1) 通过 formatter 进行文本的格式化,效果如下
2.2) 样式代码如下
这里使用字符串模板进行设置,其中模板变量有{a}, {b}, {c}, {d},在不同图表类型下代表含义分别为
折线图、柱状图、K线图:{a} (系列名称)、{b}(类目值),{c}(数值),{d}(无)
散点图(气泡)图 : {a}(系列名称),{b}(数据名称),{c}(数值数组), {d}(无)
地图 : {a}(系列名称),{b}(区域名称),{c}(合并数值), {d}(无)
饼图、仪表盘、漏斗图: {a}(系列名称),{b}(数据项名称),{c}(数值), {d}(百分比)
	series: [
          {
            name: "占比",
            type: "pie",
            radius: ["30%", "55%"],
            center: ["50%", "50%"],
            avoidLabelOverlap: false,
            label: {
              show: true,
              formatter: "{d|{d}%} \n {b|{b}}",
              rich: {
                d: {
                  color: '#fff',
                  fontSize: 16,
                  lineHeight: 24,
                  height: 24
                },
                b: {
                  color: "#D3EBFF",
                  fontSize: 14,
                  lineHeight: 20,
                  align: 'left',
                }
              },
              textStyle: {
                color: "#fff",
                align: "right",
                fontSize: 14,
              },
            },
            emphasis: {
              itemStyle: {
                shadowBlur: 10,
                shadowOffsetX: 0,
                shadowColor: "rgba(0, 0, 0, 0.5)",
              },
            },
            data: this.seriesData,
          },
        ],
      };
3、使用富文本标签样式
此方法可参考官网api: https://echarts.apache.org/zh/option.html#series-pie.label.formatter
3.1)虽然 label 无法设置 html 文本,echarts 提供了丰富的文本标签配置项进行样式设置,效果图如下:
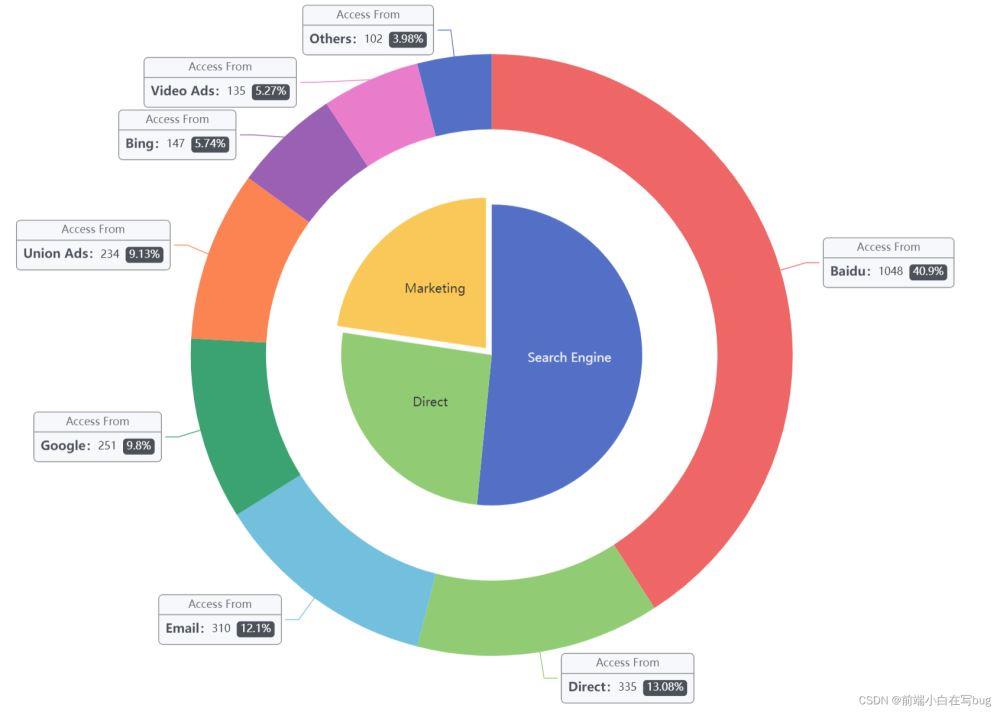
3.2) 样例代码如下:
echarts 提供了丰富的文本标签配置项,包括:
字体基本样式设置:fontStyle、fontWeight、fontSize、fontFamily
文字颜色:color
文字描边:textBorderColor、textBorderWidth
文字阴影:textShadowColor、textShadowBlur、textShadowOffsetX、textShadowOffsetY
文本块或文本片段大小:lineHeight、width、height、padding
文本块或文本片段的对齐:align、verticalAlign
文本块或文本片段的边框、背景(颜色或图片):backgroundColor、borderColor、borderWidth、borderRadius
文本块或文本片段的阴影:shadowColor、shadowBlur、shadowOffsetX、shadowOffsetY
文本块的位置和旋转:position、distance、rotate
	label: {
        formatter: '{a|{a}}\n{hr|}\n  {b|{b}:}{c}  {per|{d}%}  ',
        backgroundColor: '#F6F8FC',
        borderColor: '#8C8D8E',
        borderWidth: 1,
        borderRadius: 4,
        rich: {
          a: {
            color: '#6E7079',
            lineHeight: 22,
            align: 'center'
          },
          hr: {
            borderColor: '#8C8D8E',
            width: '100%',
            borderWidth: 1,
            height: 0
          },
          b: {
            color: '#4C5058',
            fontSize: 14,
            fontWeight: 'bold',
            lineHeight: 33
          },
          per: {
            color: '#fff',
            backgroundColor: '#4C5058',
            padding: [3, 4],
            borderRadius: 4
          }
        }
      },
4、使用回调函数进行内容格式化
4.1)通过回调函数方式可以对格式化内容进行更自由的设置,比如下面样例只有“直接访问”这个区块使用大标签,其他都是用小标签:
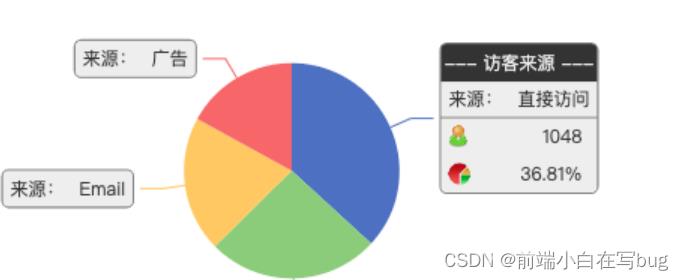
4.2) 样式代码如下:
	label: {
         normal: {
           formatter: (params) => {
             console.log(params);
             //只有“直接访问”使用大标签,其他都使用小标签
             if(params.data.name == '直接访问') {
               return '{title|' + params.seriesName +'}{abg|}\n{bTitle|来源:}{bValue|'
               + params.data.name + '}\n{hr|}\n{leftGap|}{cIcon|}{cValue|'
               + params.data.value + '}\n{leftGap|}{dIcon|}{cValue|'
               + params.percent + '%}';
             } else {
               return '{bTitle|来源:}{bValue|' + params.data.name + '}';
             }
           },
           backgroundColor: '#eee', //标签背景颜色
           borderColor: '#777',  //外层边框颜色
           borderWidth: 1, //外层边框宽度
           borderRadius: 4, //外层边框圆角
           rich: {
             title: {
               color: '#eee',
               align: 'center'
             },
             abg: {
              backgroundColor: '#333',
              width: '100%',
              align: 'right',
              height: 25,
              borderRadius: [4, 4, 0, 0]
            },
            bTitle: {
              color: '#333',
              height: 24,
              padding: [0, 5, 0, 5],
              align: 'left'
            },
            bValue: {
              color: '#333',
              height: 24,
              padding: [0, 5, 0, 5],
              align: 'right'
            },
            hr: {
              borderColor: '#777',
              width: '100%',
              borderWidth: 0.5,
              height: 0
            },
            leftGap: {
              width:5,
              align: 'left',
            },
            cIcon: {
              height: 15,
              align: 'left',
              margin: [0, 5, 0, 5],
              backgroundColor: {
                 image: '/static/countIcon.png'
              }
            },
            cValue: {
              height: 25,
              padding: [0, 10, 0, 30],
              align: 'right'
            },
            dIcon: {
              height: 15,
              align: 'left',
              backgroundColor: {
                 image: '/static/percentIcon.png'
              }
            },
            dValue: {
              height: 25,
              padding: [0, 10, 0, 30],
              align: 'right'
            },
           }
         }
总结
到此这篇关于Echarts如何自定义label标签的样式的文章就介绍到这了,更多相关Echarts自定义label标签样式内容请搜索自由互联以前的文章或继续浏览下面的相关文章希望大家以后多多支持自由互联!