本期为 知乎热榜/微博热搜时序图 系列文章 下篇 内容,【上篇】给大家介绍了如何使用Python定时爬取知乎热榜/微博热搜数据,今天给大家介绍如何使用pyecharts制作热榜数据时间序列图
本期为<知乎热榜/微博热搜时序图>系列文章下篇内容,【上篇】给大家介绍了如何使用Python定时爬取知乎热榜/微博热搜数据,今天给大家介绍如何使用pyecharts制作热榜数据时间序列图(动态轮播图),希望对你有所帮助。
先看看效果(不同播放速度):
names = ['詹姆斯', '杜兰特', '库里', '欧文', '哈登']
allinfo = [[[492, 610, 533, 416, 565, 639, 709, 465, 472], [387, 551, 488, 511, 514, 646, 747, 454, 636], [1683, 2036, 2089, 1743, 1920, 1954, 2251, 1505, 1544]], [[533, 527, 640, 598, 178, 589, 513, 464, 497], [214, 231, 374, 445, 110, 361, 300, 366, 457], [2161, 1850, 2280, 2593, 686, 2029, 1555, 1792, 2027]], [[88, 314, 334, 341, 430, 353, 261, 369, 26], [138, 539, 666, 619, 527, 524, 310, 361, 33], [383, 1786, 1873, 1900, 2375, 1999, 1346, 1881, 104]], [[191, 216, 259, 237, 157, 230, 227, 335, 103], [275, 350, 433, 389, 250, 418, 306, 464, 128], [944, 1325, 1478, 1628, 1041, 1816, 1466, 1596, 548]], [[252, 379, 344, 459, 501, 659, 389, 518, 387], [229, 455, 446, 565, 612, 907, 630, 586, 450], [1044, 2023, 1851, 2217, 2376, 2356, 2191, 2818, 2096]]]
数据来自之前的一篇文章:
【NBA官方球衣销量榜“詹皇”居首,快看看你的偶像排第几】
时序图代码:
y1 = []
y2 = []
y3 = []
for i in range(9):
    y_trb_sorce = []
    y_ast_sorce = []
    y_pts_sorce = []
    for j in range(5):
        y_trb_sorce.append(allinfo[j][0][i])
        y_ast_sorce.append(allinfo[j][1][i])
        y_pts_sorce.append(allinfo[j][2][i])
    y1.append(y_pts_sorce)
    y2.append(y_ast_sorce)
    y3.append(y_trb_sorce)

years = ['11-12赛季', '12-13赛季', '13-14赛季', '14-15赛季', '15-16赛季', '16-17赛季', '17-18赛季', '18-19赛季', '19-20赛季']
tl = Timeline()
for i in range(9):
    bar = (
        Bar()
            .add_xaxis(names)
            .add_yaxis('得分', y1[i])
            .add_yaxis('助攻', y2[i])
            .add_yaxis('篮板', y3[i])
            .set_global_opts(title_opts=opts.TitleOpts("{}三项数据".format(years[i])))
    )
    tl.add(bar, "{}".format(years[i]))
tl.render_notebook()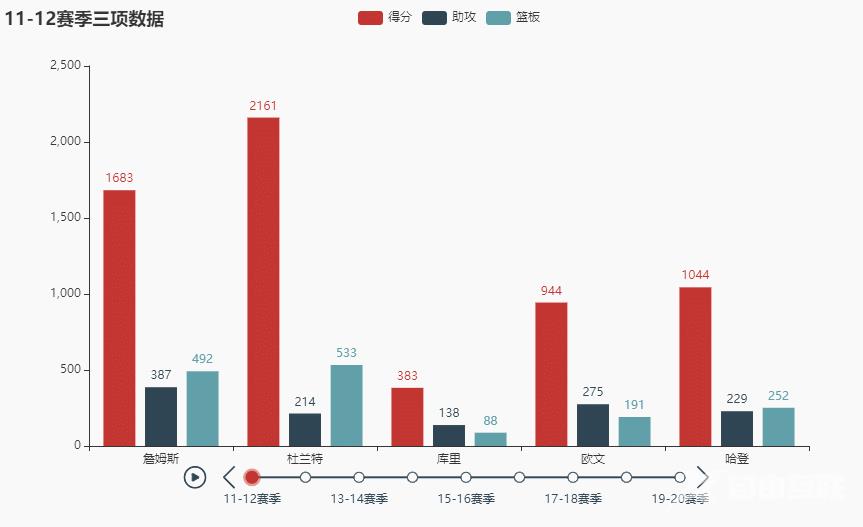
2.1 读取数据
weibo_data = pd.read_csv('weibo_hot_datas.csv')
weibo_data.head()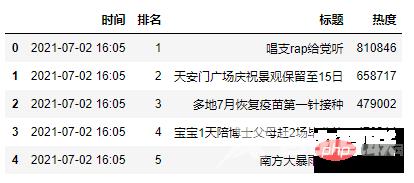
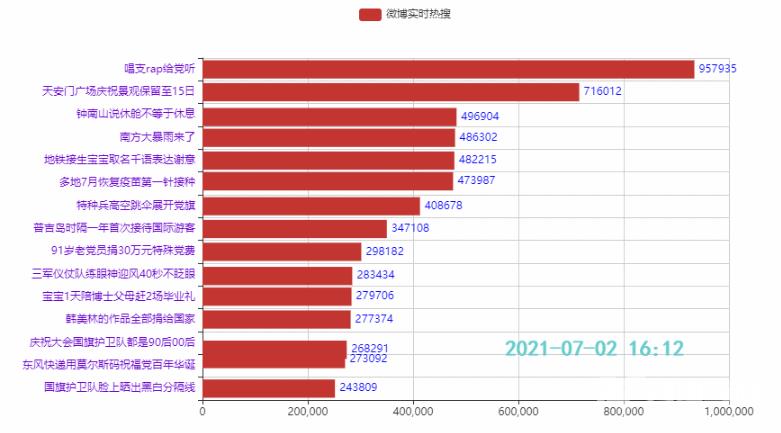
2.2 排名前15的热点
代码:
tl = Timeline()
count = 50
time_data_counts = int(weibo_data.shape[0]/count)
times = weibo_data['时间'].values.tolist()
for i in range(time_data_counts):
    bar = (
        Bar()
            .add_xaxis(list(weibo_data['标题'])[i*count:i*count+15][::-1])
            .add_yaxis('微博热搜', list(weibo_data['热度'])[i*count:i*count+15][::-1])
            .reversal_axis()
            .set_global_opts(title_opts=opts.TitleOpts('{}'.format(times[i*count])))
    )
    tl.add(bar, "{}".format(times[i*count]))
tl.render_notebook()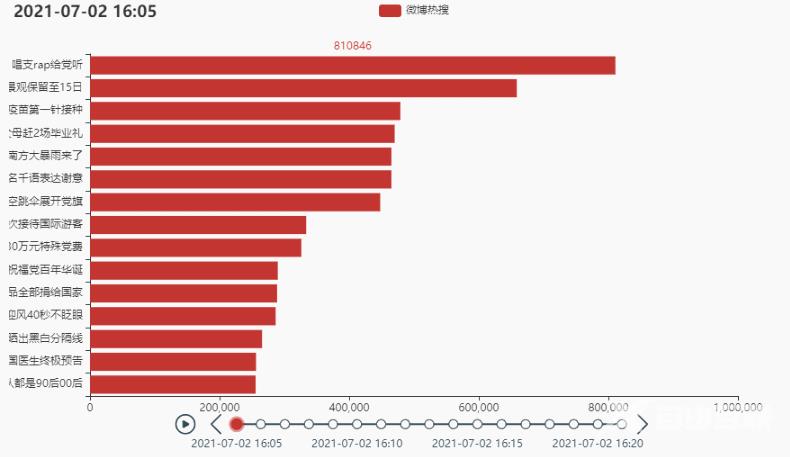
2.3 调整边距
代码:
# 将图形整体右移
grid = (
    Grid()
    .add(bar, grid_opts=opts.GridOpts(pos_left='30%', pos_right='10%'))
)
tl.add(bar, "{}".format(times[i*count]))
tl.add(grid, '')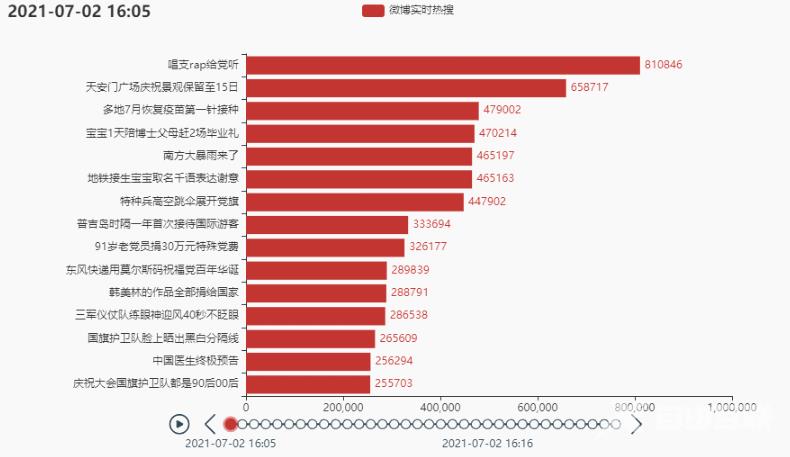
2.4 定制主题,增加图标,设置播放速度
效果:

zhihu_data = pd.read_csv('zhuhu_hot_datas.csv')
zhihu_data.head()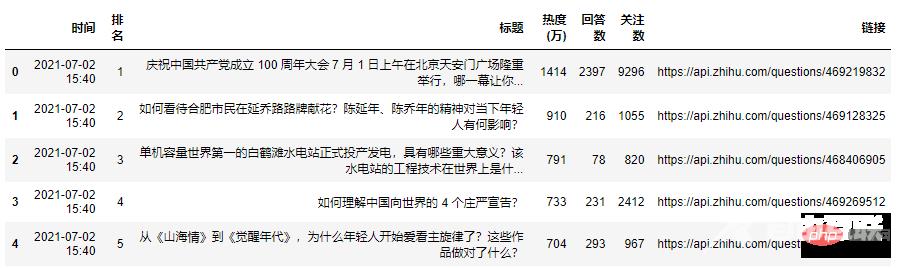
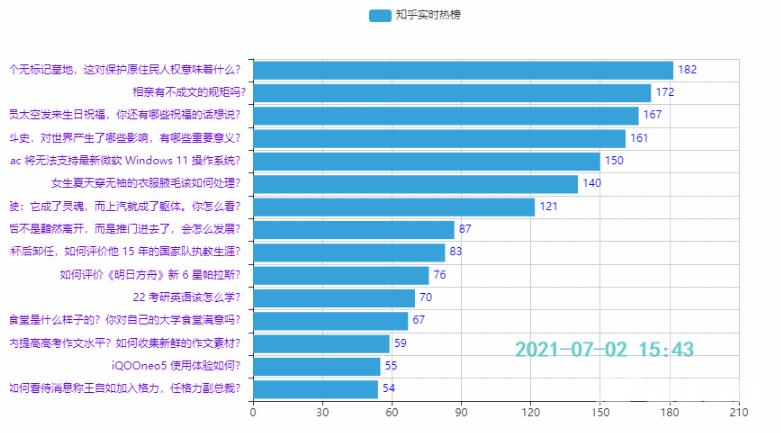
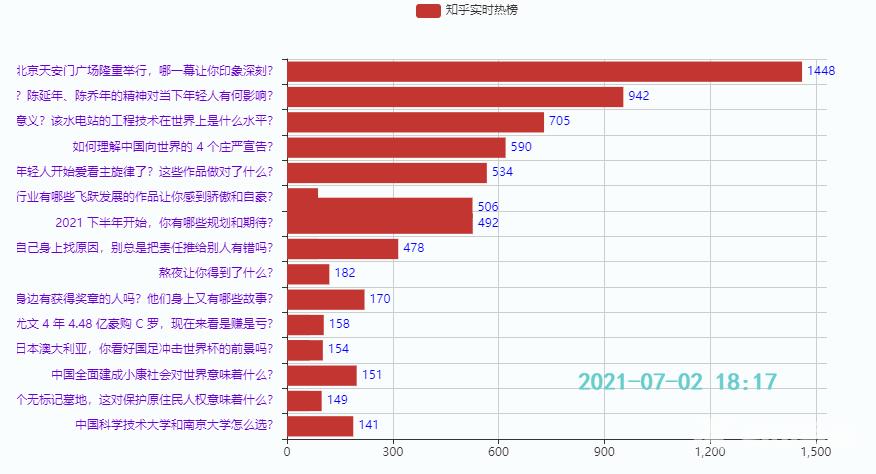
3.2 排名前15的热点
效果:
3.3 排名后15的热点
效果:

本期主要是给小伙伴们提供一个制作时序图的思路,代码重复比较多,知乎热榜代码就没贴出来了,如果需要可以在下面链接查看代码(上篇+下篇),也可以在线运行:
https://www.heywhale.com/mw/project/60dd1932ee16460017a49d57