标签(空格分隔): Prometheus系列 一: Prometheus 的介绍与架构 1.1 Prometheus 的概述 1.prometheus 的介绍Prometheus是一个开源的系统监控和告警工具包,最初由SoundCloud开发。自2012年开始,许多
标签(空格分隔): Prometheus系列
一: Prometheus 的介绍与架构
1.1 Prometheus 的概述
1.prometheus 的介绍
Prometheus是一个开源的系统监控和告警工具包,最初由SoundCloud开发。自2012年开
始,许多公司和组织开始使用了Prometheus,该项目拥有非常活跃的开发者和用户社区。
Prometheus现在是一个独立的开源项目,独立于任何公司进行维护。为了强调这一点,并澄
清项目的治理结构,Prometheus在2016年加入了云原生计算基金会(CNCF),成为继
Kubernetes之后的第二个托管项目,也是从CNCF第二个毕业的项目。

2. Prometheus的主要特征:

2.1 Prometheus使用的是 度量(metric)名称和键/值对标签(label)的时间序列数据,是一种多
维的数据模型。
2.2 PromQL是一种灵活的查询语言,可以利用度量(metric)名称和标签进行查询、聚合。
2.3 不依赖于分布式存储,单个Prometheus服务也是自治理的。
2.4 使用基于HTTP的拉(pull)模型进行时间序列的数据收集。
2.5 同时也支持通过一个中间网关(pushgateway)来推送时间序列。
2.6 目标对象(主机)是通过静态配置或者服务发现来添加的。
2.7 支持多种图形模式和仪表盘。

3. prometheus的组件

Prometheus目前已经是一个生态系统,具有众多的可选组件。
3.1 Prometheus Server 本身用于抓取并存储时间序列数据。
3.2 客户端程序库用于检测各种编程语言编写的程序代码。
3.3 pushgateway用于支持短生命周期(short-lived)的作业(job)。
3.4 可以针对不同的服务提供对应的导出器(exporters)用于采集度量数据,如HAProxy、MySQL等服务。
3.5 用于告警的alertmanager组件
3.6 各种支持工具。
备注:大多数Prometheus组件都是用Go编写的,这使得它们很容易以静态二进制文件的形式
构建和部署。

prometheus 的官网:
          https://prometheus.io/
1.2 prometheus 的 架构
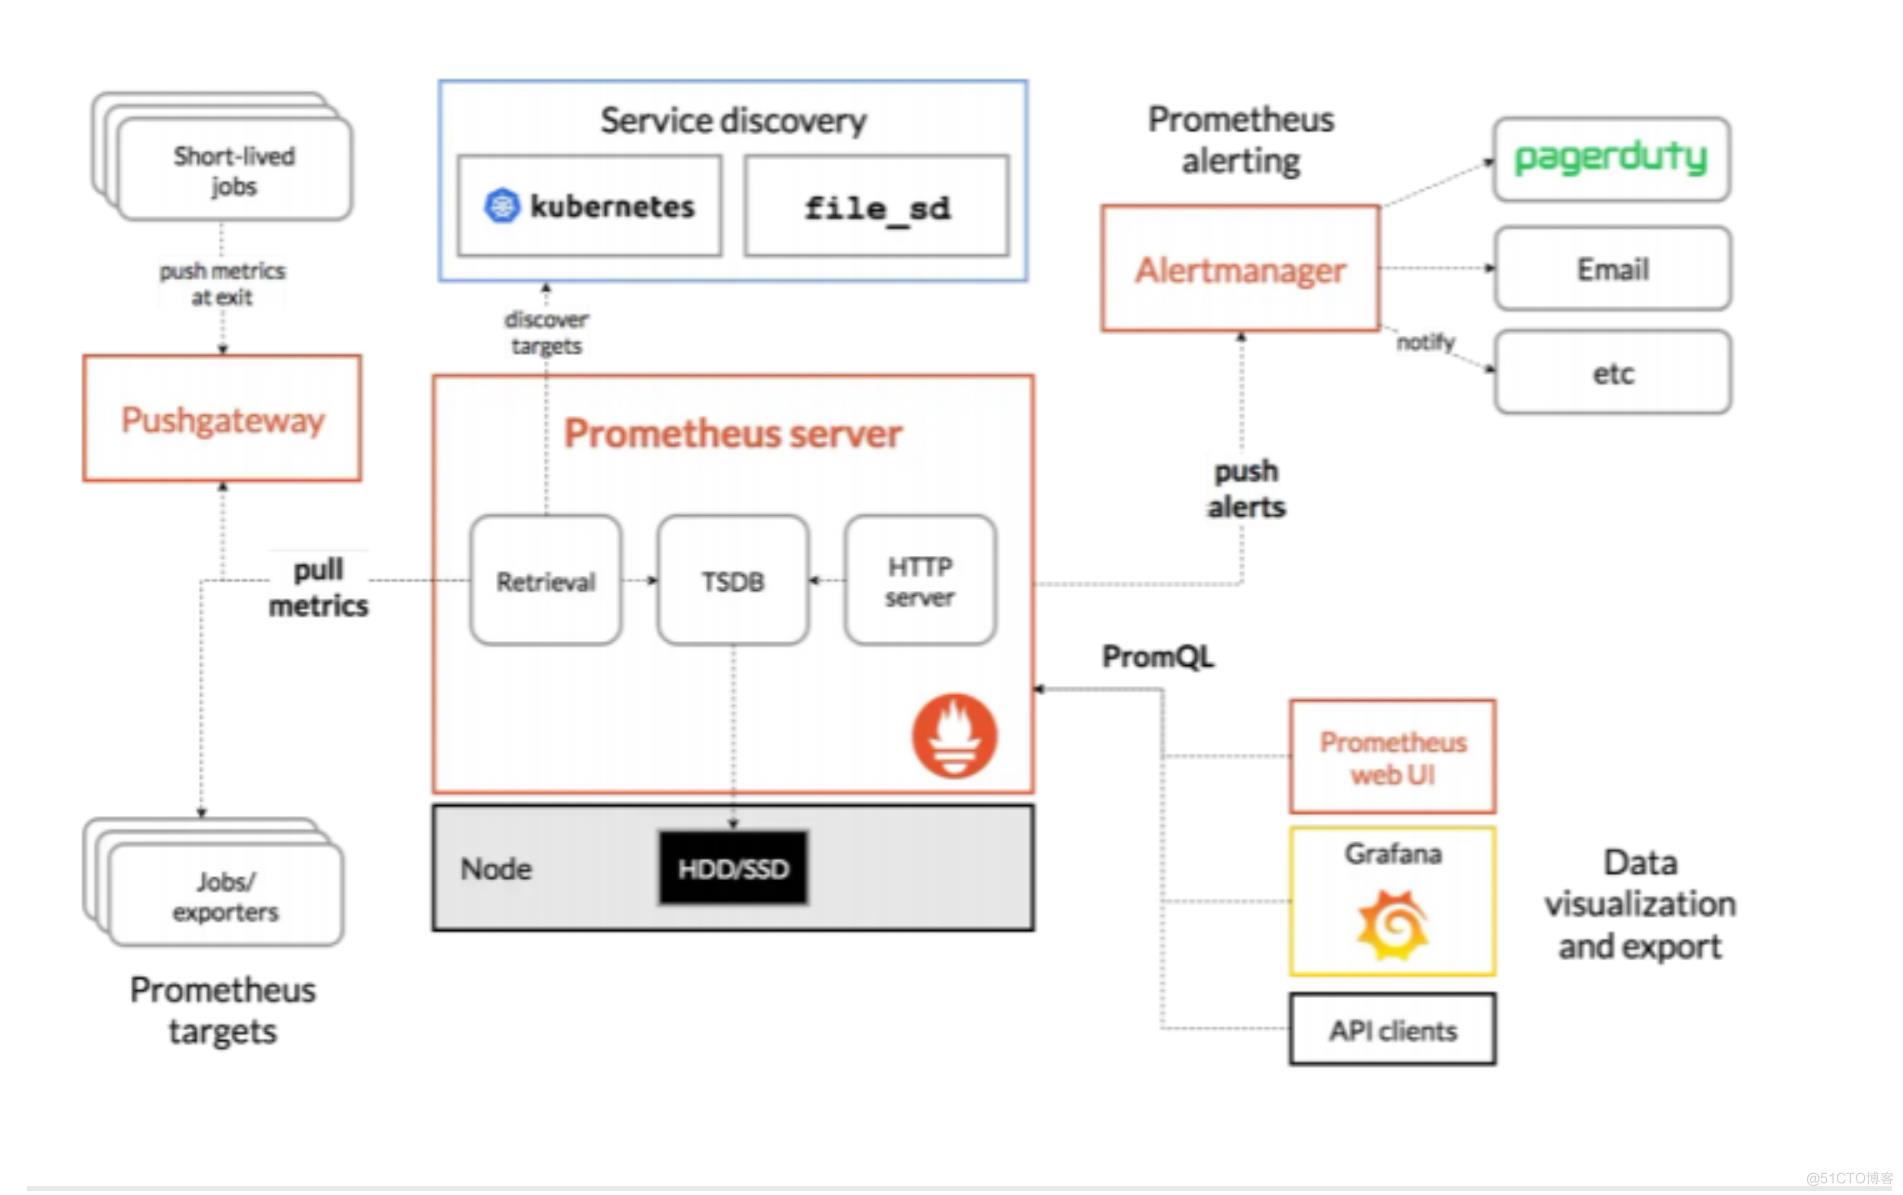
从上述架构图我们可以知道,Prometheus通过从Jobs/exporters中拉取度量数据;而短周期
的jobs在结束前可以先将度量数据推送到网关(pushgateway),然后Prometheus再从
pushgateway中获取短周期jobs的度量数据;还可以通过自动发现目标的方式来监控
kubernetes集群。所有收集的数据可以存储在本地的TSDB数据库中,并在这些数据上运行规
则、检索、聚合和记录新的时间序列,将产生的告警通知推送到Alertmanager组件。通过
PromQL来计算指标,再结合Grafana或其他API客户端来可视化数据。
Prometheus主要用于大规模的云端环境和容器化微服务(k8s)的监控,通过拉取(pull)应用程
序暴露出来的HTTP接口或exporter来获取时间序列数据。
Prometheus不适用于对监控要求100%准确的度量数据,比如每个请求的账单,因为收集的
数据可能还不够详细和完整。
Prometheus将其可以拉取指标的来源称为endpoint(端点),endpoint可以是各种
exporter(导出器)或应用程序。然后,为了拉取endpoint里的数据,Prometheus定义了名为
target(目标)的配置,告诉拉取时要如何进行连接等信息,多个具有相同功能角色的target组
合在一起就构成了一个job(作业),例如,具有相同用途的一组主机的资源监控器
(node_exporter),又或者是MySQL数据库监控器(mysqld_exporter)。
Prometheus默认是将收集到的时间序列数据存储在本地tsdb数据库中,且默认只保留15天,
也可以配置发送到其他时间序列数据库中。
二:thanos 的介绍
2.1 thanos 的概述
Thanos是基于Prometheus的具有高可用(HA)、存储持久化,多集群查询功能的监控解决方案。选择Thanos的主要原因:

· 所有组件都是无状态的(stateless)

· 监控数据和所有状态信息被持久化到对象存储(OSS)

· 服务之间通过稳定的StoreAPI对接

· 支持高可用的Prometheus部署(防止Prometheus单点故障)


thanos 的官网: https://thanos.io/
2.2 thanos 的架构
thanos 是一个基于 Prometheus 实现的监控方案,其主要设计目的是解决原生 Prometheus 上的痛点,并且做进一步的提升,
主要的特性有:全局查询,高可用,动态拓展,长期存储
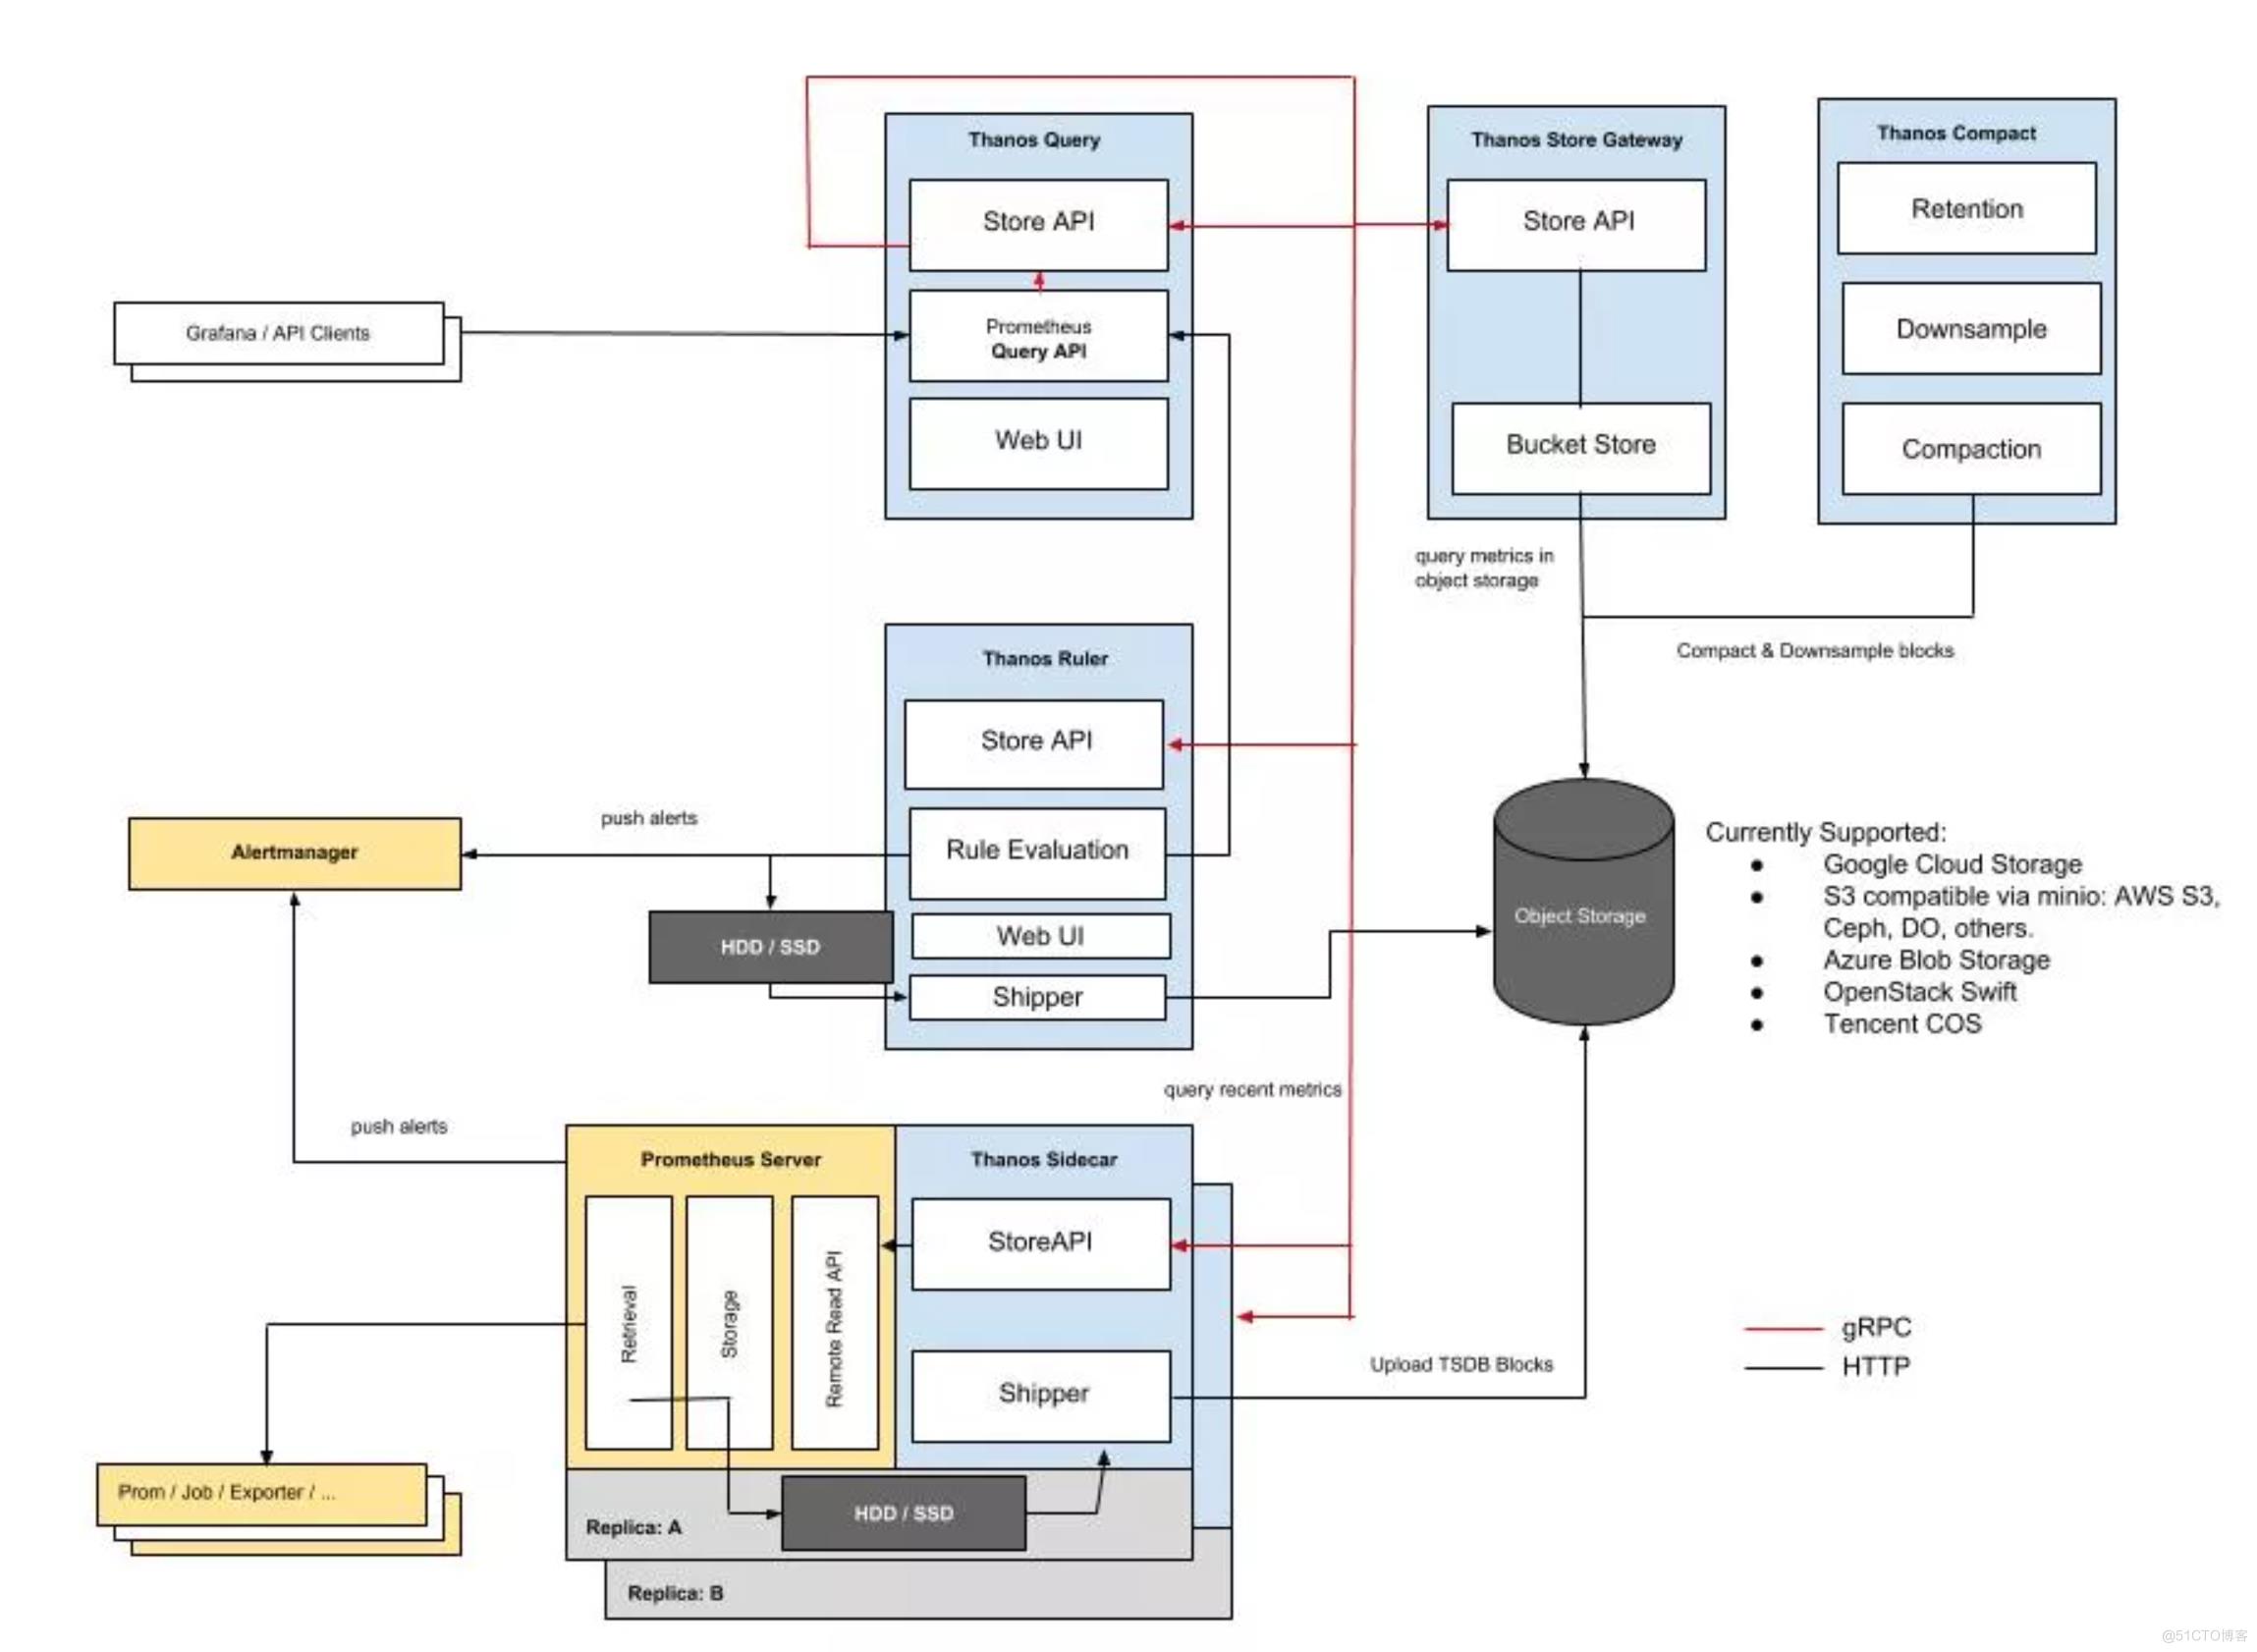
Thanos 主要由如下几个特定功能的组件组成:(相当于微服务的模式,里面有比较多的组件)

边车组件(Sidecar):连接 Prometheus,并把 Prometheus 暴露给查询网关(Querier/Query),以供实时查询,并且可以上传 Prometheus 数据给云存储,以供长期保存(相当于可以连接本地prometheus以及查询器的)
查询网关(Querier/Query):实现了 Prometheus API,与汇集底层组件(如边车组件 Sidecar,或是存储网关 Store Gateway)的数据(可以去查询sidecar里面的数据,或者是程查询存储网关里面的一个数据,有一部分的数据可能还在本地,因为sidecar还没有将数据上传上去,这个时候去查询的时候会根据查询时间会去路由到本地的sidecar,如果数据在远程存储上面,那么就会从存储网关上面去读取)
存储网关(Store Gateway):将云存储中的数据内容暴露出来
压缩器(Compactor):将云存储中的数据进行压缩和下采样
接收器(Receiver):从 Prometheus 的 remote-write WAL(Prometheus 远程预写式日志)获取数据,暴露出去或者上传到云存储(和sidecar是两种不同的方式)
规则组件(Ruler):针对监控数据进行评估和报警
Bucket:主要用于展示对象存储中历史数据的存储情况,查看每个指标源中数据块的压缩级别,解析度,存储时段和时间长度等信息。
查询前端:实现Prometheus的api,将其代理给query,同时缓存响应
从使用角度来看有两种方式去使用 Thanos,sidecar模式和 receiver 模式。
三:prometheus 与thanos的部署
3.1 系统环境介绍
操作系统:
     centos7.9x64

主机名:
cat /etc/hosts
----
172.16.10.11    flyfish11
172.16.10.12    flyfish12
172.16.10.13    flyfish13
172.16.10.14    flyfish14
172.16.10.15    flyfish15
172.16.10.16    flyfish16
172.16.10.17    flyfish17
-----
本次安装前 5台虚拟机 (flyfish11/flyfish12/flyfish13/flyfish14/flyfish15)部署


系统初始化:
   1.系统关闭firewalld/selinux/iptables 清空
   2.配置所有虚拟机的root账号的无密钥登录
   3.配置时间服务器ntp1.aliyun.com
3.2 安装prometheus
prometheus 需要安装两台(flyfish11/flyfish12)
Prometheus本身也是一个导出器(exporter),提供了关于内存使用、垃圾收集以及自身性能
与健康状态等各种主机级指标。
prometheus官网下载址:
https://prometheus.io/download/
wget https://github.com/prometheus/prometheus/releases/download/v2.41.0/prometheus-2.21.0.linux-amd64.tar.gz
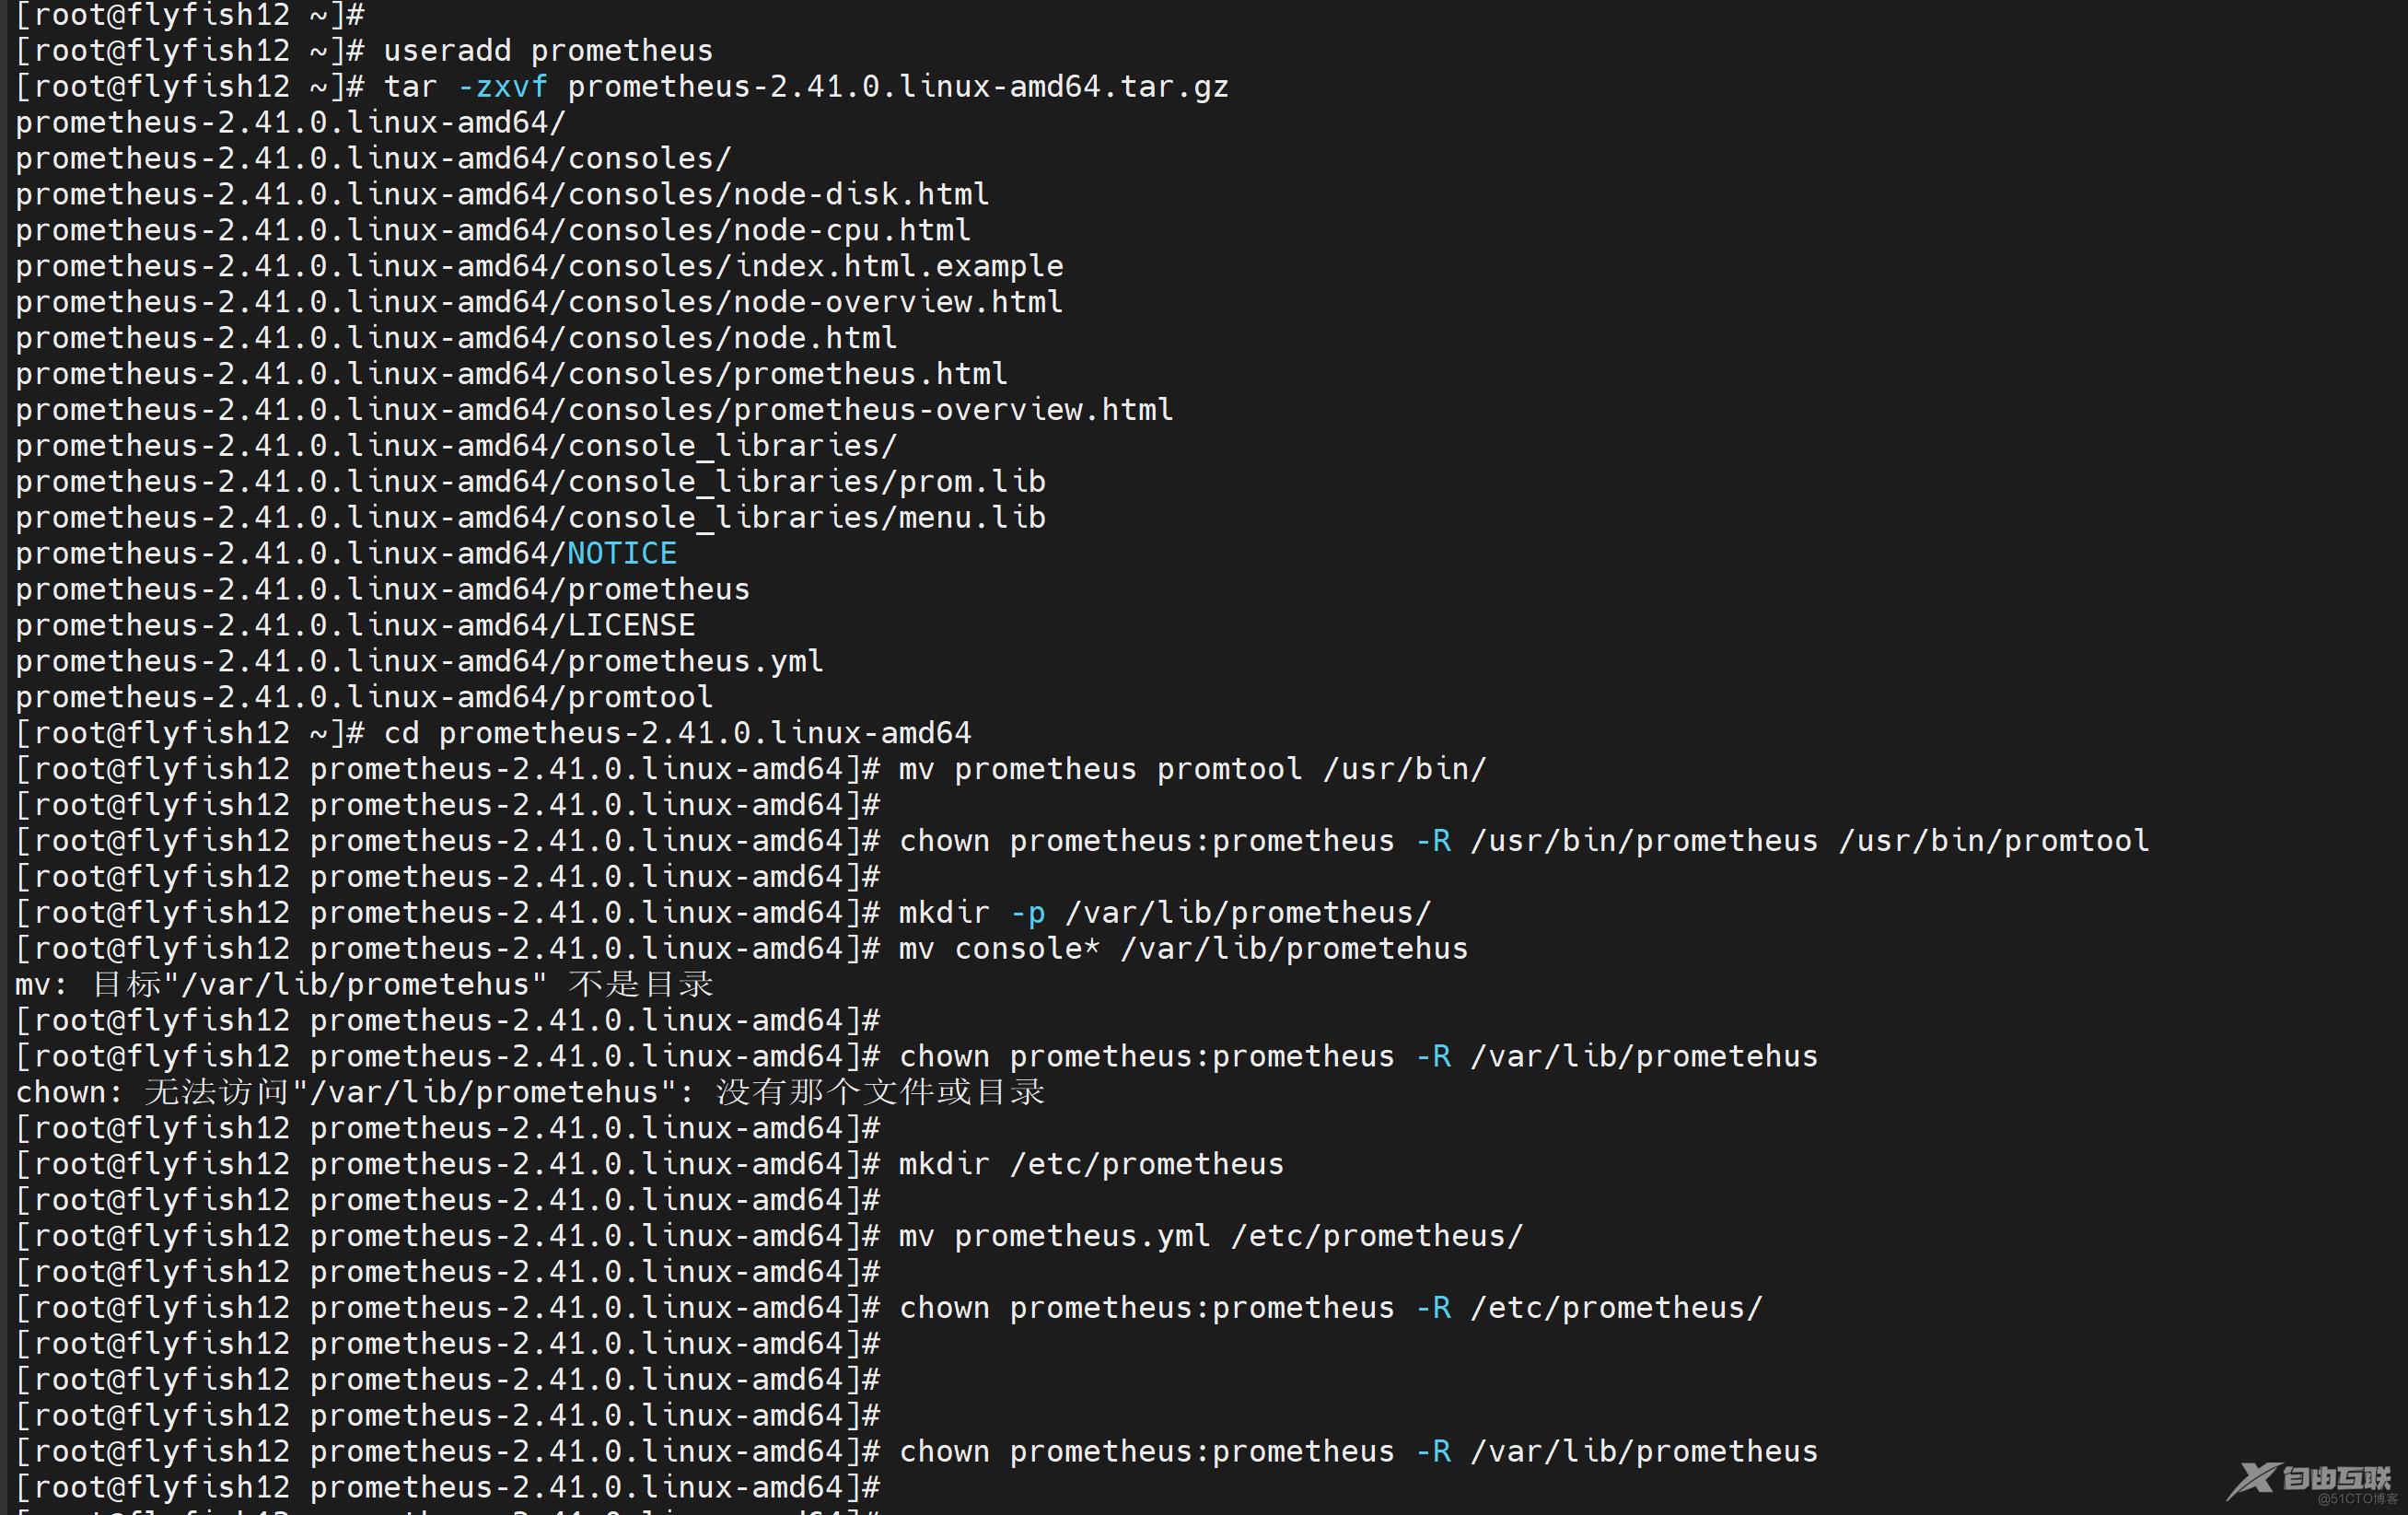
useradd prometheus
tar -zxvf prometheus-2.41.0.linux-amd64.tar.gz
cd prometheus-2.41.0.linux-amd64
mv prometheus promtool /usr/bin/
chown prometheus:prometheus -R /usr/bin/prometheus /usr/bin/promtool
mkdir -p /var/lib/prometheus/
mv console* /var/lib/prometehus
chown prometheus:prometheus -R /var/lib/prometheus
mkdir /etc/prometheus
mv prometheus.yml /etc/prometheus/
chown prometheus:prometheus -R /etc/prometheus/
Prometheus的配置文件是YAML格式,大致分为四大块,包括:global、alerting、
rule_files、scrape_configs。在下面的prometheus.yml配置文件中来描述其用途。
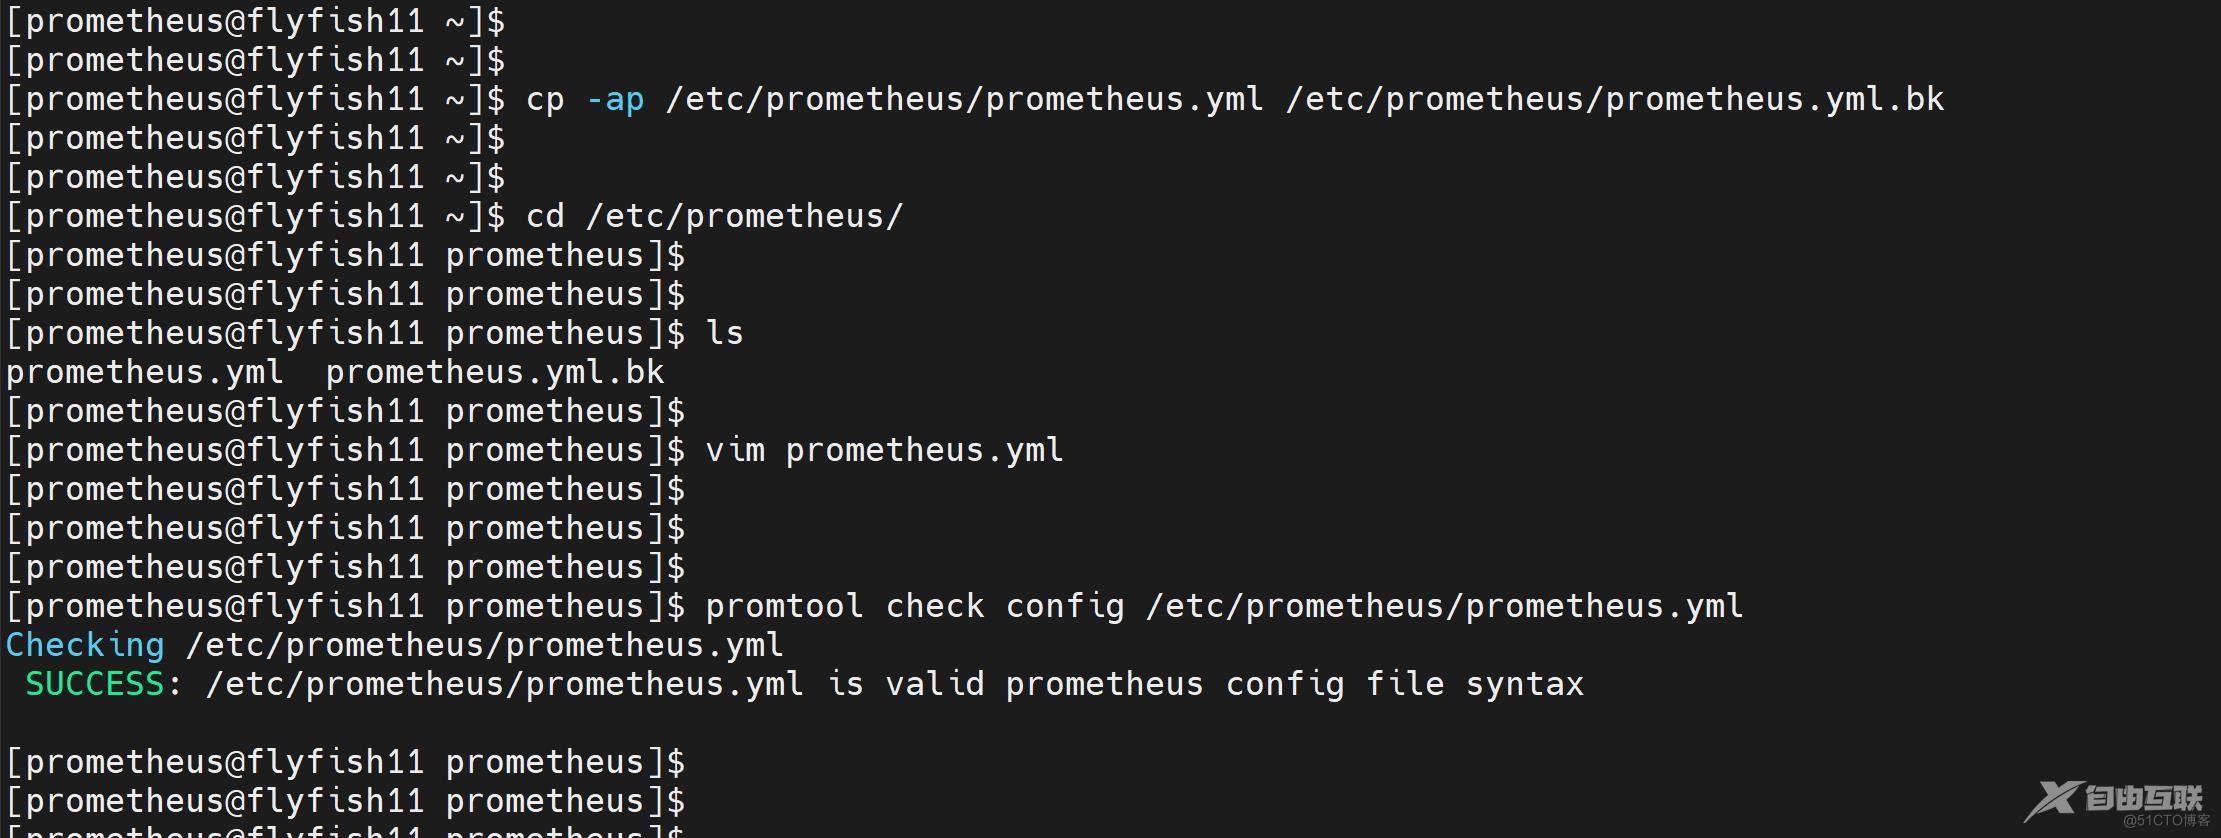
su - prometheus
cp -ap /etc/prometheus/prometheus.yml /etc/prometheus/prometheus.yml.bk
cd /etc/prometheus/
vim prometheus.yaml
------
# my global config
global:
scrape_interval: 15s # Set the scrape interval to every 15 seconds. Default is every 1 minute.
evaluation_interval: 15s # Evaluate rules every 15 seconds. The default is every 1 minute.
# scrape_timeout is set to the global default (10s).
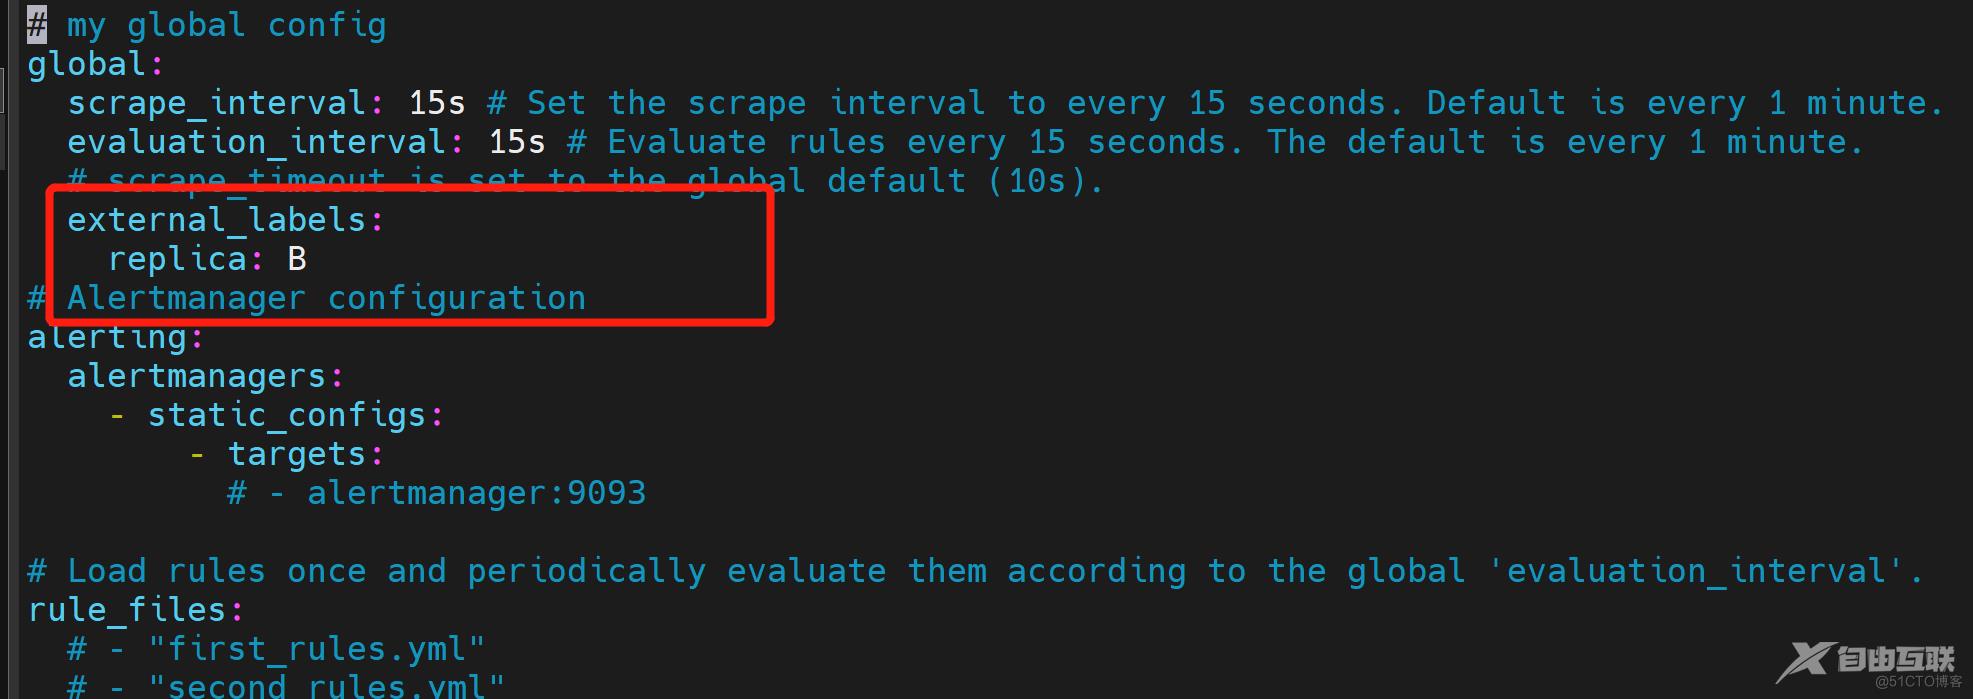
external_labels:
replica: A ### flyfish12 一台就是 replica: B
# Alertmanager configuration
alerting:
alertmanagers:
- static_configs:
- targets:
# - alertmanager:9093
# Load rules once and periodically evaluate them according to the global 'evaluation_interval'.
rule_files:
# - "first_rules.yml"
# - "second_rules.yml"
# A scrape configuration containing exactly one endpoint to scrape:
# Here it's Prometheus itself.
scrape_configs:
# The job name is added as a label `job=<job_name>` to any timeseries scraped from this config.
- job_name: "prometheus"
# metrics_path defaults to '/metrics'
# scheme defaults to 'http'.
static_configs:
- targets: ["localhost:9090"]
labels:
app: prometheus
nodename: prometheus-services
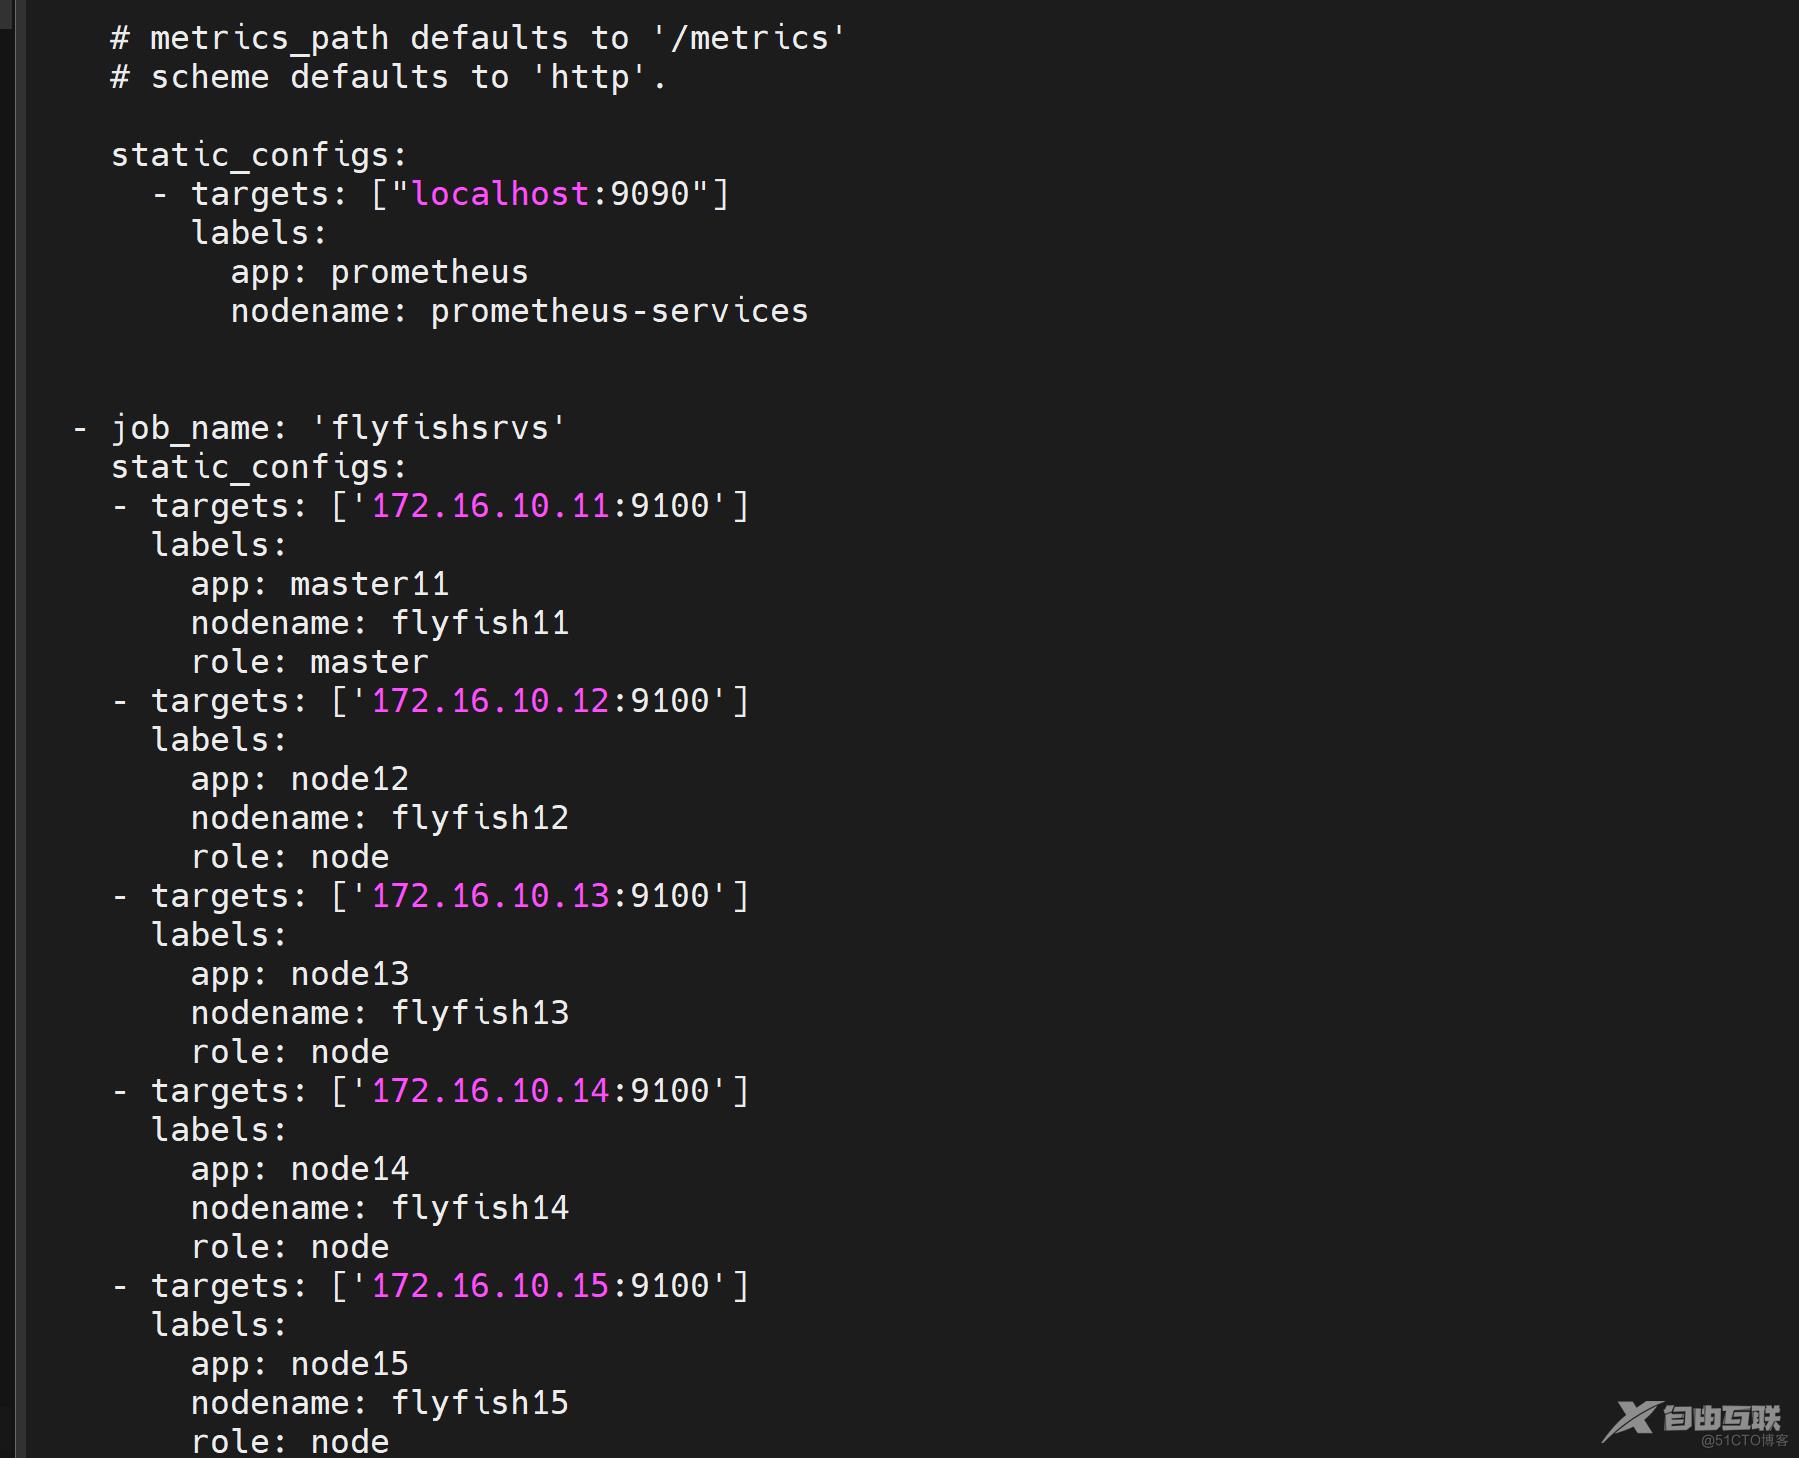
- job_name: 'flyfishsrvs'
static_configs:
- targets: ['172.16.10.11:9100']
labels:
app: master11
nodename: flyfish11
role: master
- targets: ['172.16.10.12:9100']
labels:
app: node12
nodename: flyfish12
role: node
- targets: ['172.16.10.13:9100']
labels:
app: node13
nodename: flyfish13
role: node
- targets: ['172.16.10.14:9100']
labels:
app: node14
nodename: flyfish14
role: node
- targets: ['172.16.10.15:9100']
labels:
app: node15
nodename: flyfish15
role: node
------
加载检查:
promtool check config /etc/prometheus/prometheus.yml
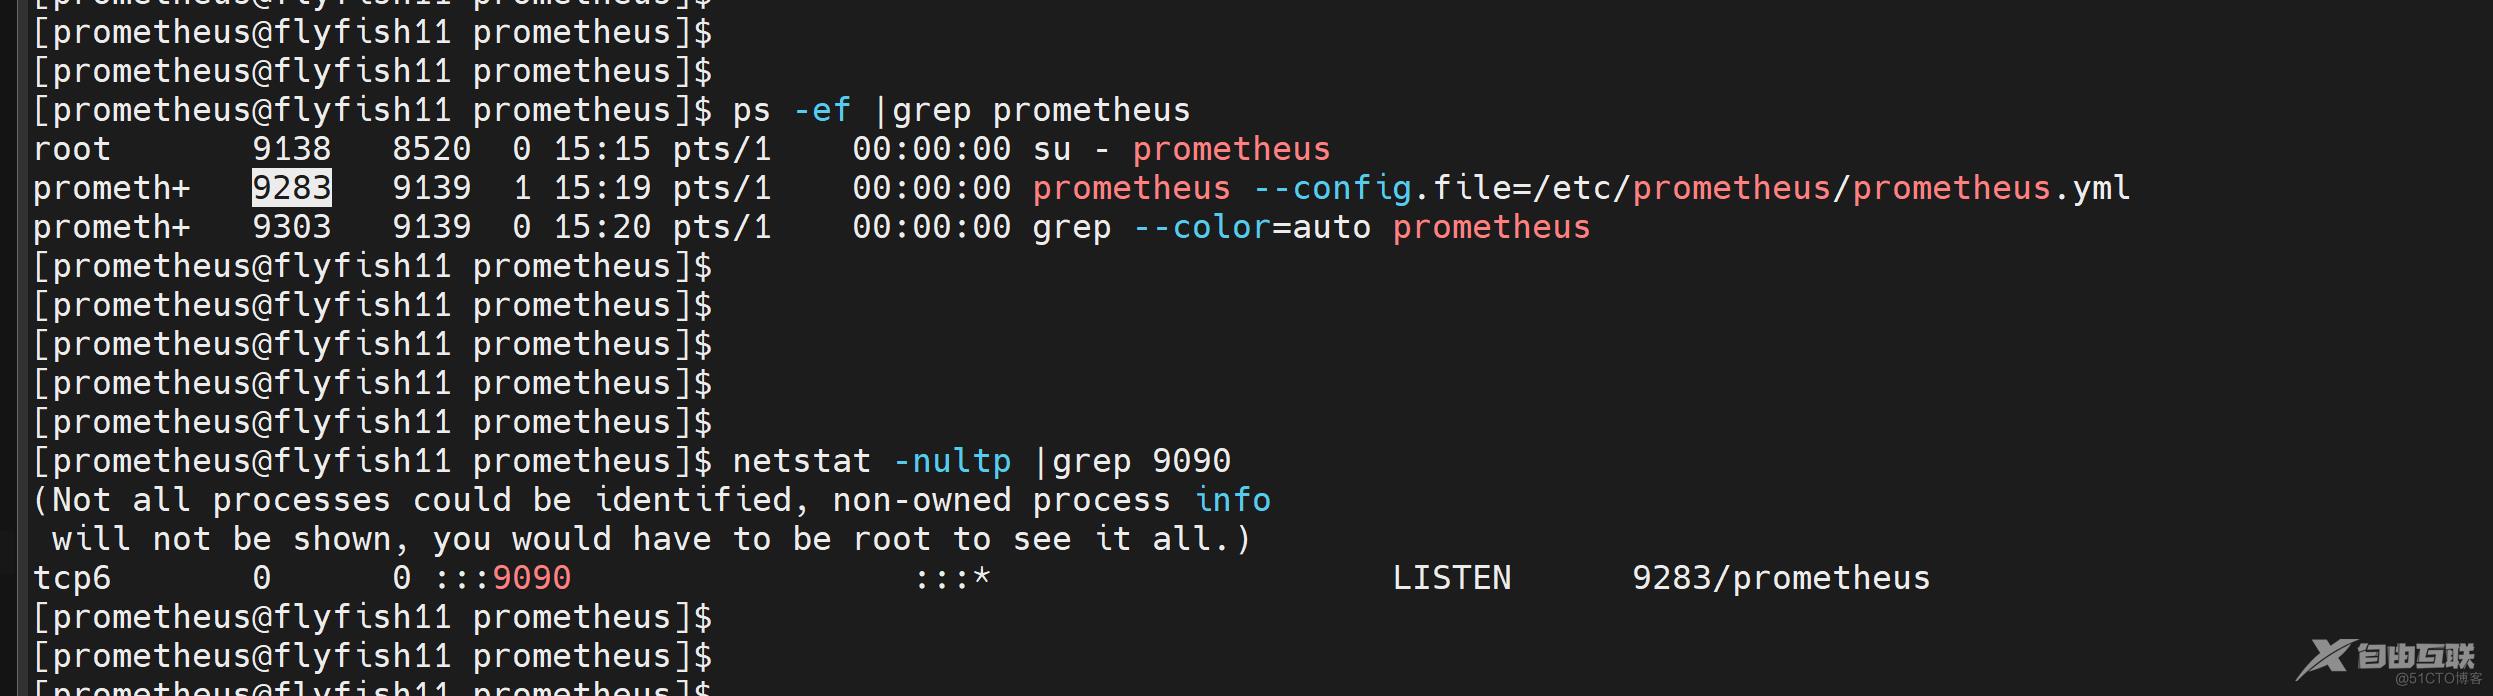
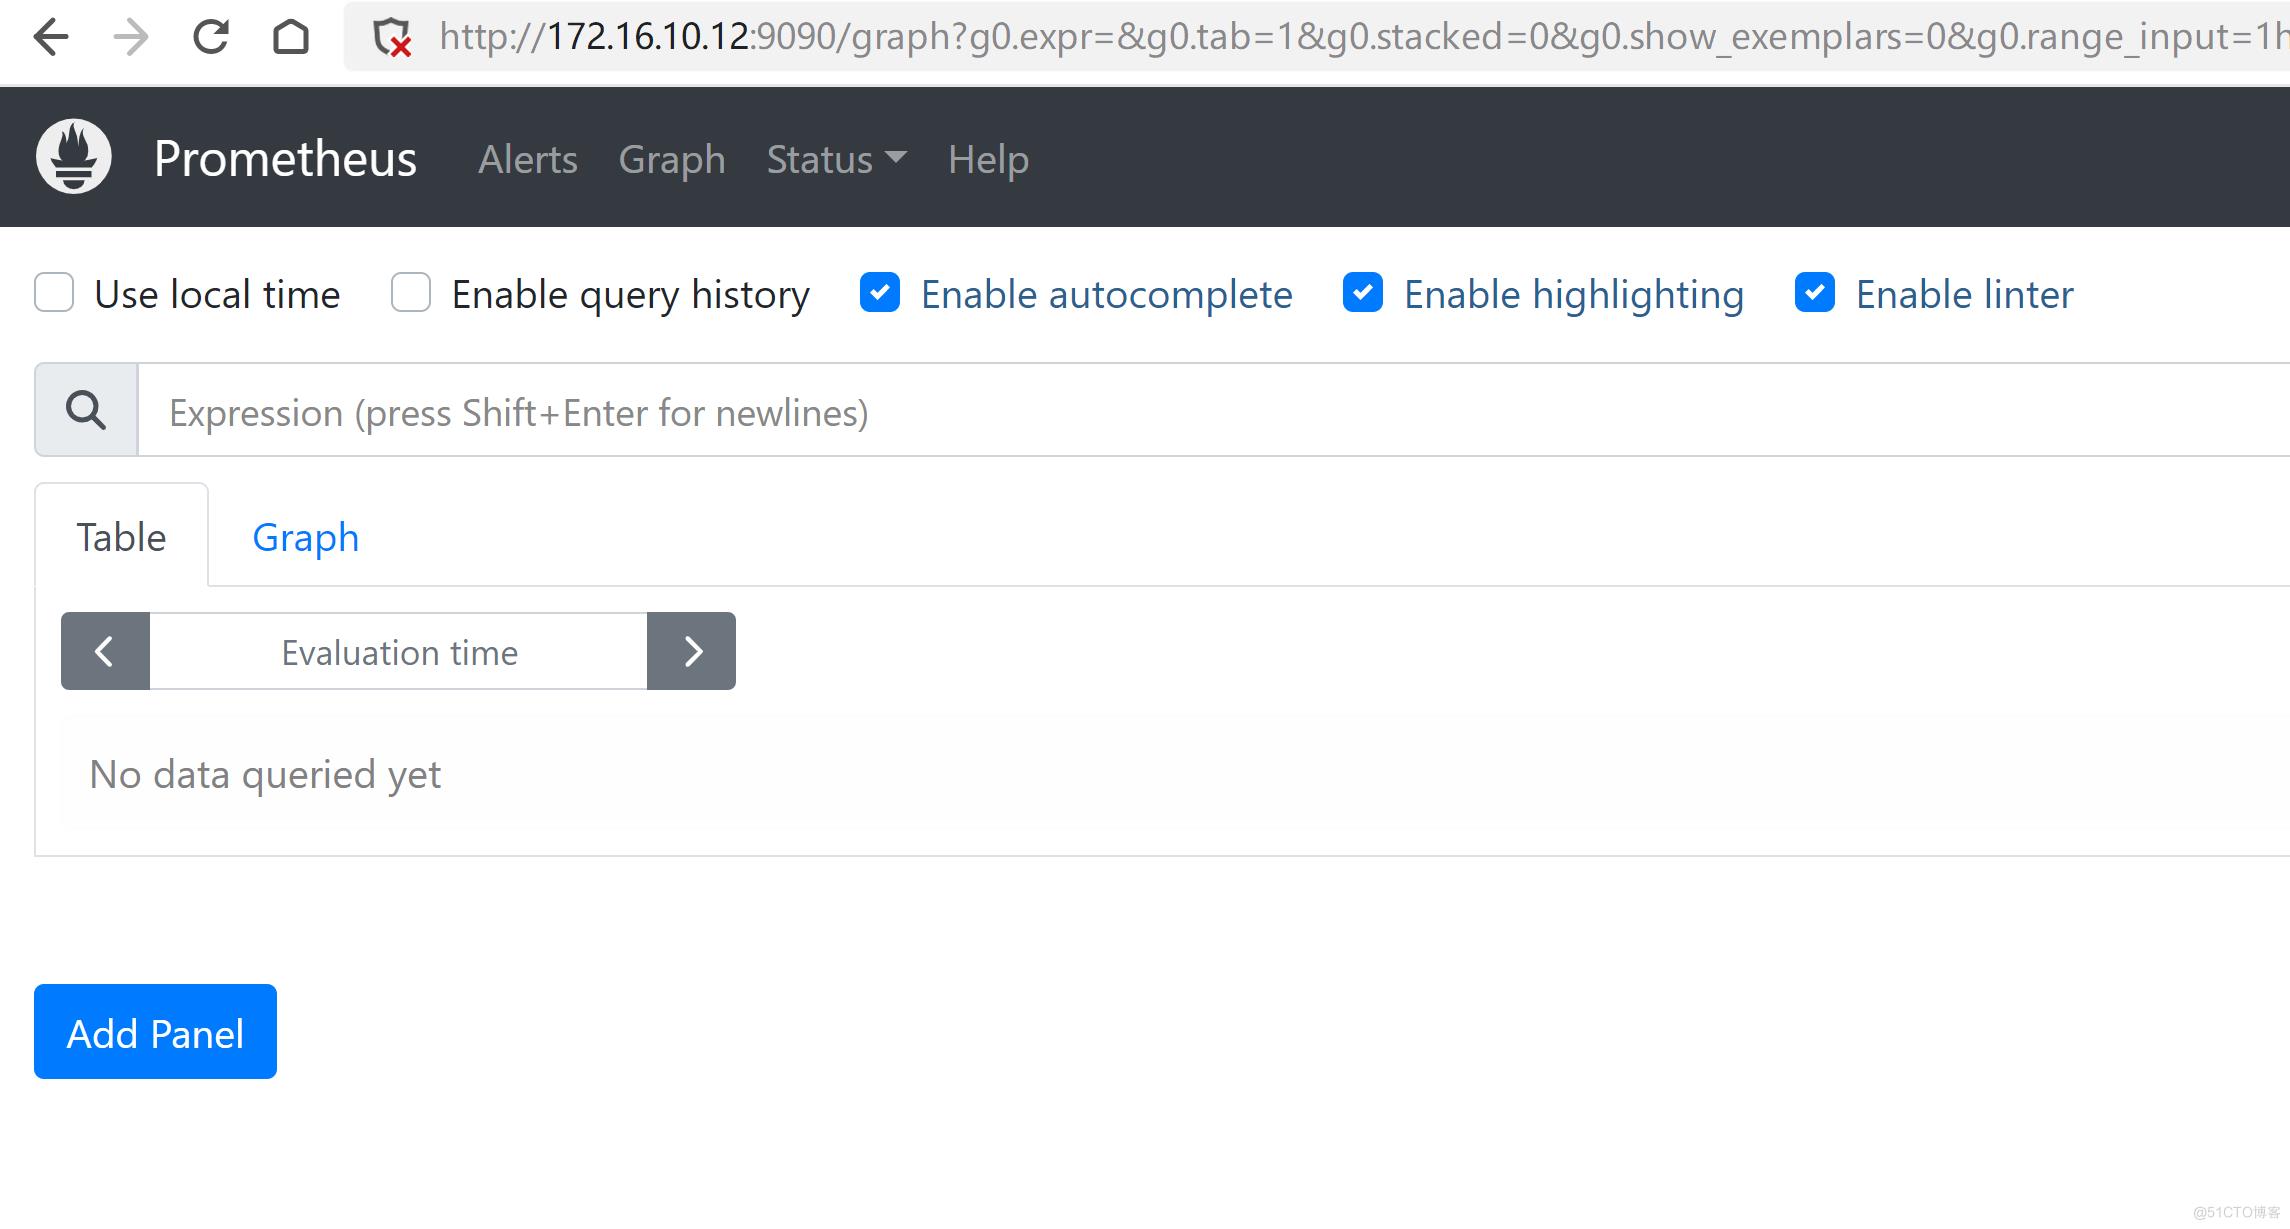
启动prometheus:


prometheus --config.file=/etc/prometheus/prometheus.yml &

netstat -nultp |grep 9090
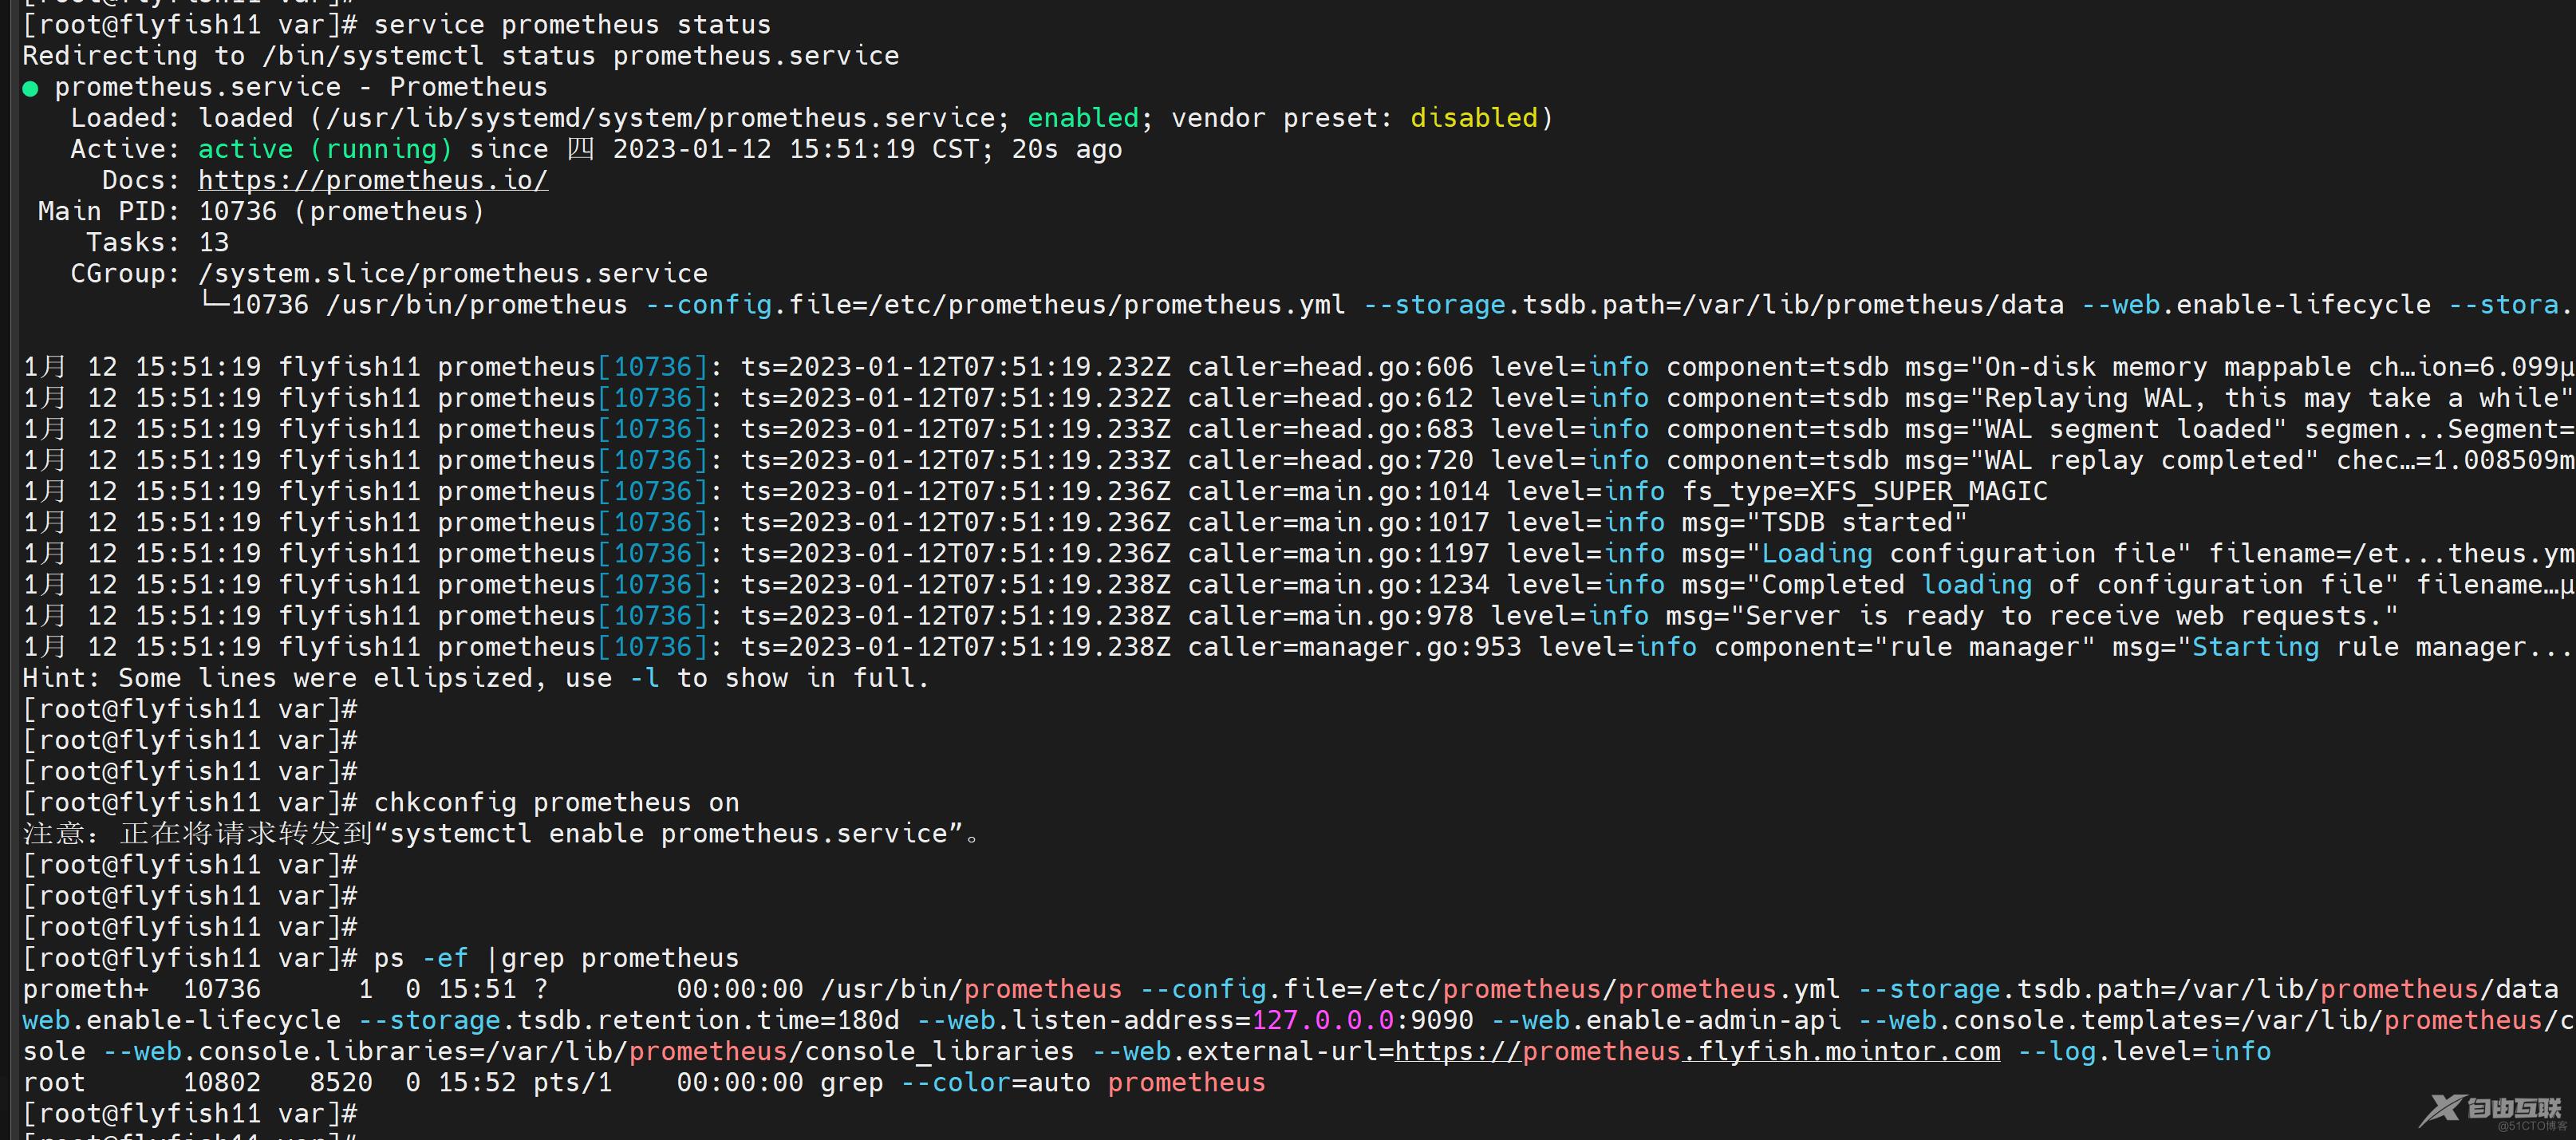
守护进程启动

cat > /usr/lib/systemd/system/prometheus.service <<EOF
[Unit]
Description=Prometheus
Documentiation=https://prometheus.io/
After=netowrk.target
[Service]
Type=simple
User=prometheus
ExecStart=/usr/bin/prometheus \
--config.file=/etc/prometheus/prometheus.yml \
--storage.tsdb.path=/var/lib/prometheus/data \
--web.enable-lifecycle \
--storage.tsdb.retention.time=180d \
--web.listen-address=0.0.0.0:9090 \
--web.enable-admin-api \
--web.console.templates=/var/lib/prometheus/console \
--web.console.libraries=/var/lib/prometheus/console_libraries \
--web.external-url=https://prometheus.flyfish.mointor.com \
--log.level=info
ExecReolad=/bin/curl -X POST http://127.0.0.0:9090/-/reload
TimeoutStopSec=2Os
Restart=always
LimitNOFILE=2048000
[Install]
WantedBy=multi-user.target
EOF


chmod +x /usr/lib/systemd/system/prometheus.service

service prometheus start

chkconfig prometheus on
用同样的方式部署flyfish12 机器
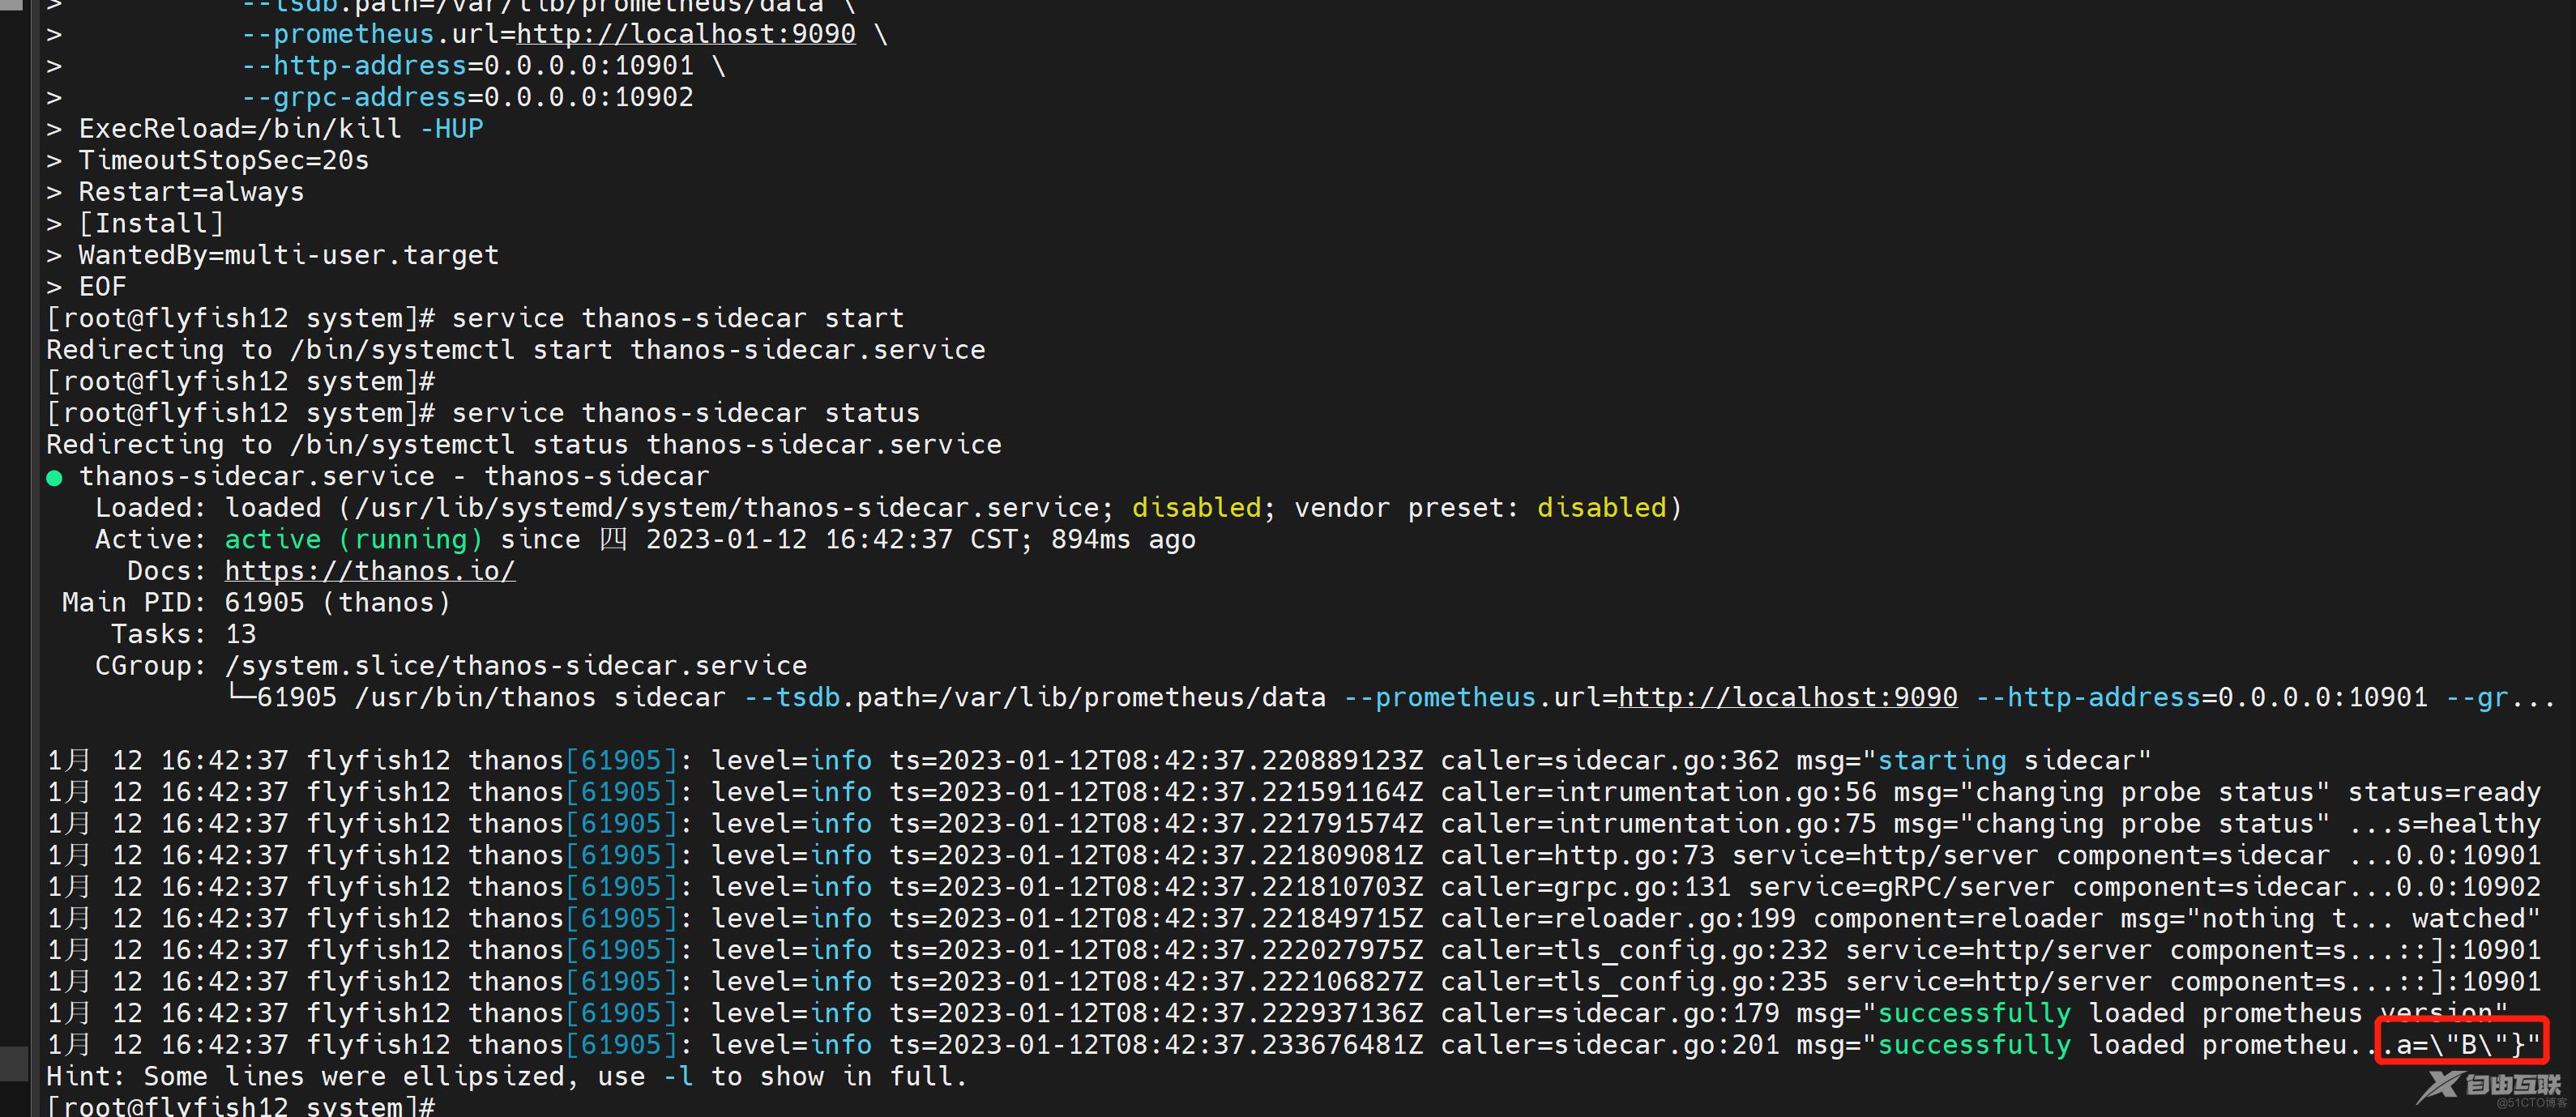
vim /etc/prometheus/prometheus.yml #注意这个地方是 replica: B

3.3 部署node_exporter
在客户端上面部署:
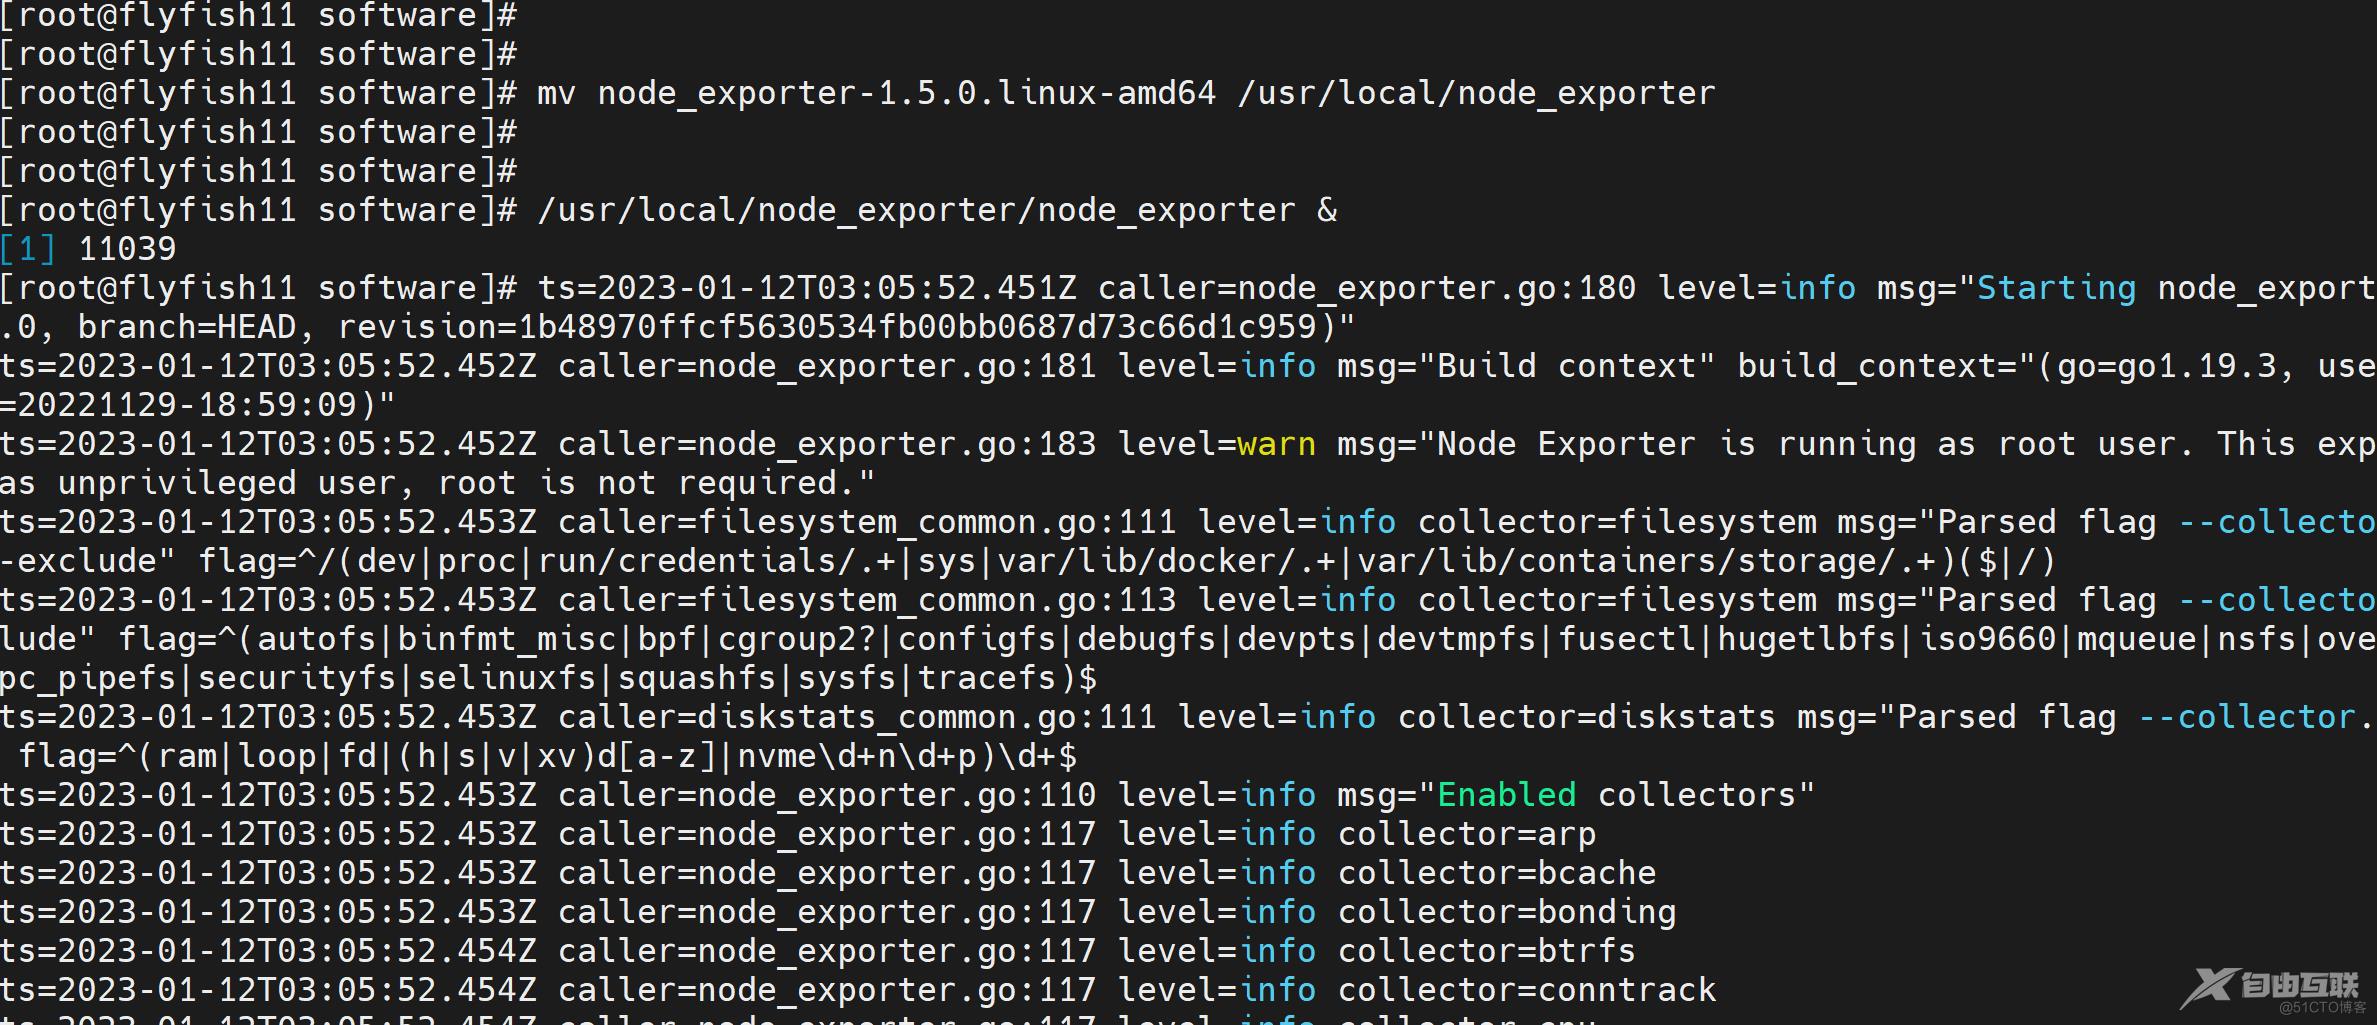
tar -zxvf node_exporter-1.5.0.linux-amd64.tar.gz
mv node_exporter-1.5.0.linux-amd64 /usr/local/node_exporter
/usr/local/node_exporter/node_exporter &
netstat -nultp |grep 9100
守护进程启动:
cat > /usr/lib/systemd/system/node_exporter.service <<EOF
[Unit]
Description=node_exporter
Documentation=https://prometheus.io/
After=network.target
[Service]
Typer=simple
ExecStart=/usr/local/node_exporter/node_exporter \
--web.listen-address=:9100 \
--collector.systemd \
--collector.systemd.unit-whitelist="(ssh|docker|rsyslog|redis-server).service" \
--collector.mountstats \
--collector.tcpstat
ExecReload=/bin/kill -HUP
TimeoutStopSec=20s
Restart=always
[Install]
WantedBy=multi-user.target
EOF
-------
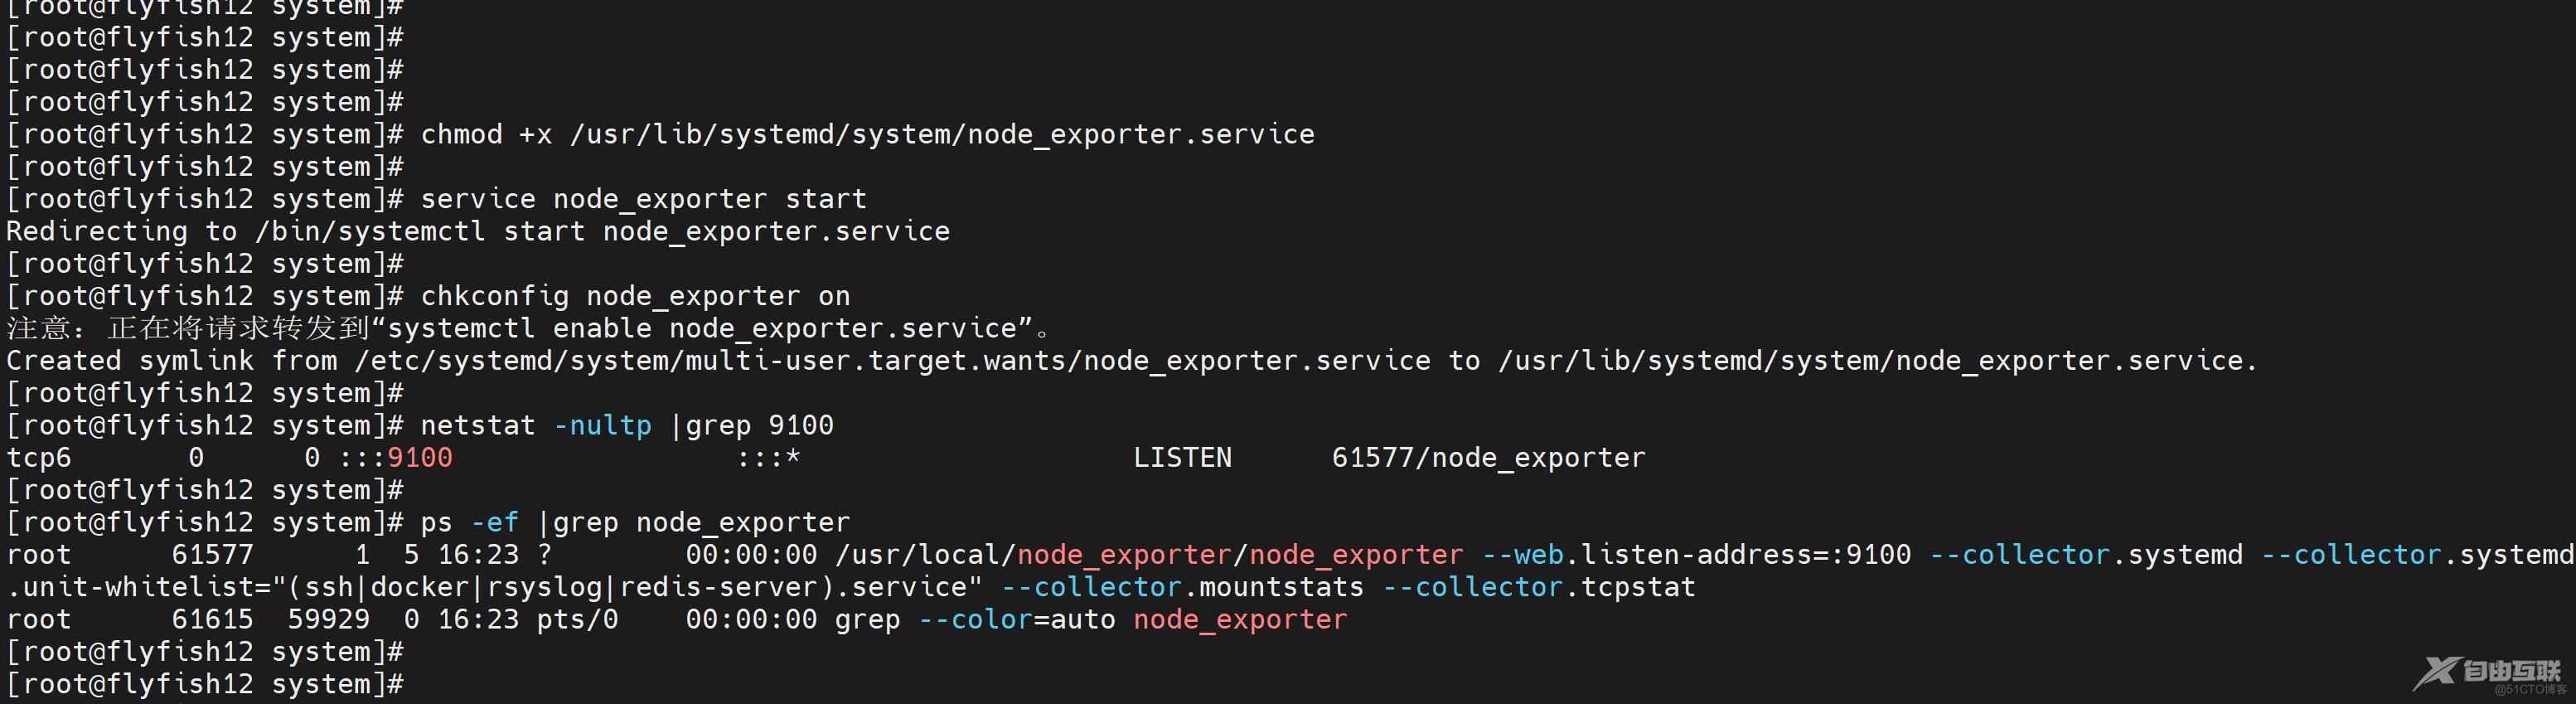
chmod +x /usr/lib/systemd/system/node_exporter.service
service node_exporter start
chkconfig node_exporter on
netstat -nultp |grep 9100
ps -ef |grep node_exporter
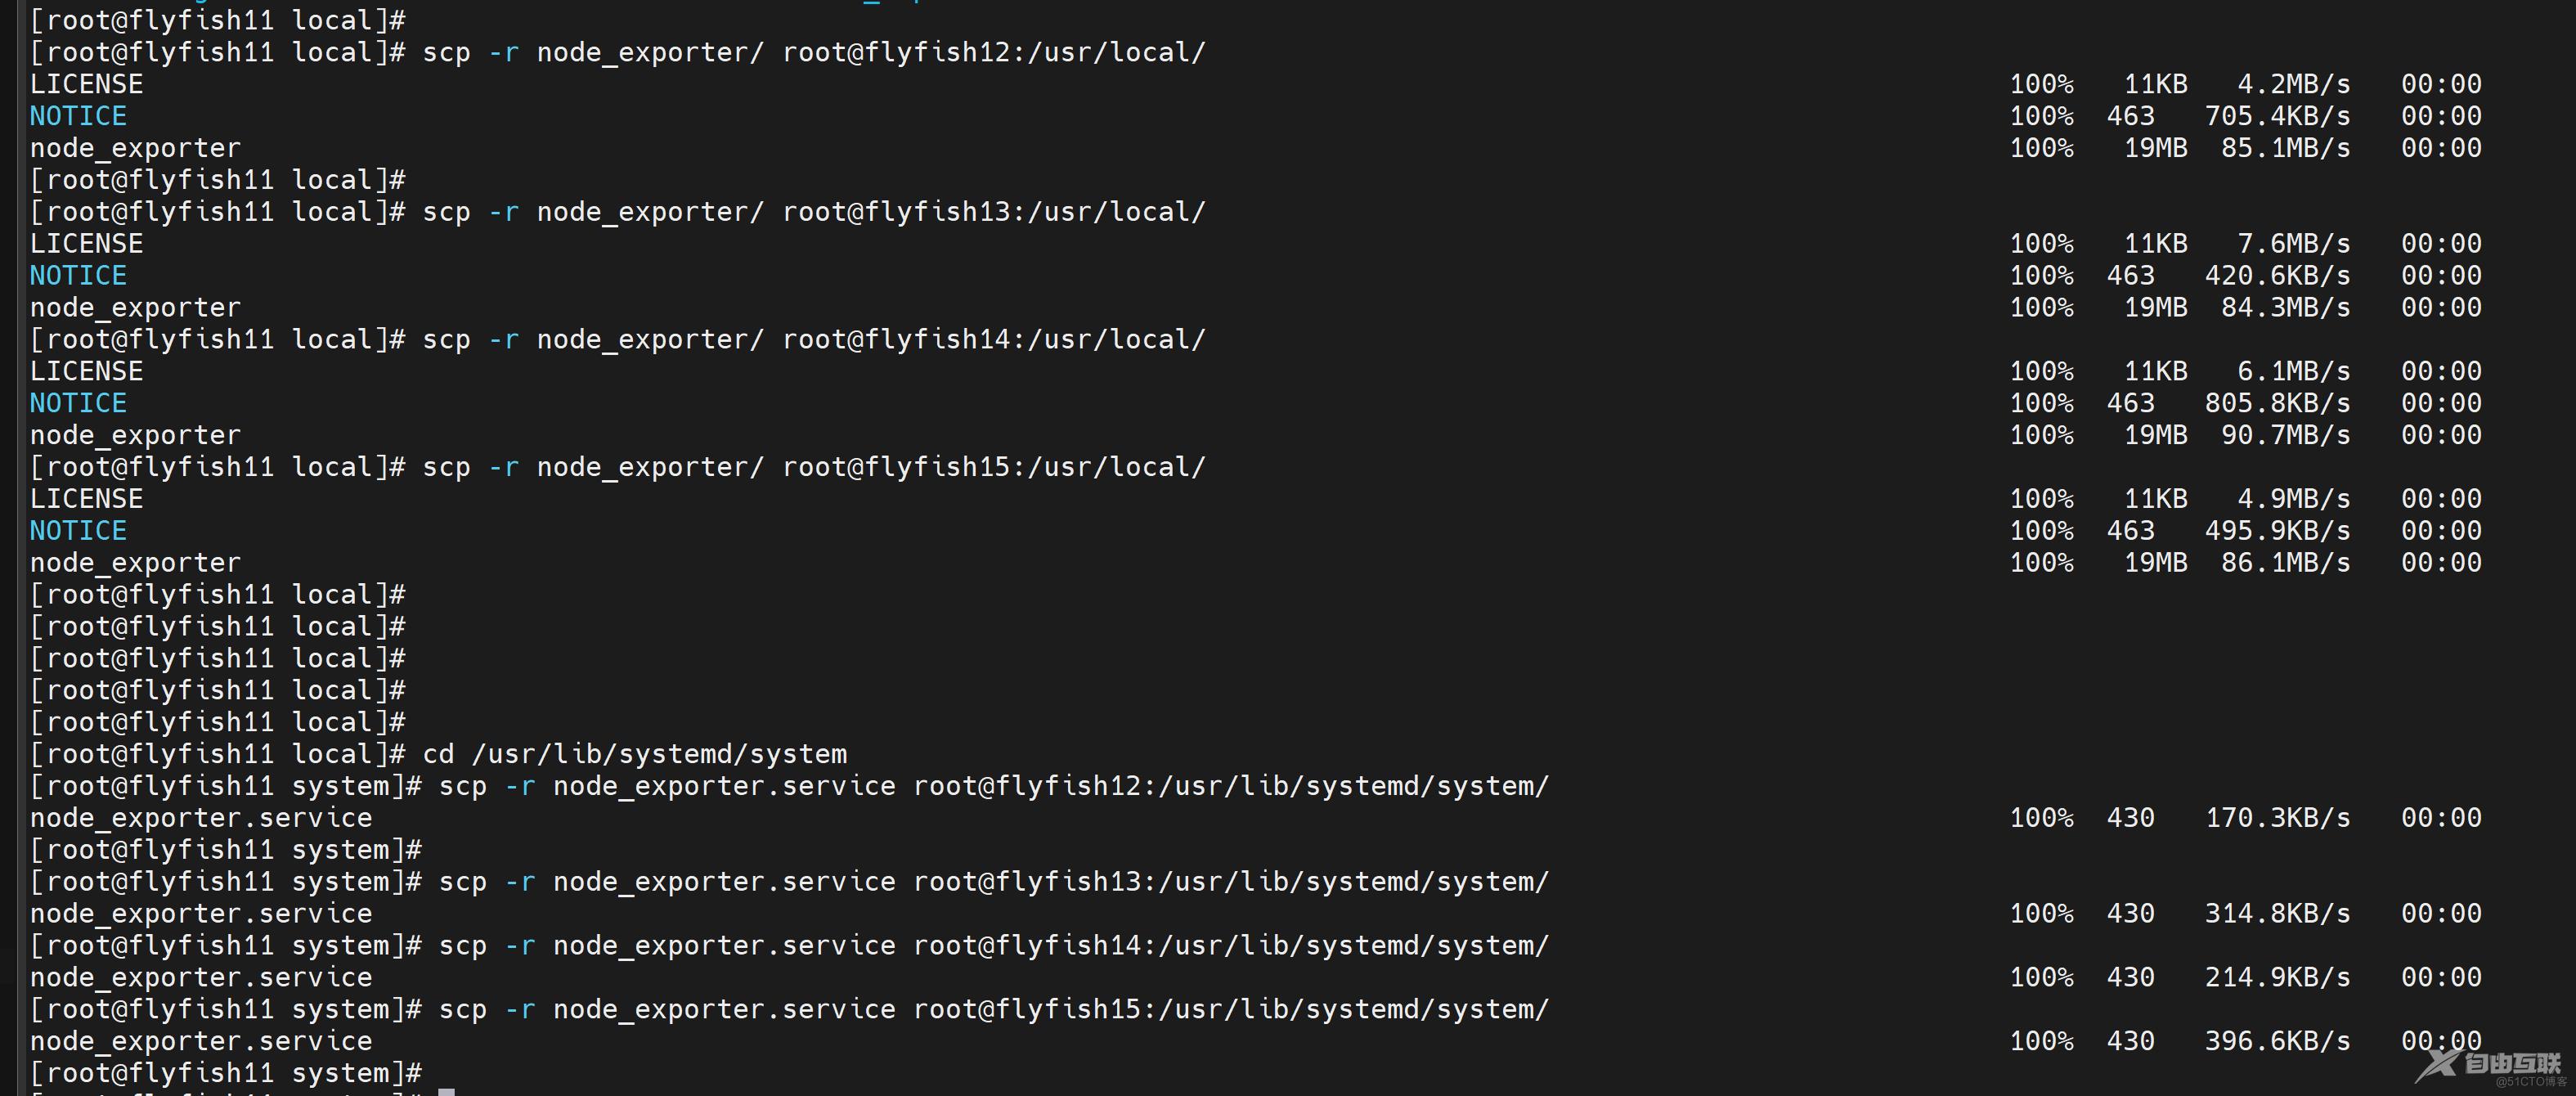
同理部署flyfish12/flyfish13/flyfish14/flyfish15 的node_exporter
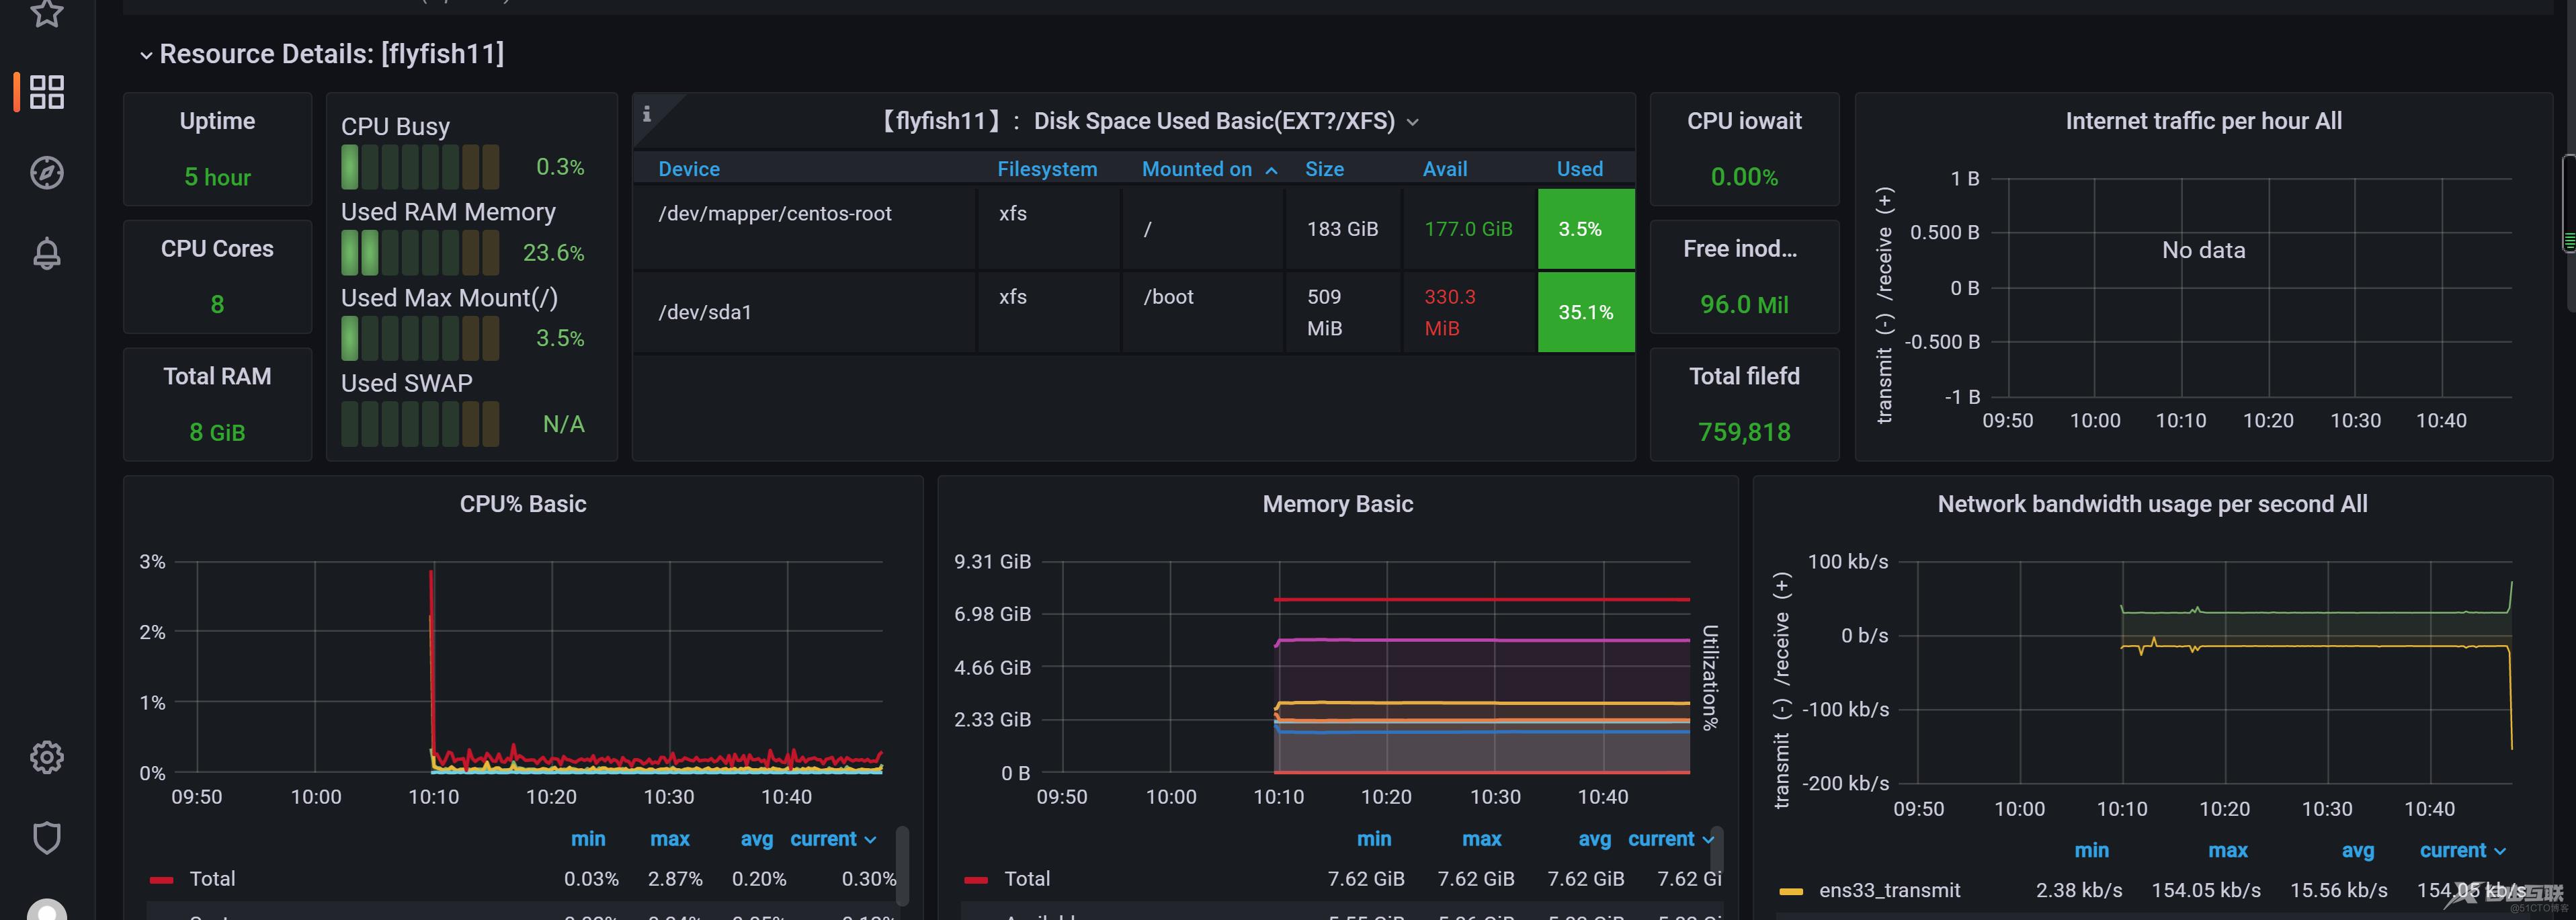
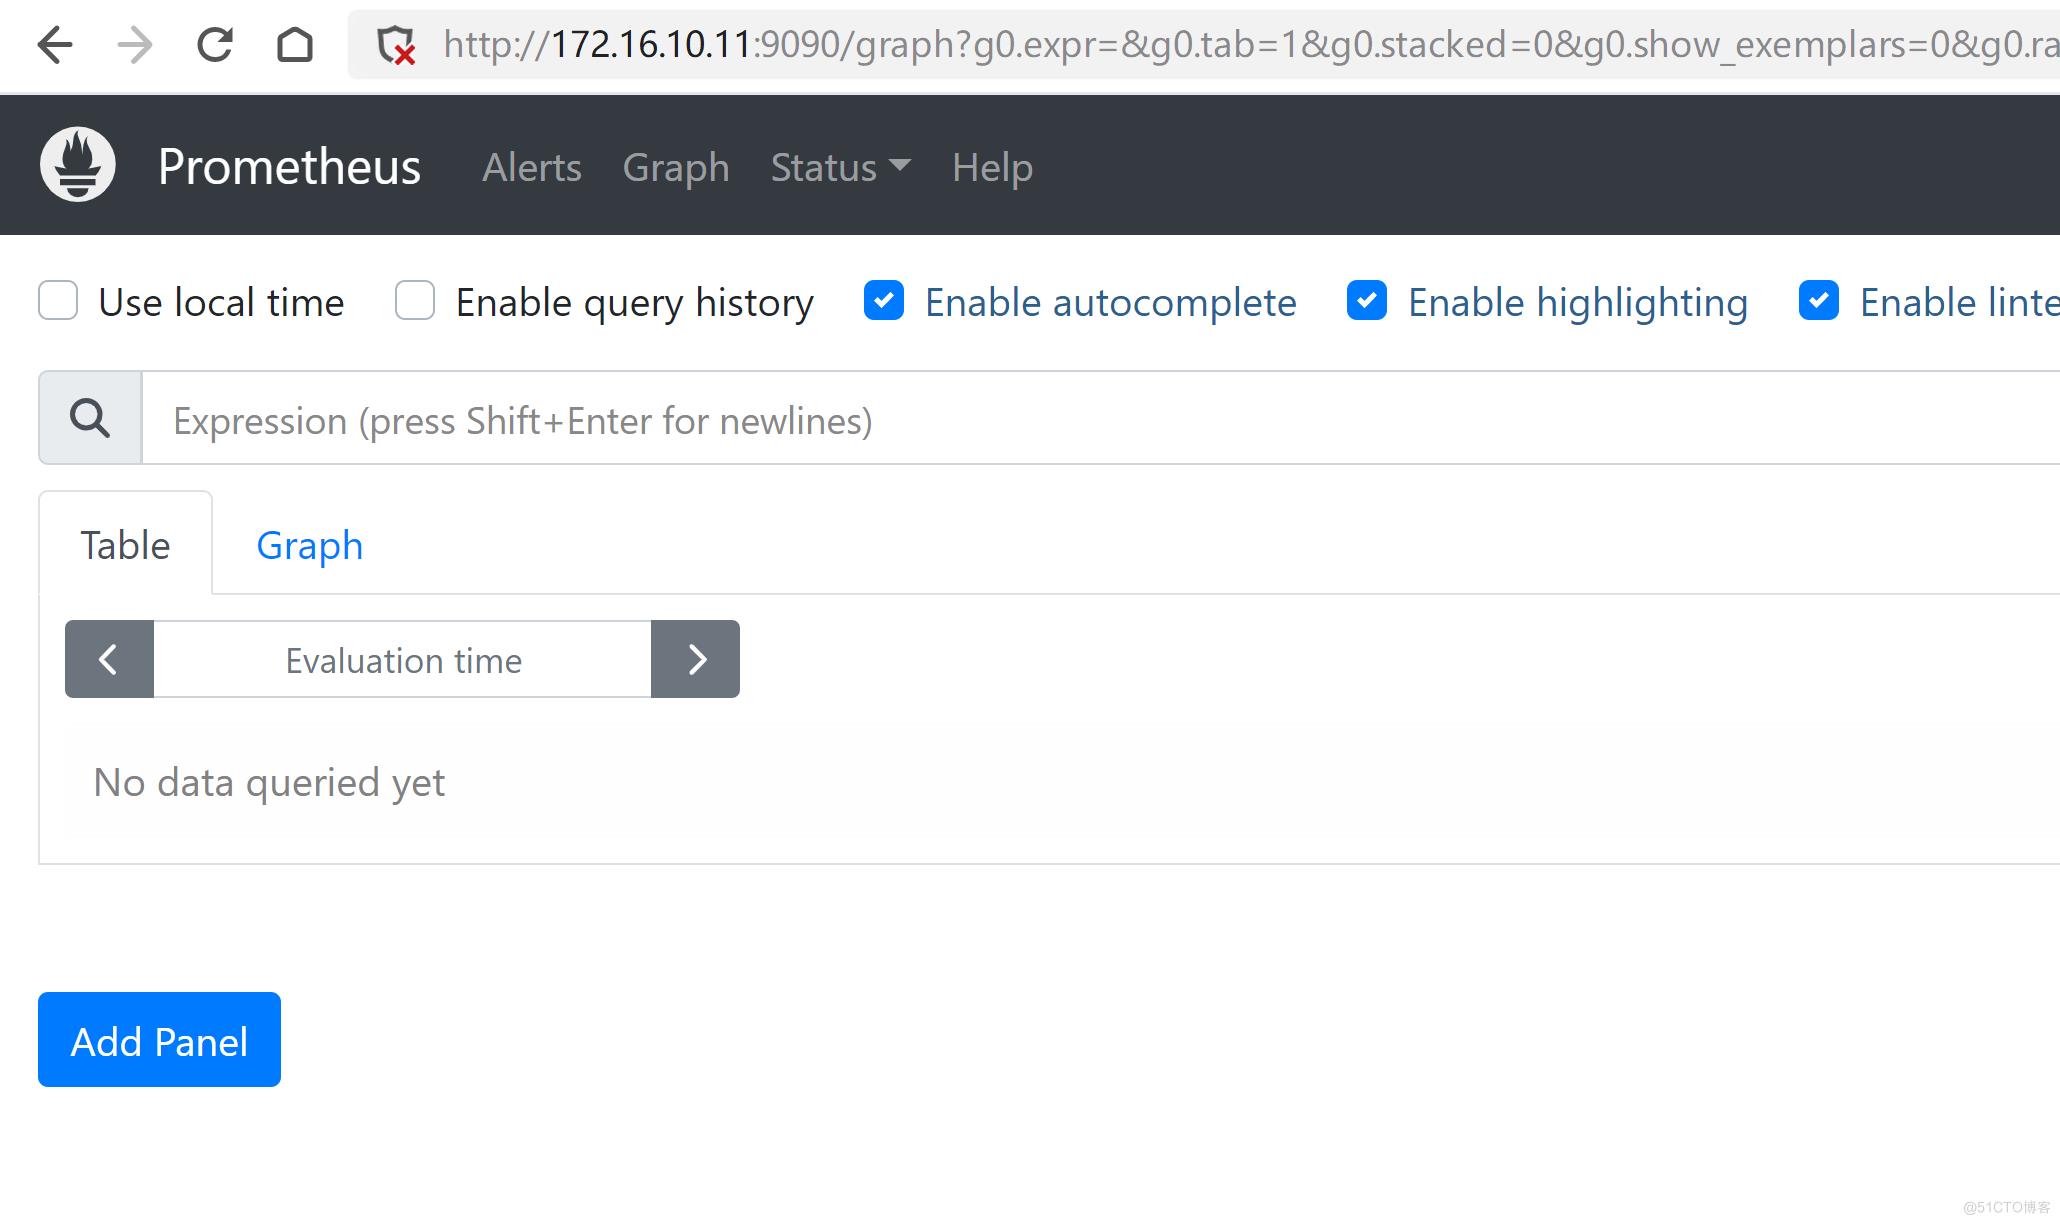
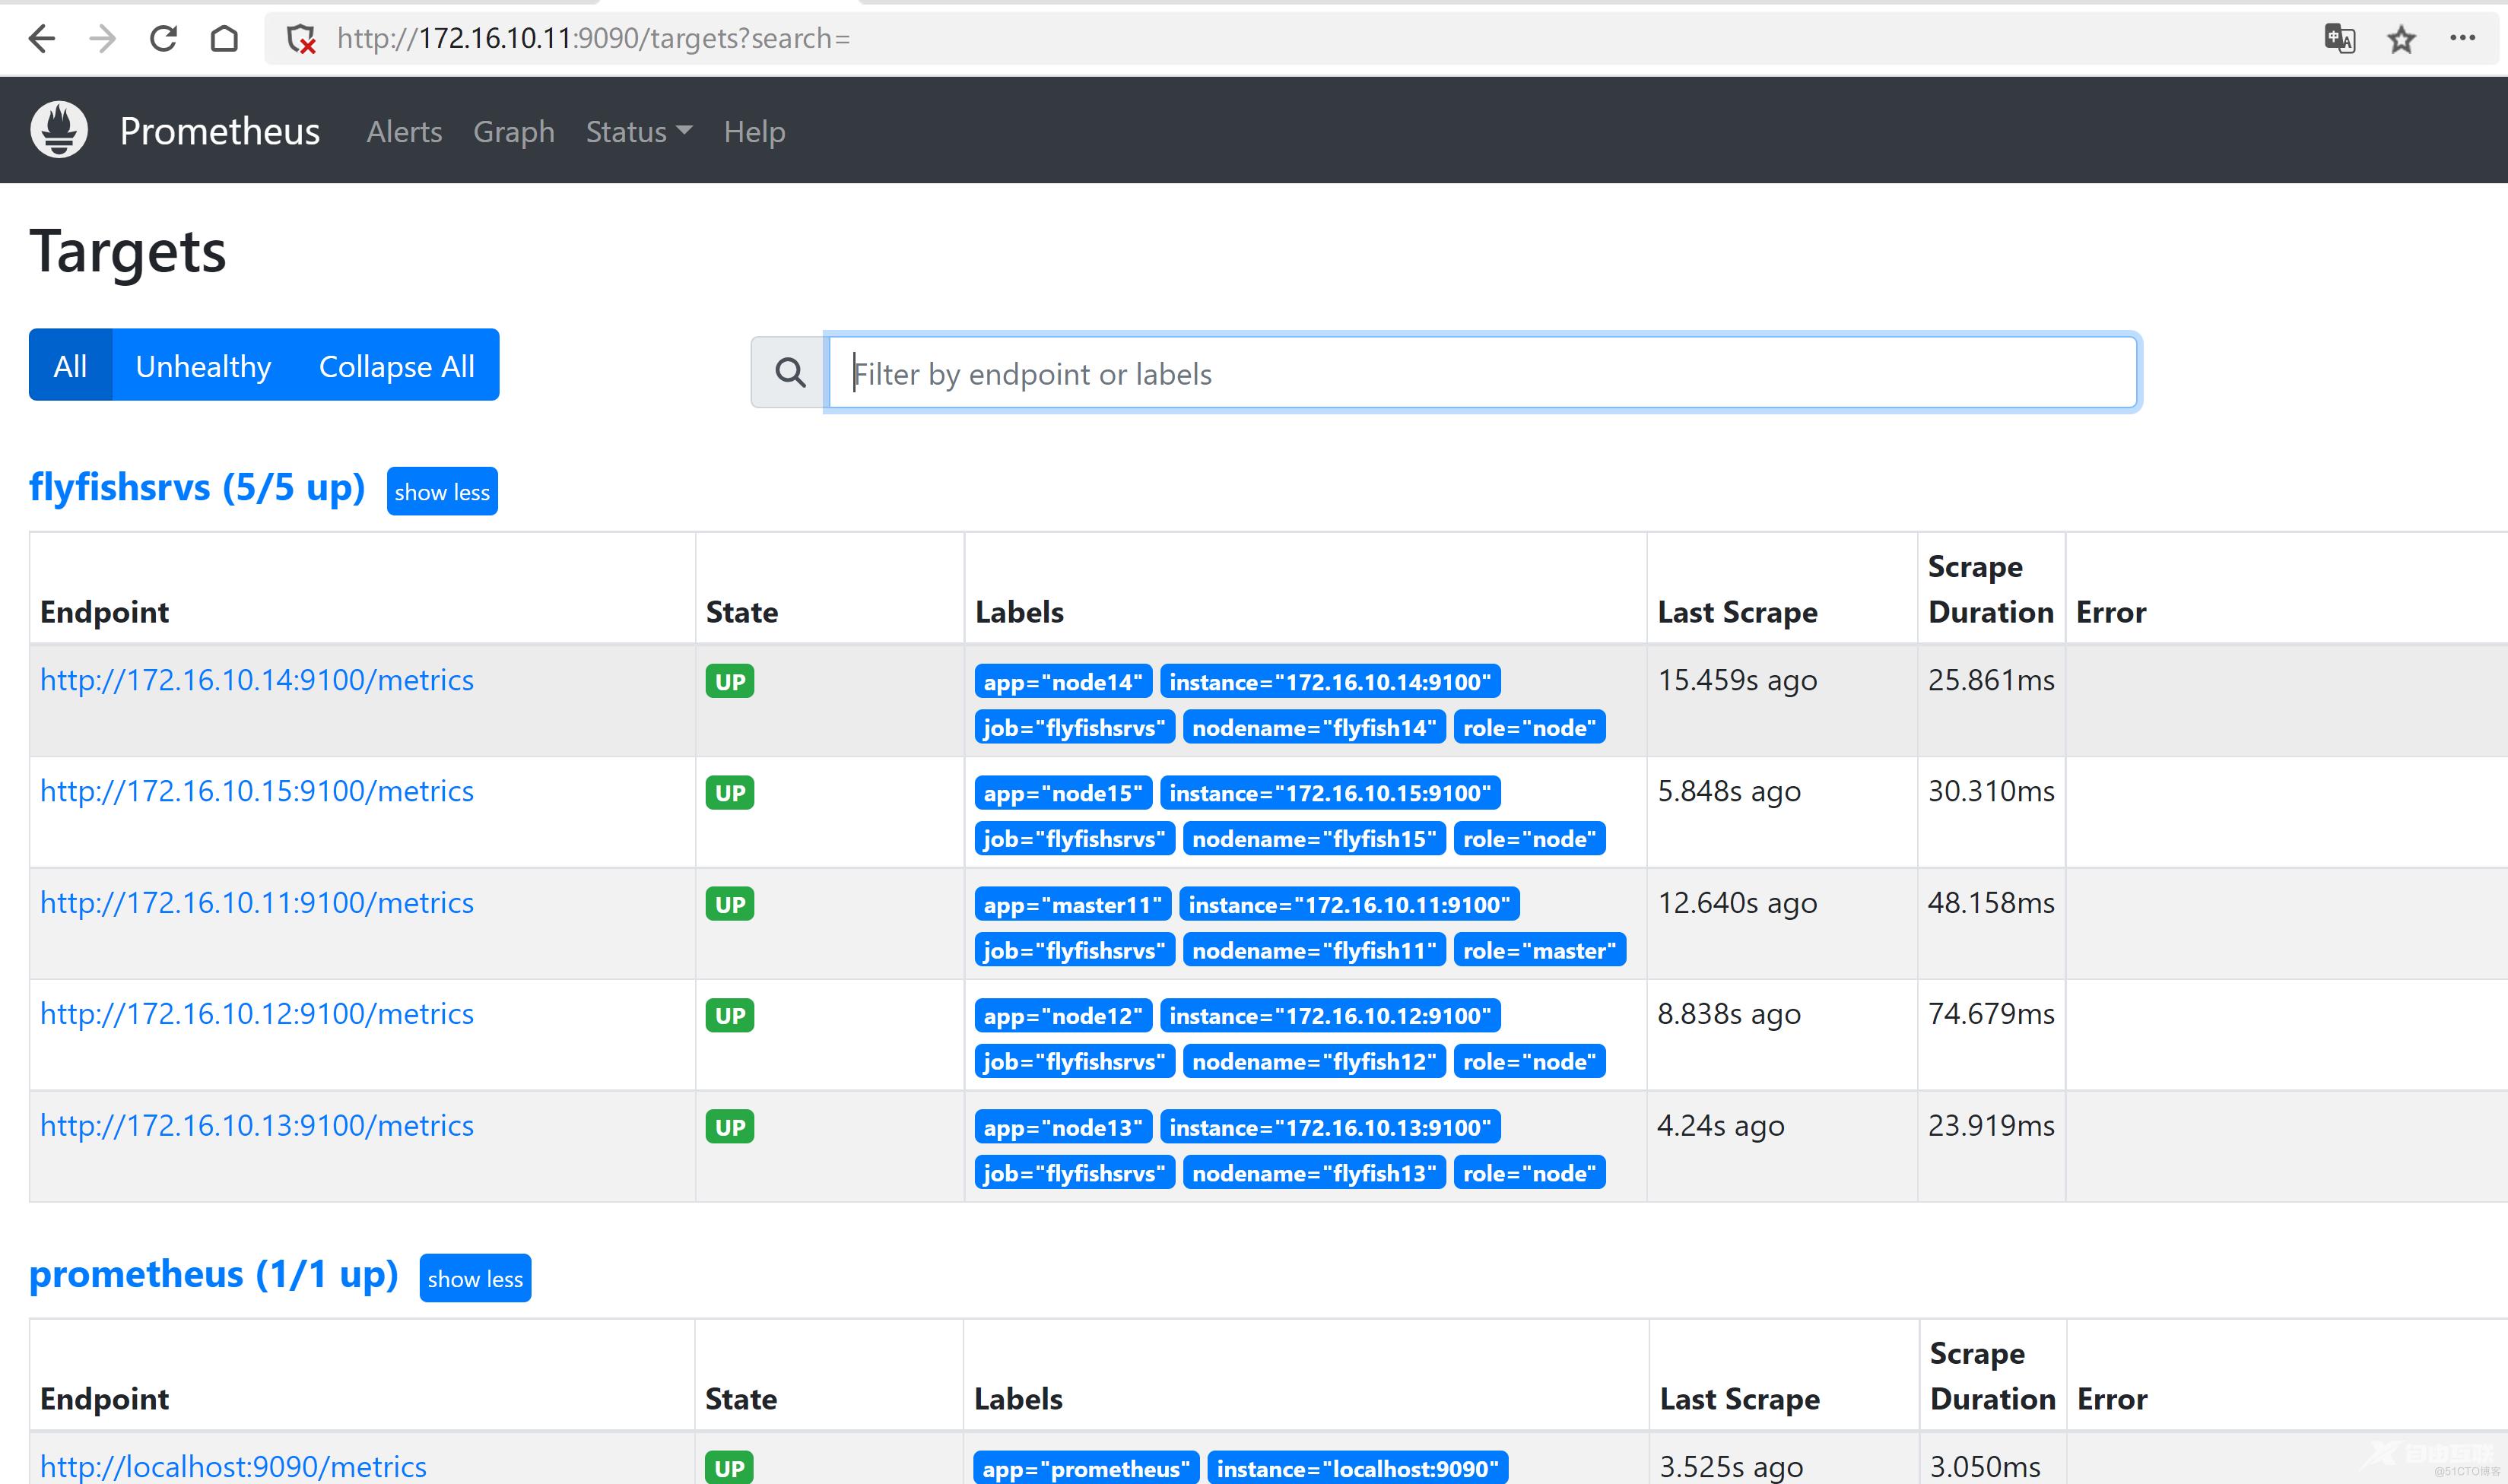
flyfish11 的prometheus
flyfish12 prometheus
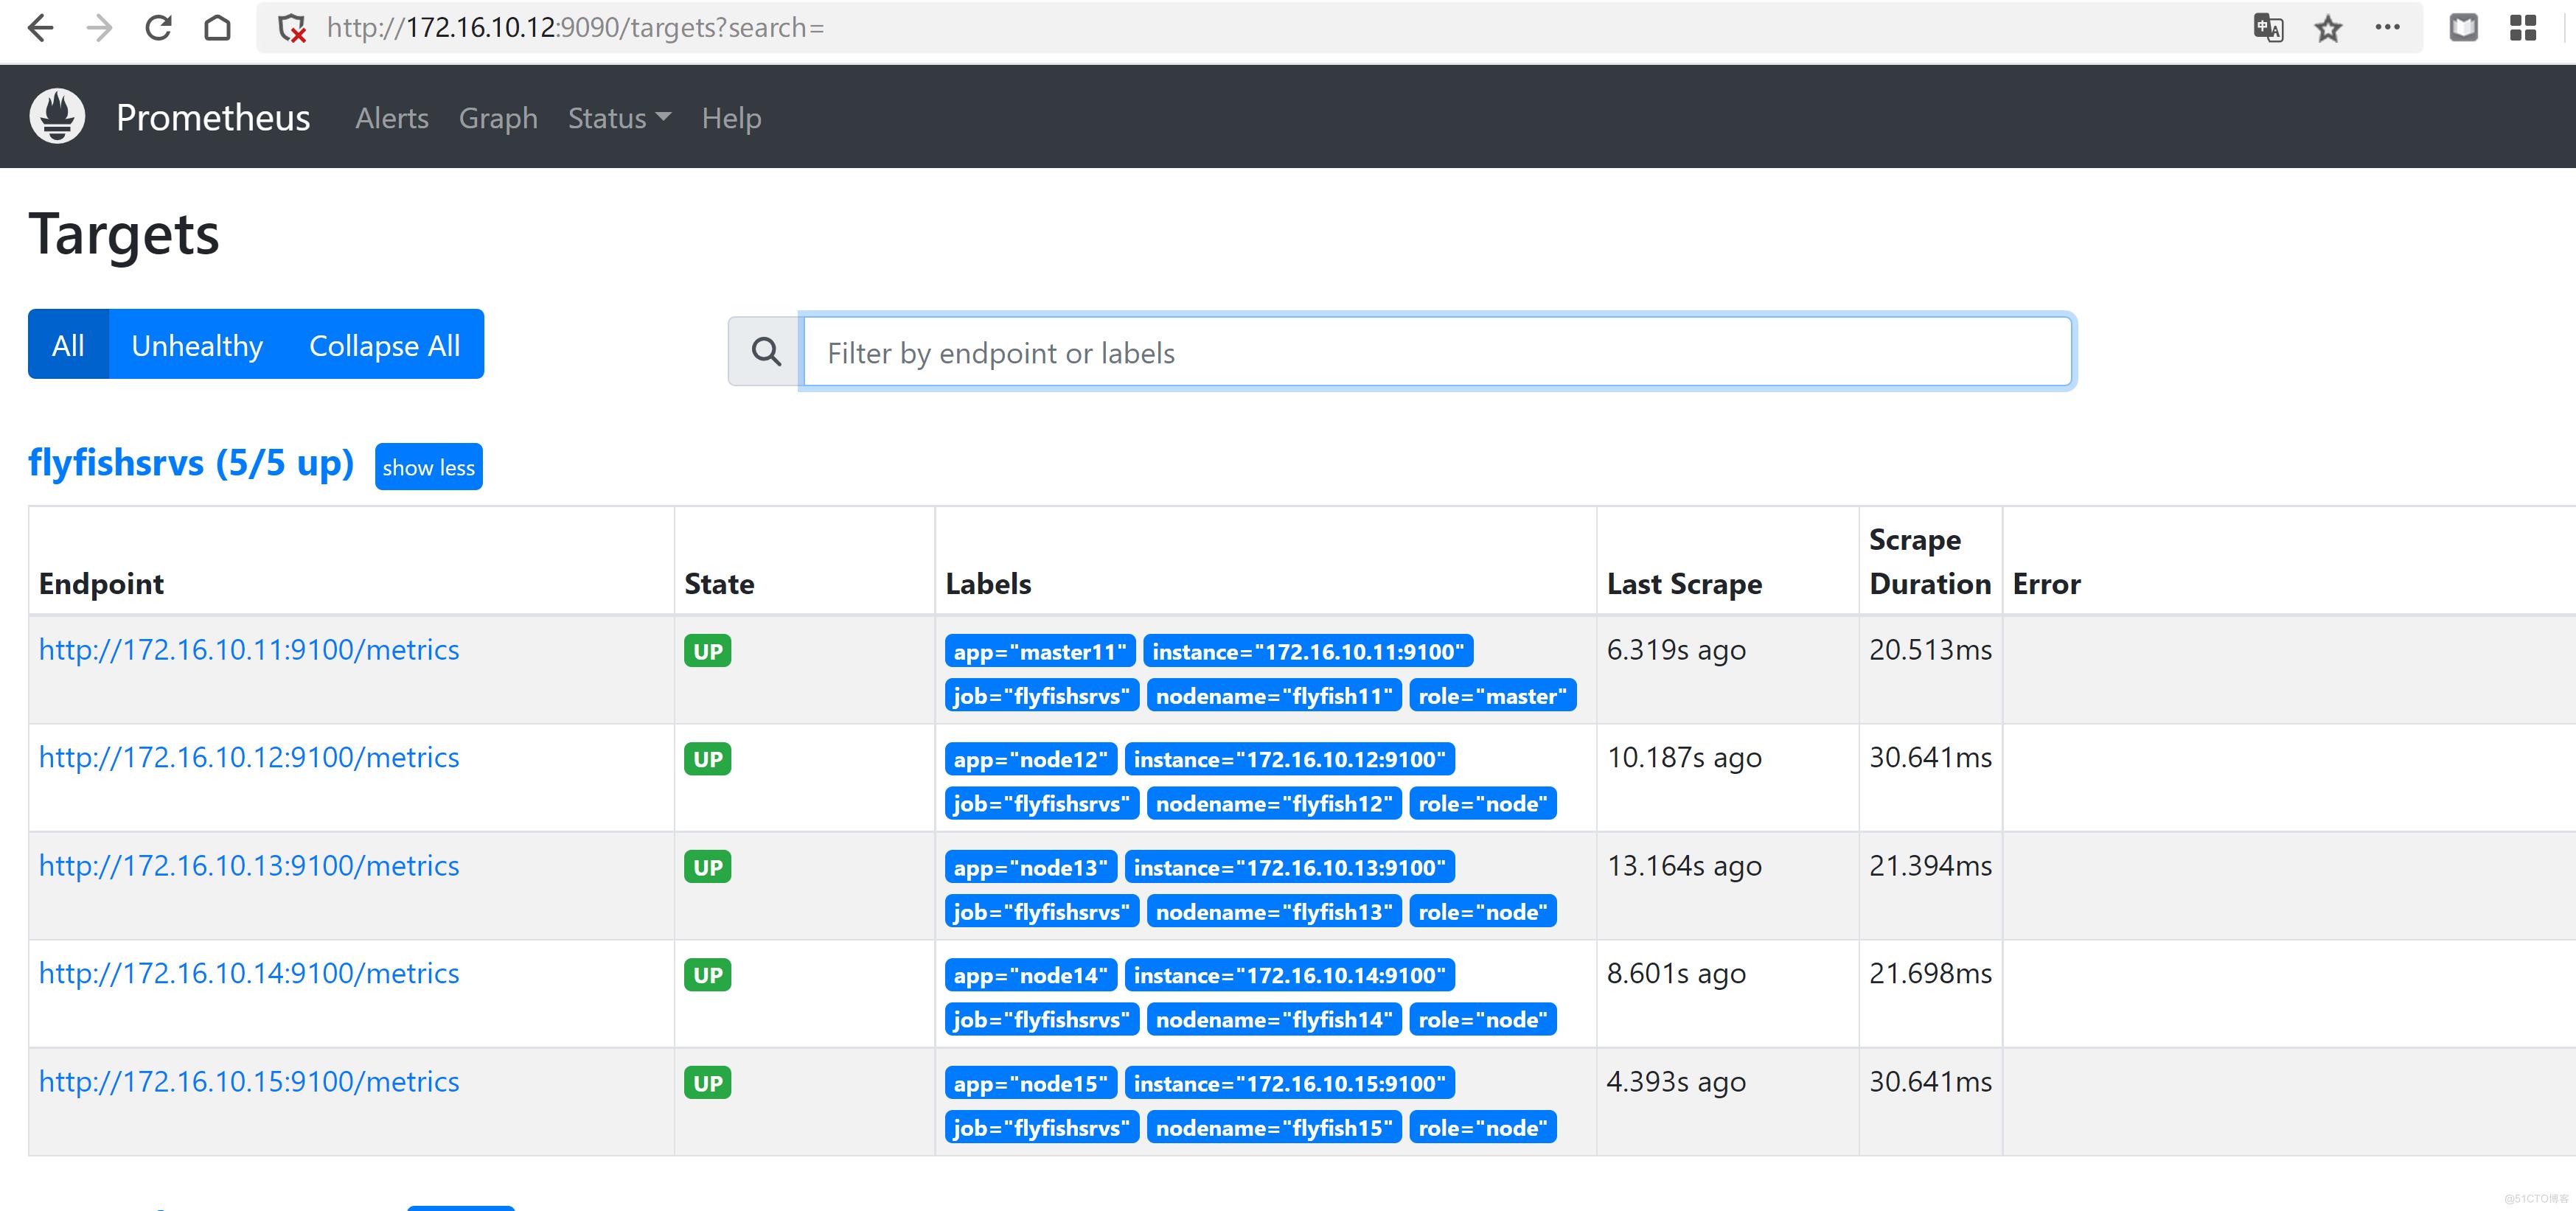
flyfish11 /flyfish12 采集的的一样

这个时候如果在prometheus 上端做一个nginx 负载 前端加上grafana 做图表展示
如果其中一台prometheus 挂了 nginx 负载在这台 挂断的机器上面,就会出现数据展示图的短缺问题
四:thanos 的的部署
thanos 只需要两个组件就可以形成一个机器,thanos-query 和thanos-sidecar
用来抽象采集出数据层,从而来提供查询接口

下载:
    https://github.com/thanos-io/thanos/releases
4.1 thanos-sidecar
tar -zxvf thanos-0.30.1.linux-amd64.tar.gz
cd thanos-0.30.1.linux-amd64
cp -ap thanos /usr/bin/
thanos --help
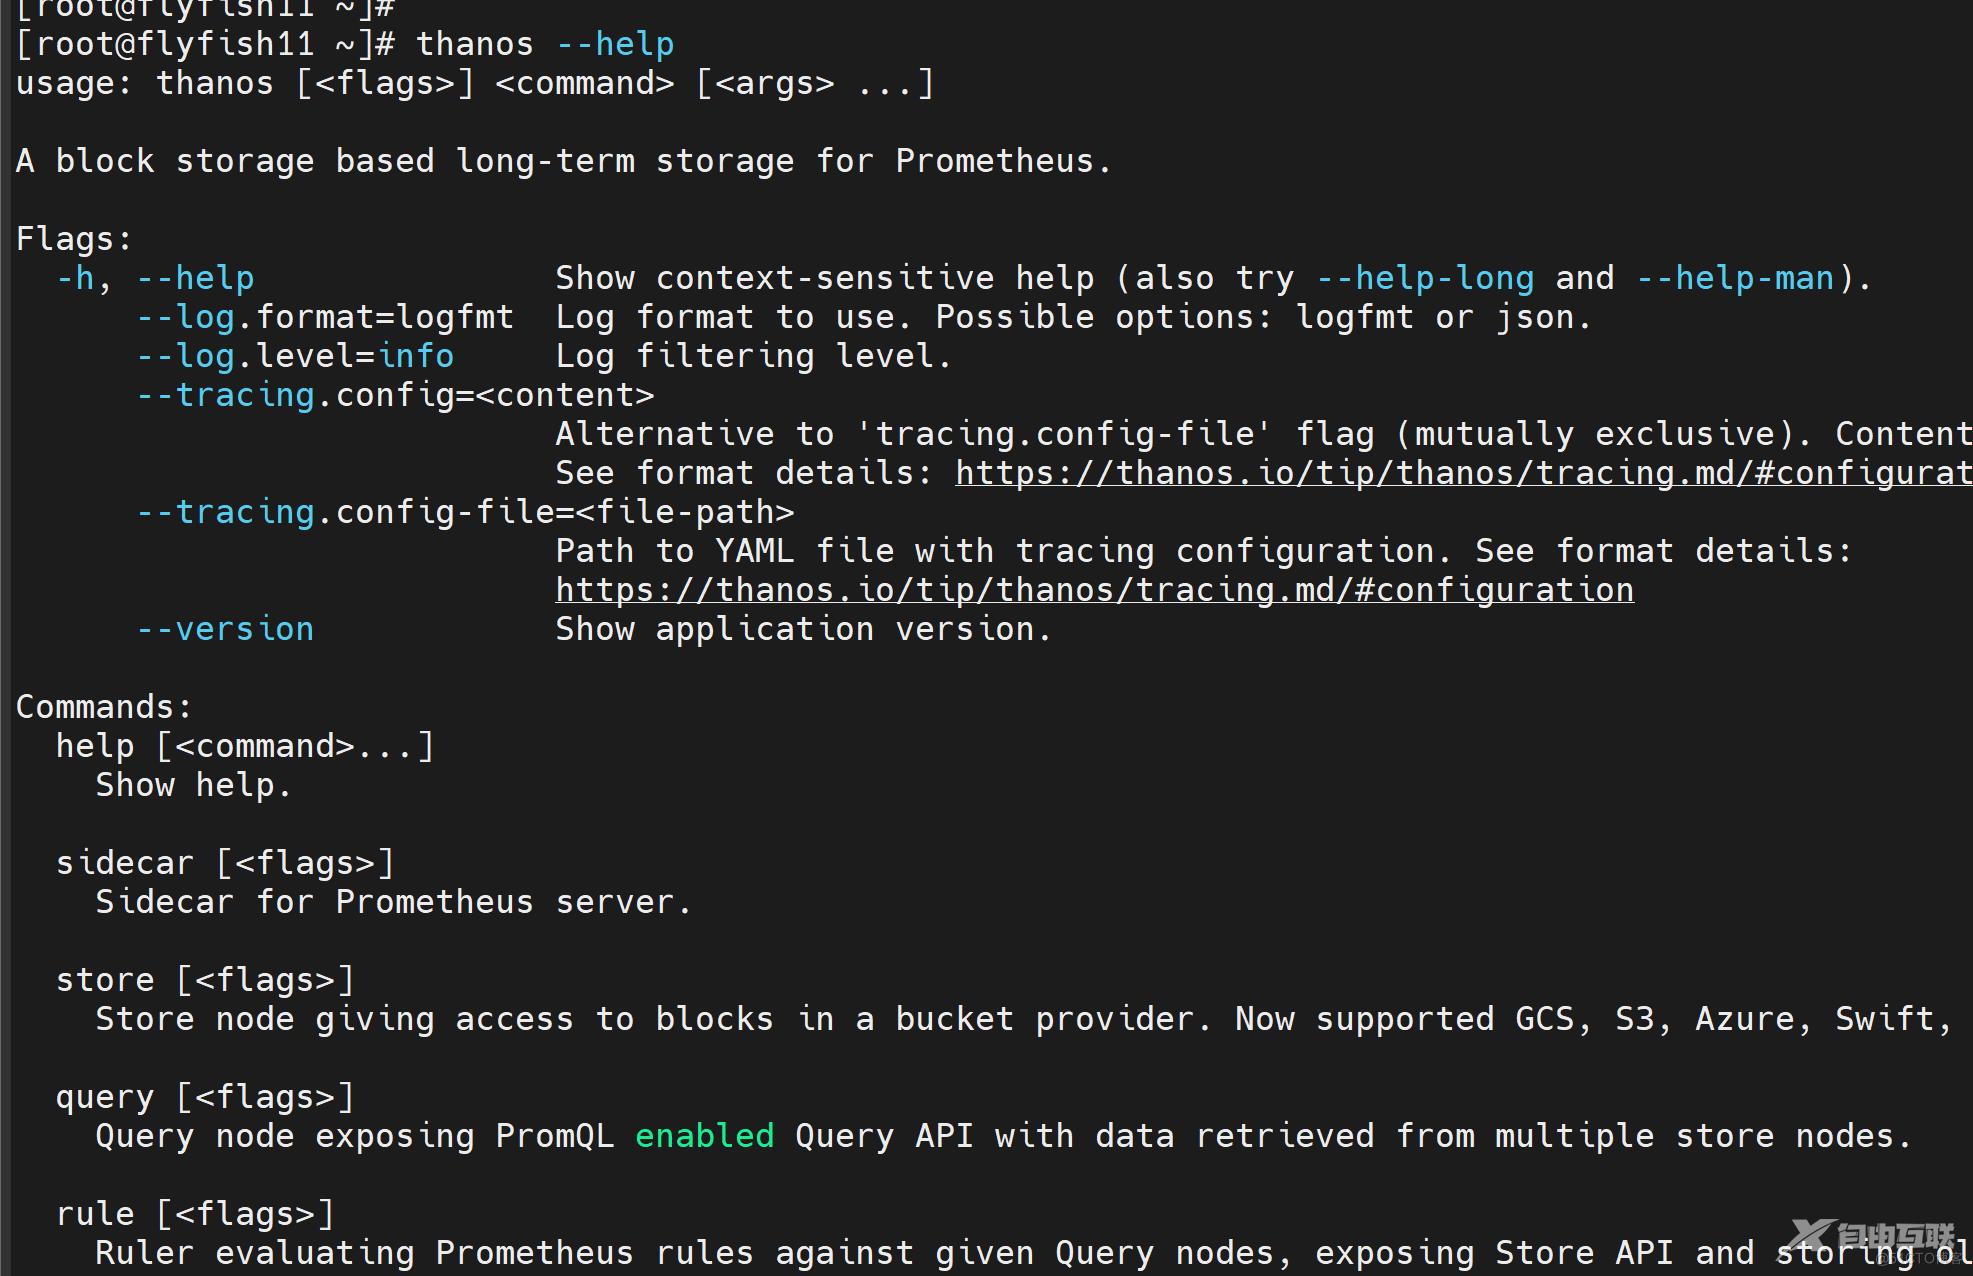
thanos sidecar 启动
---
cat > /usr/lib/systemd/system/thanos-sidecar.service <<EOF
[Unit]
Description=thanos-sidecar
Documentation=https://thanos.io/
After=network.target
[Service]
Type=simple
ExecStart=/usr/bin/thanos sidecar \
--tsdb.path=/var/lib/prometheus/data \
--prometheus.url=http://localhost:9090 \
--http-address=0.0.0.0:10901 \
--grpc-address=0.0.0.0:10902
ExecReload=/bin/kill -HUP
TimeoutStopSec=20s
Restart=always
[Install]
WantedBy=multi-user.target
EOF
---
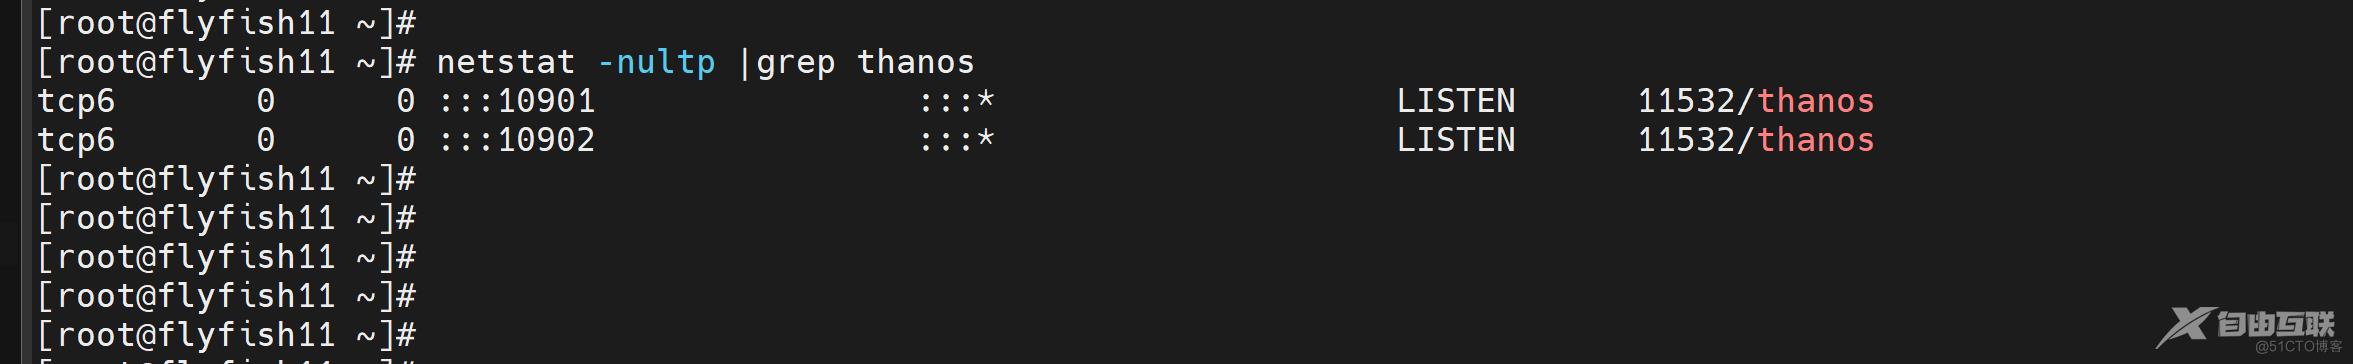
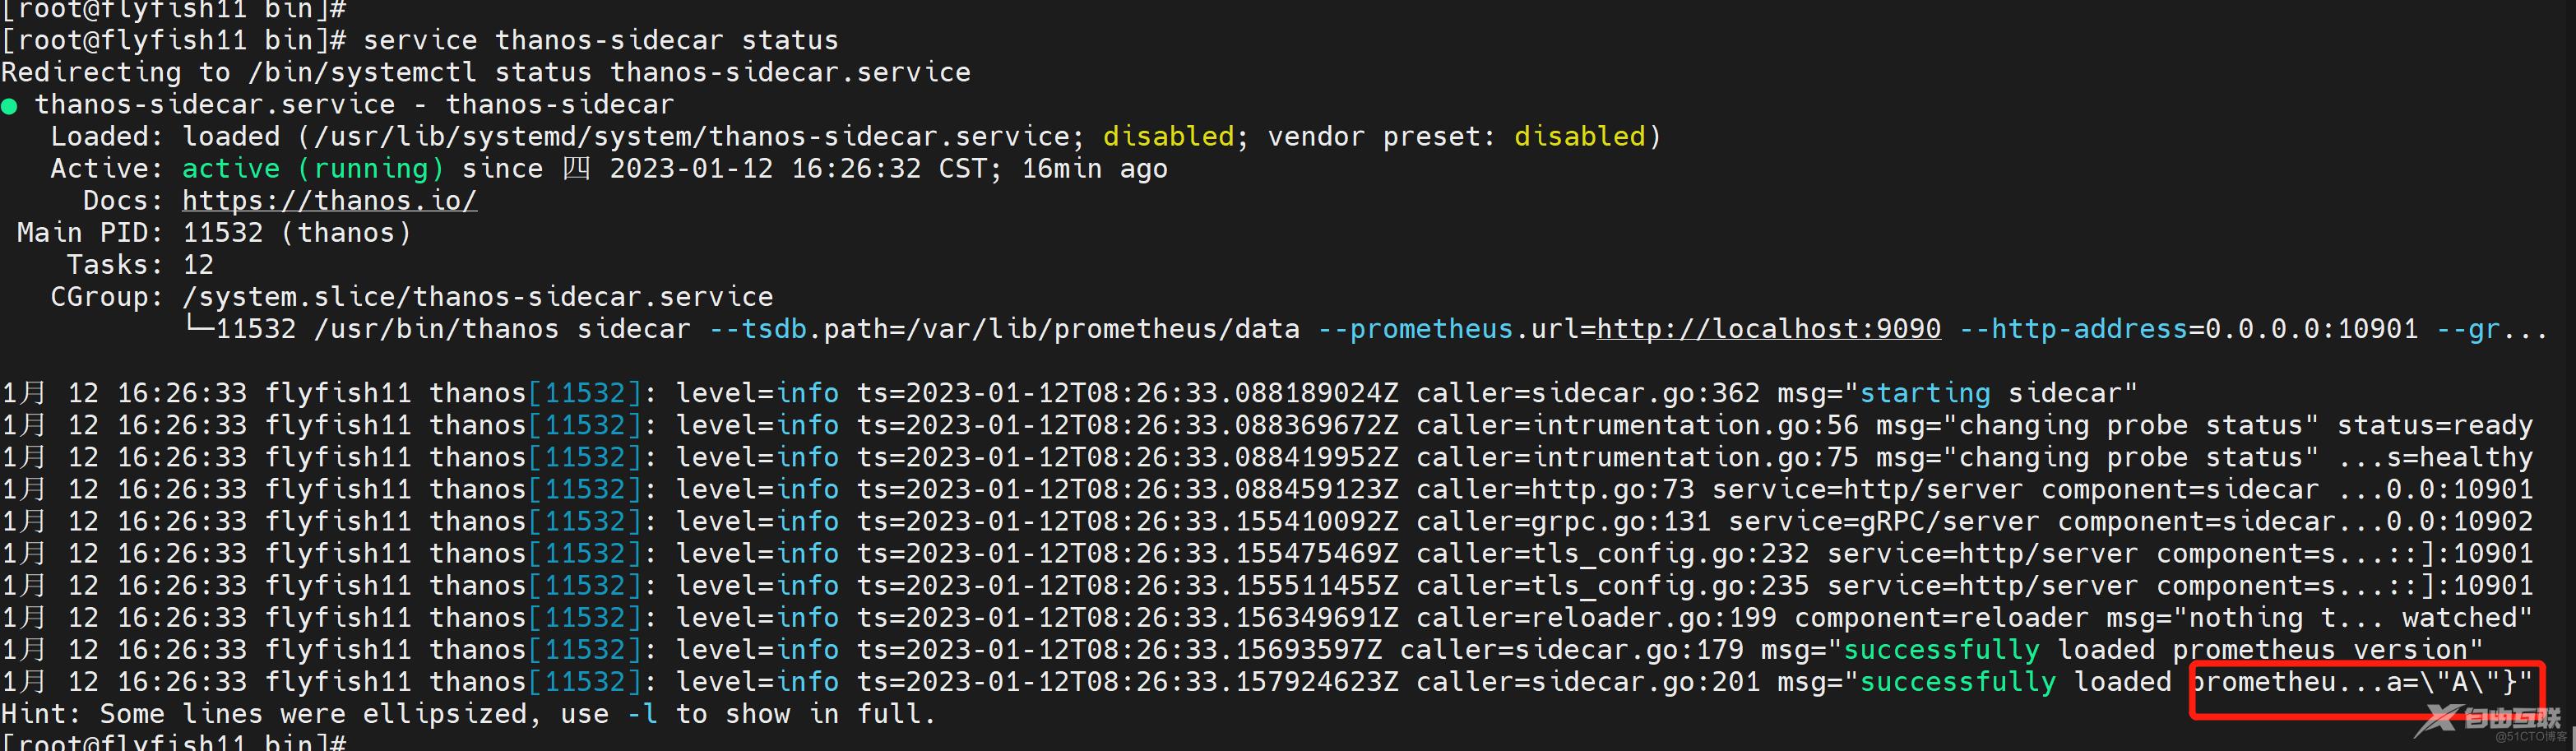
service thanos-sidecar start
service thanos-sidecar status
chkconfig thanos-sidecar on
flyfish12 同样部署
4.3 thanos-query
query 用来做查询所有可能数据接口,比如sidecar 或者storage-gateway
这里并没有将数据进行远程写,所以我们使用只需要查询sidecar 就行了
--------------
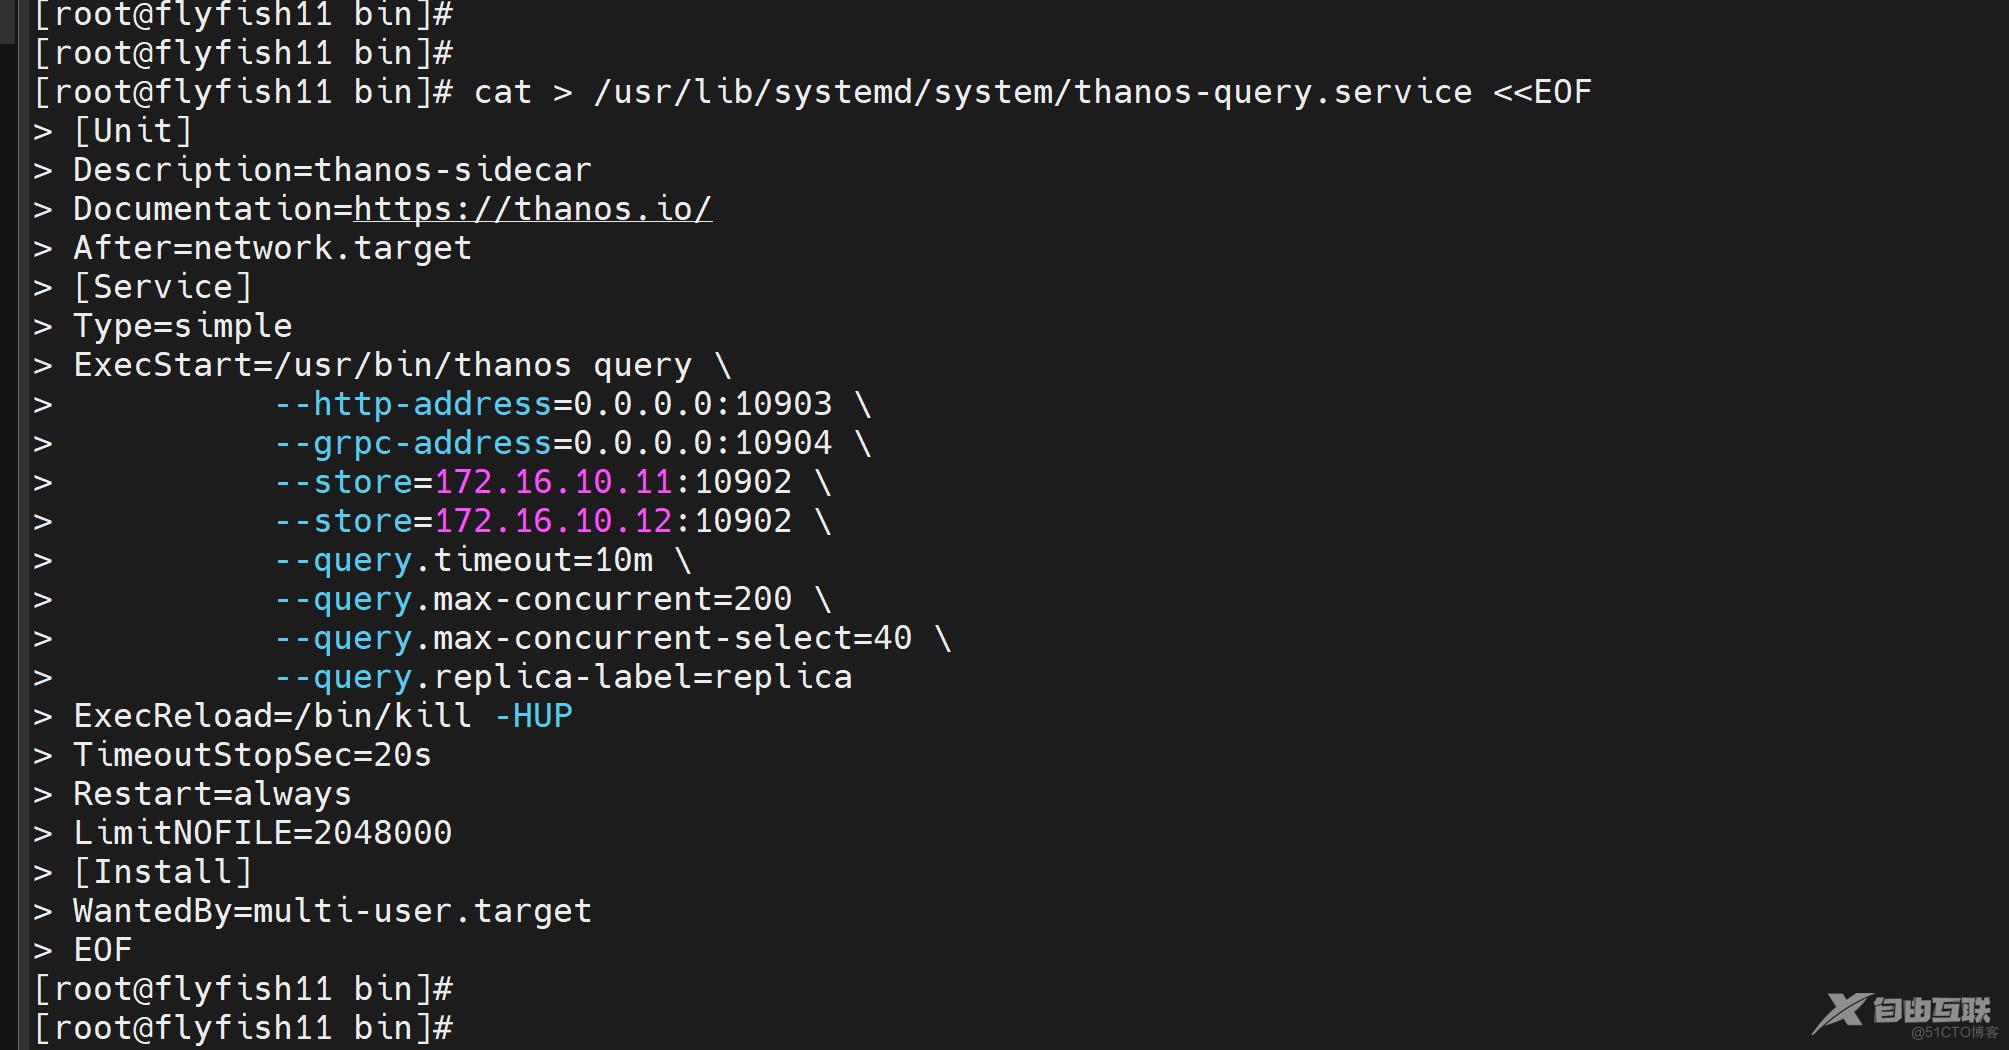
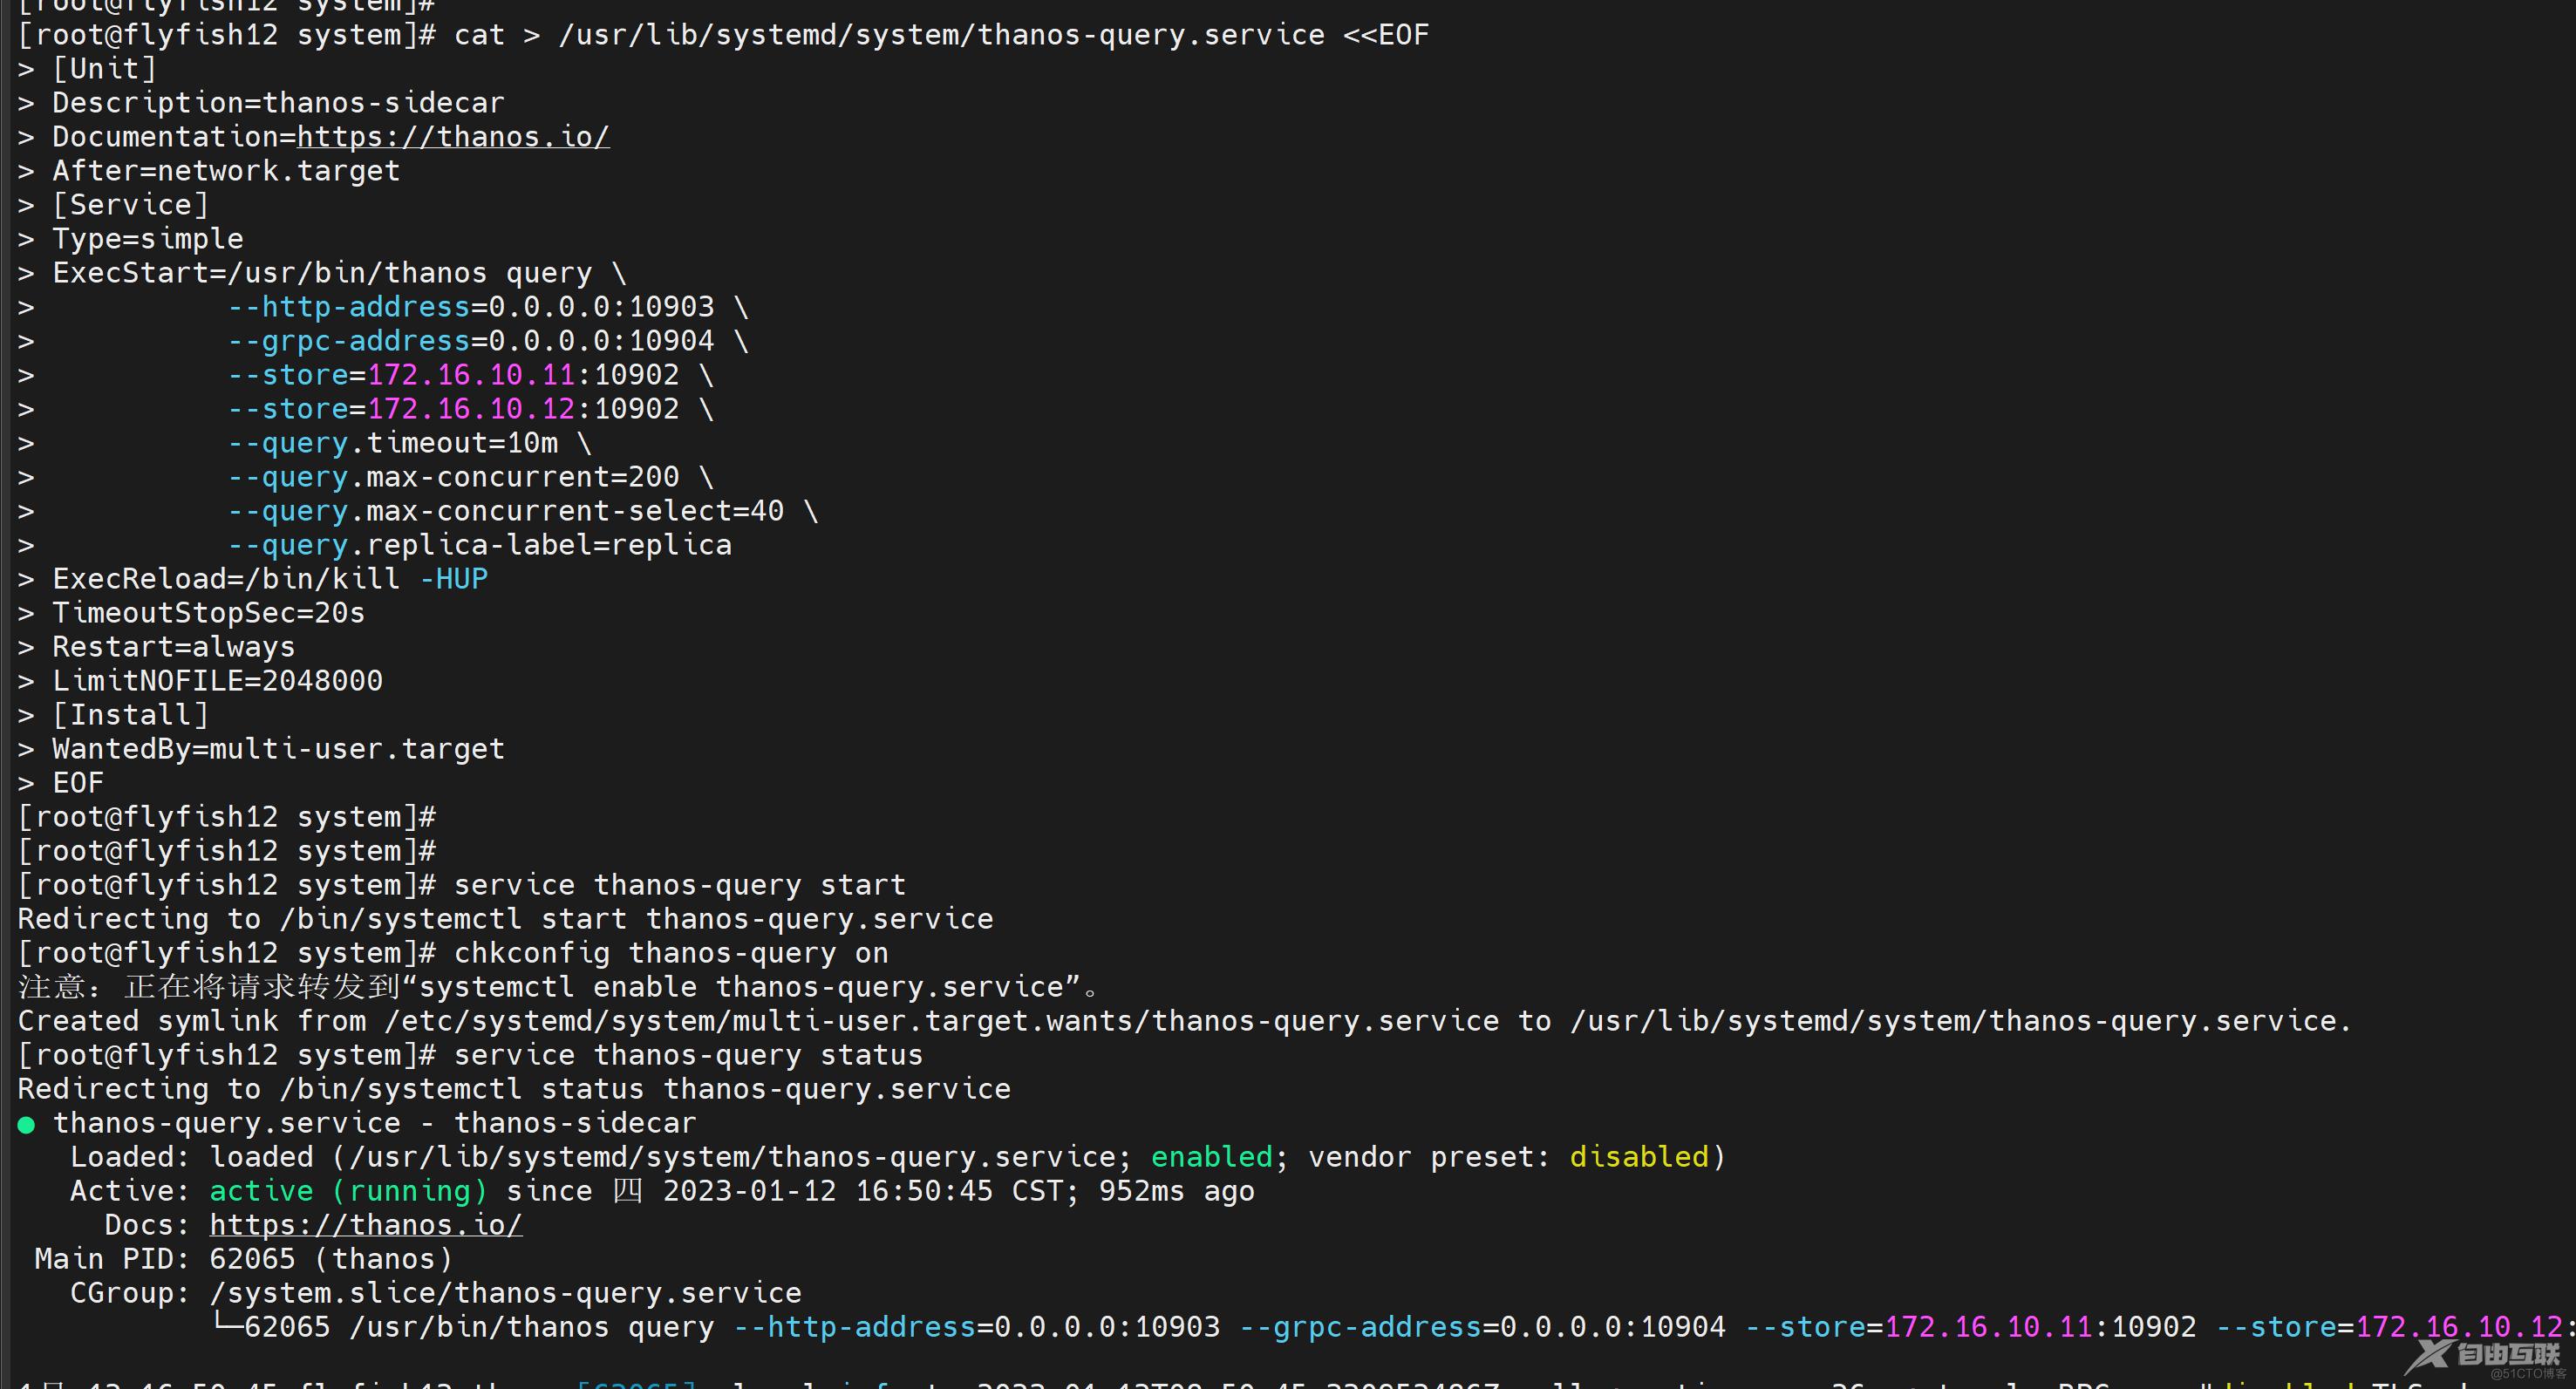
cat > /usr/lib/systemd/system/thanos-query.service <<EOF
[Unit]
Description=thanos-sidecar
Documentation=https://thanos.io/
After=network.target
[Service]
Type=simple
ExecStart=/usr/bin/thanos query \
--http-address=0.0.0.0:10903 \
--grpc-address=0.0.0.0:10904 \
--store=172.16.10.11:10902 \
--store=172.16.10.12:10902 \
--query.timeout=10m \
--query.max-concurrent=200 \
--query.max-concurrent-select=40 \
--query.replica-label=replica
ExecReload=/bin/kill -HUP
TimeoutStopSec=20s
Restart=always
LimitNOFILE=2048000
[Install]
WantedBy=multi-user.target
EOF
-----
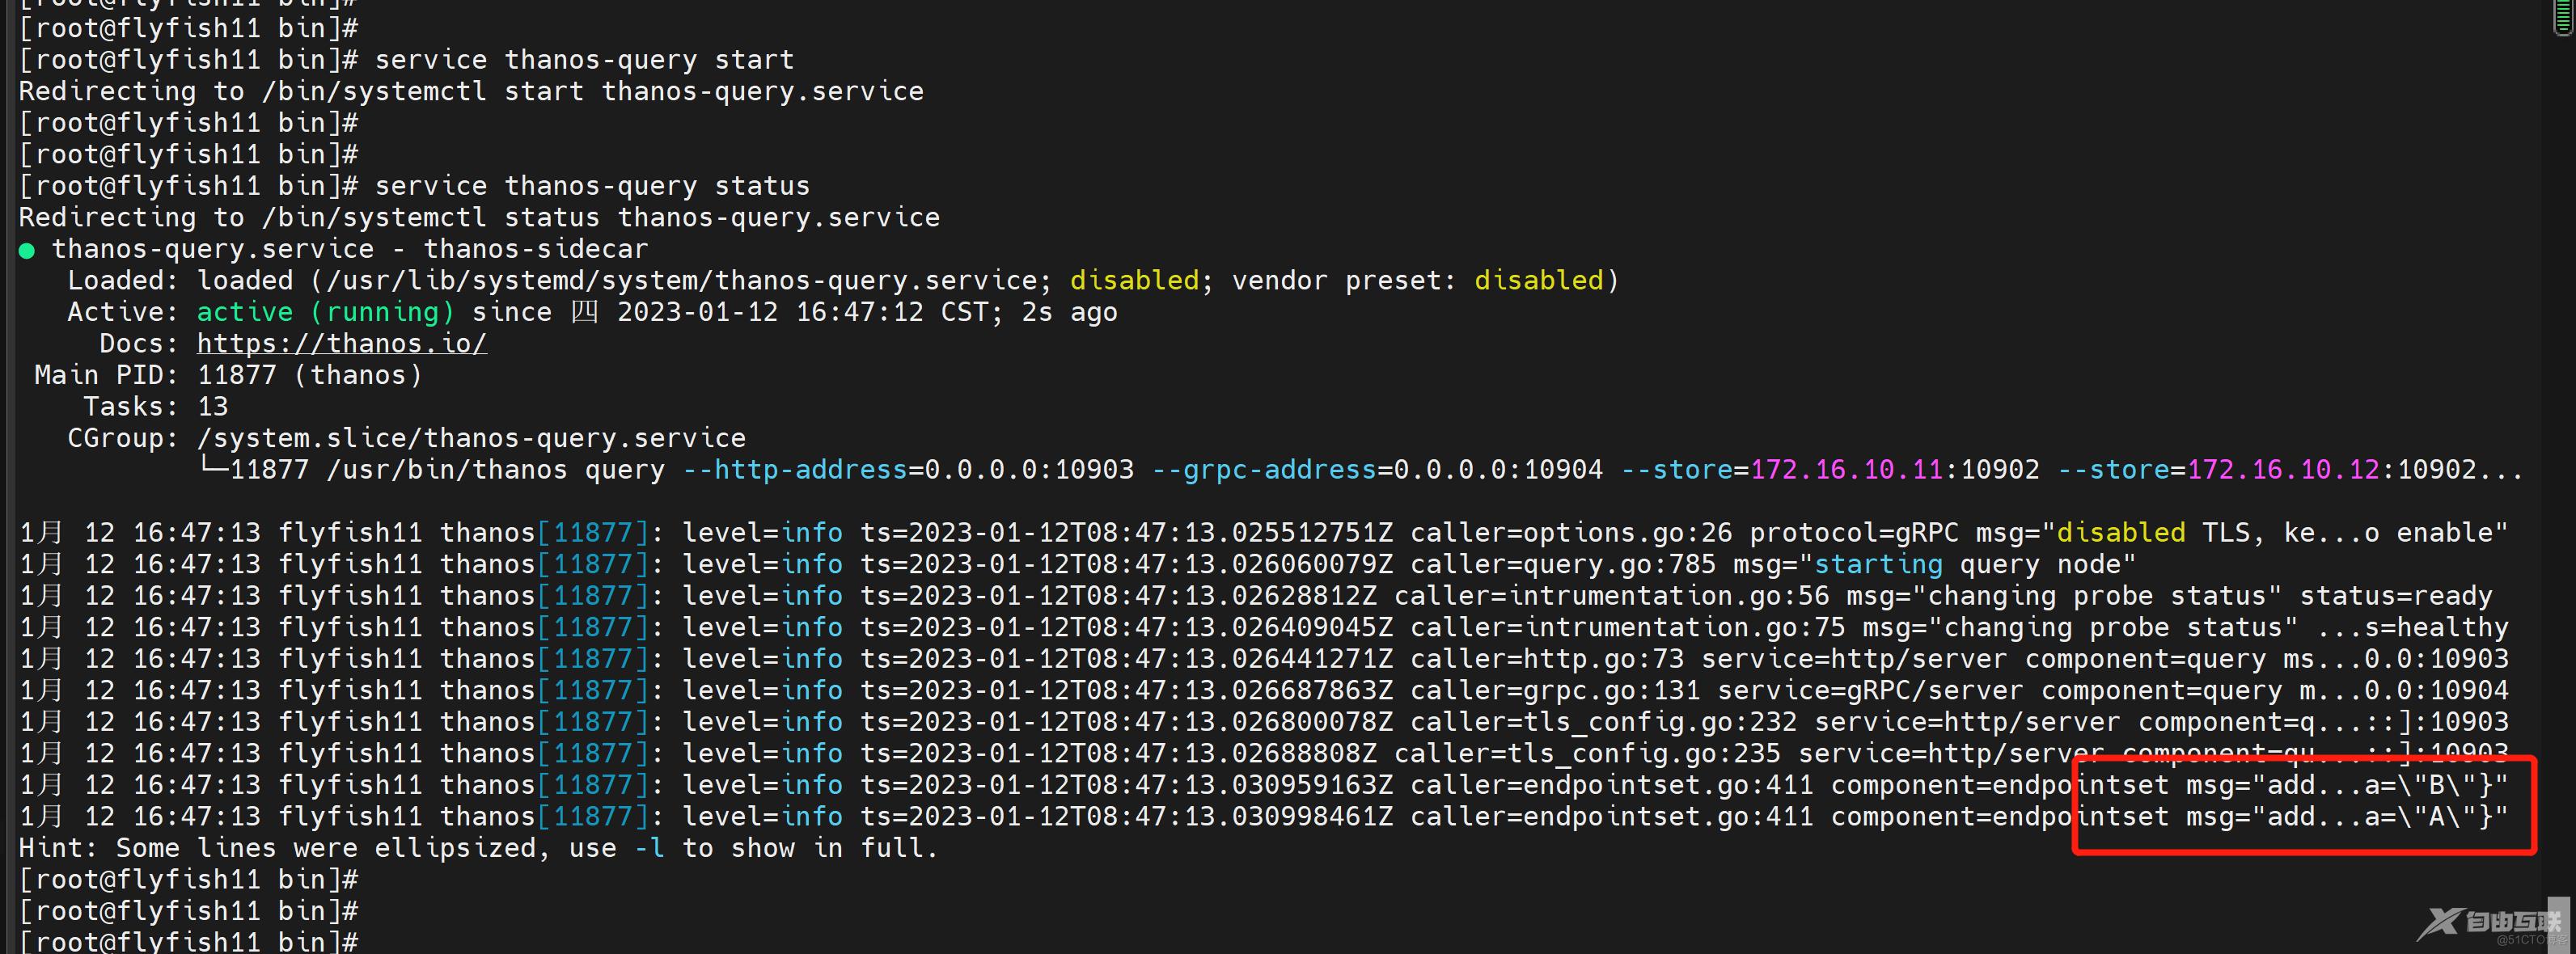
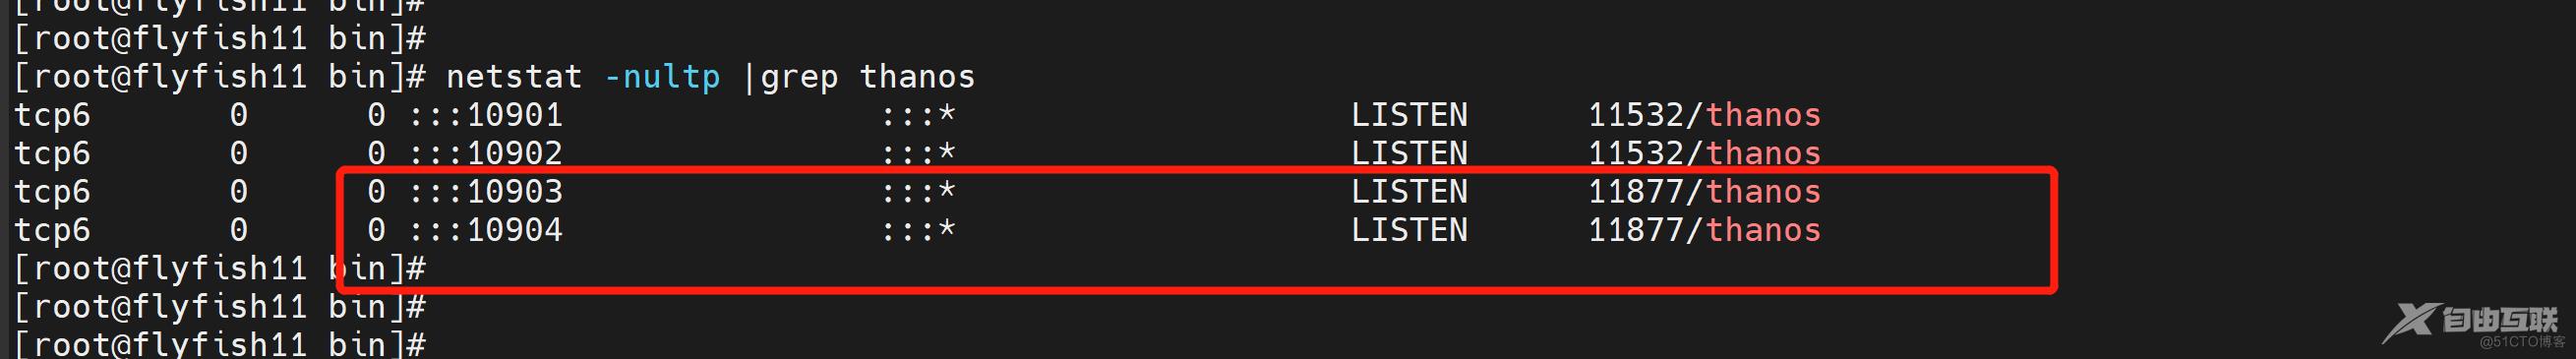
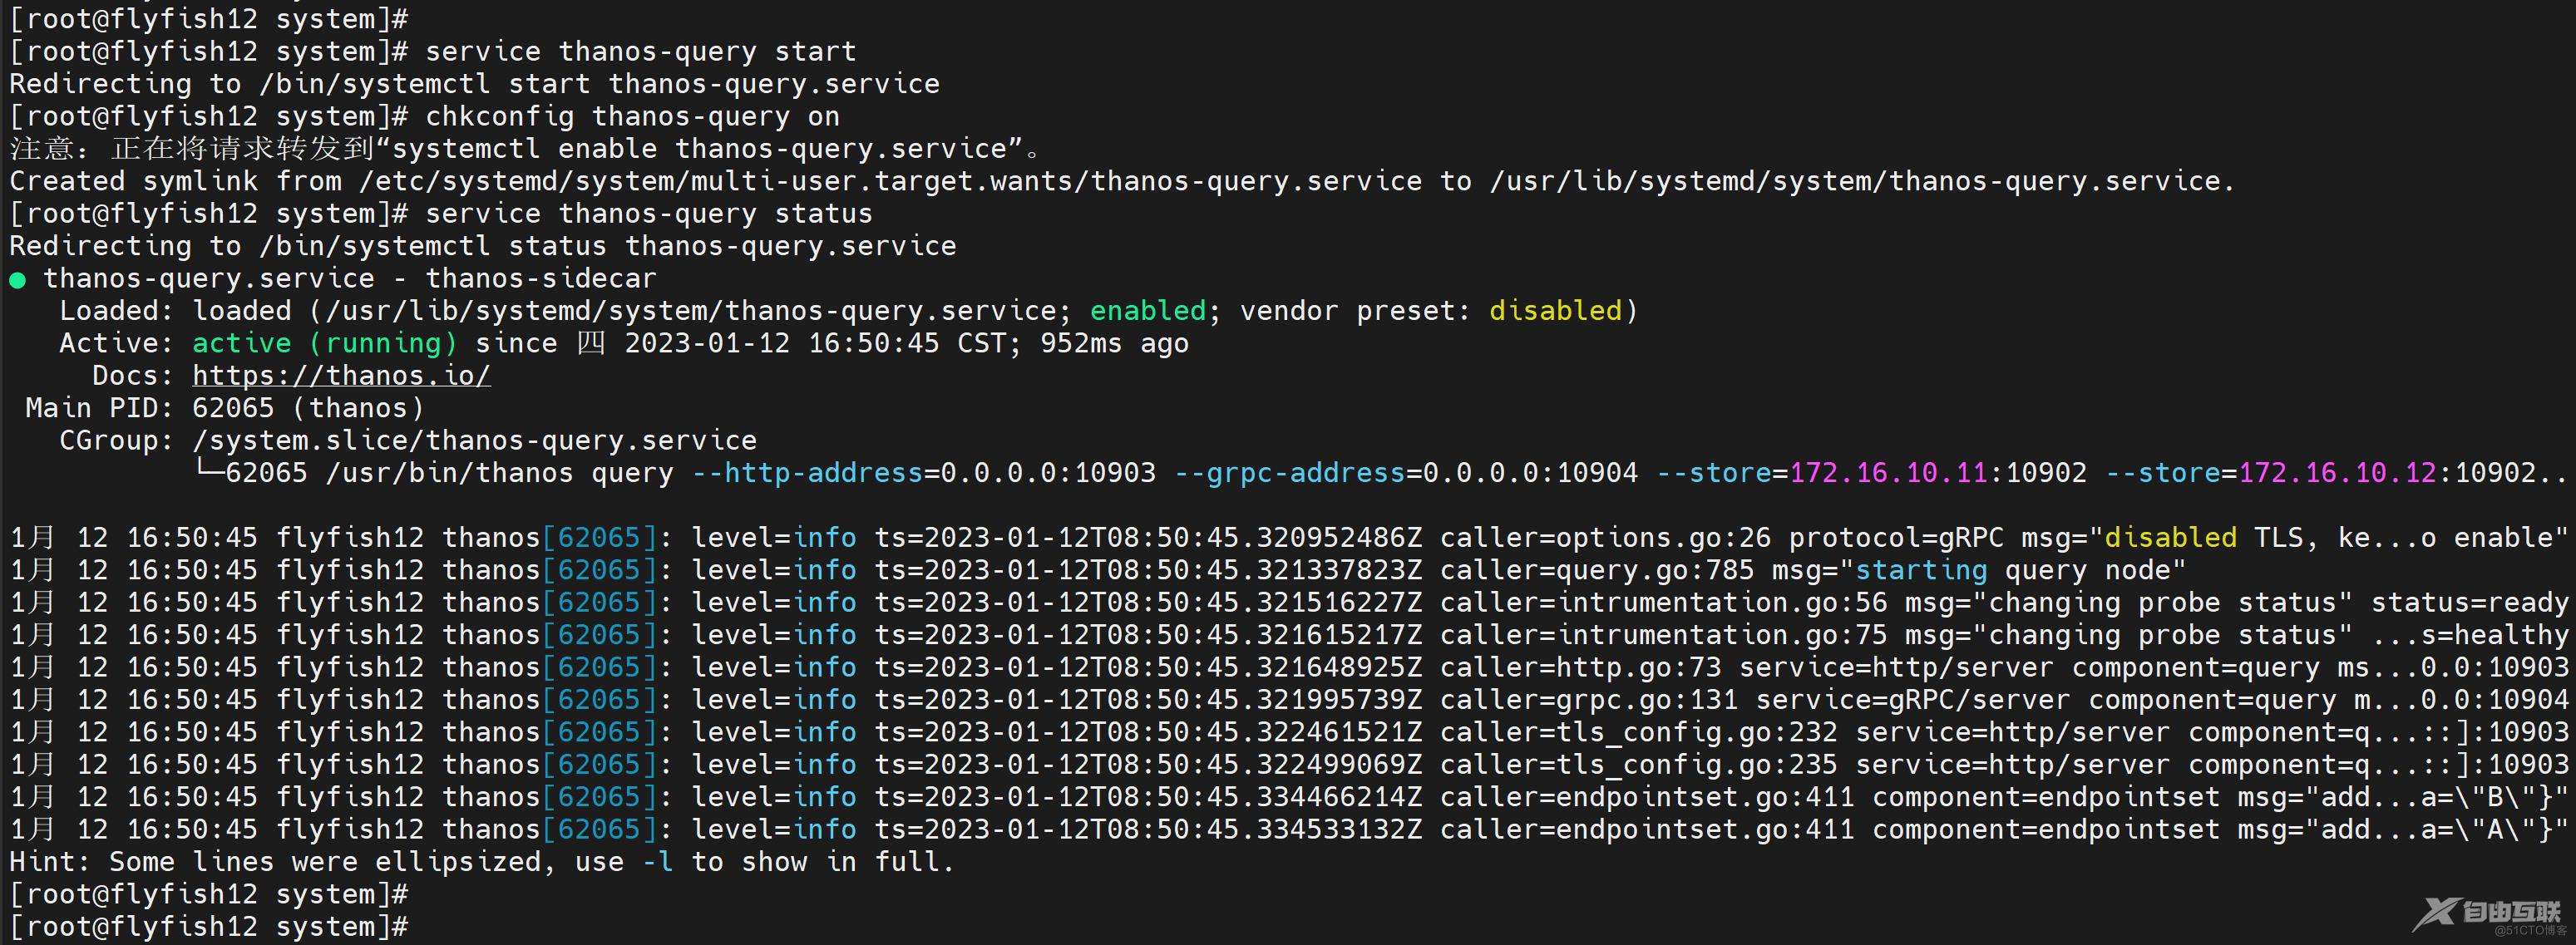
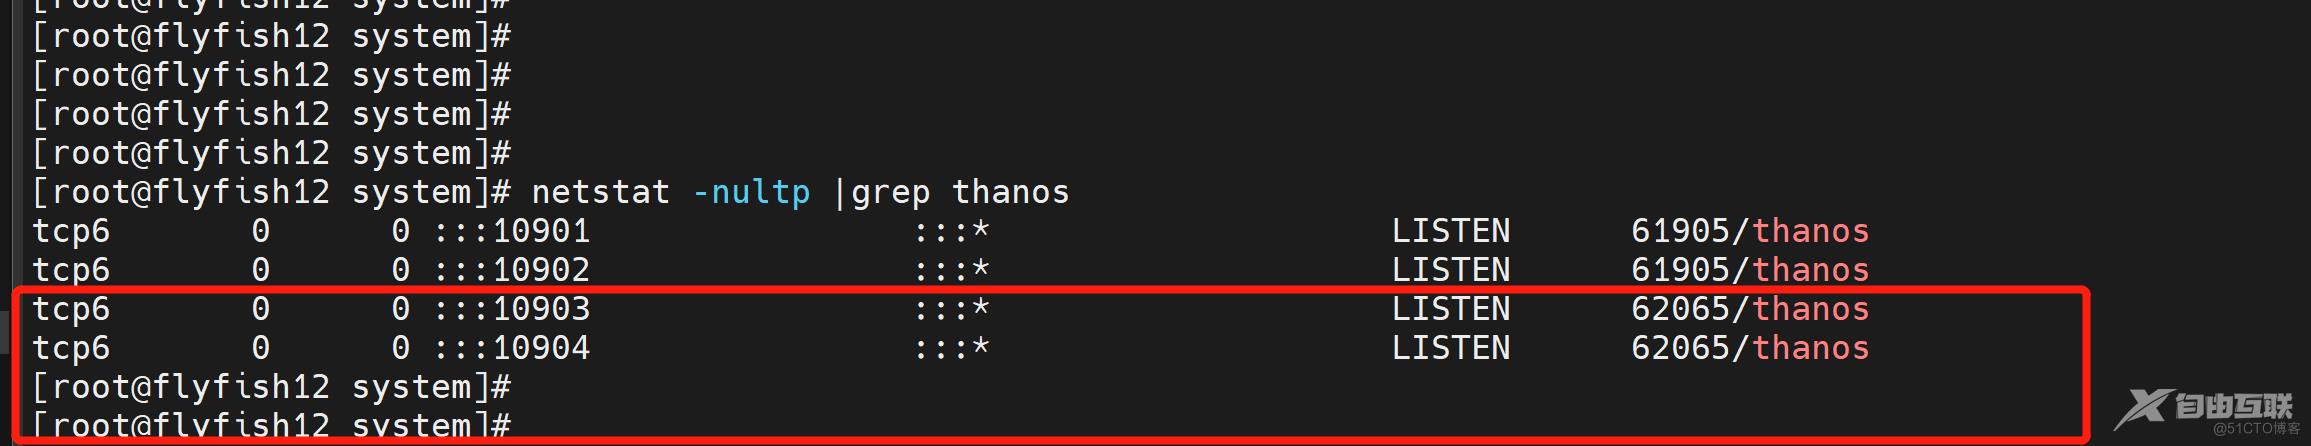
service thanos-query start
chkconfig thanos-query on
service thanos-query status
flyfish12 主机一样的配置
四:配置nginx 负载均衡代理
在flyfish13 机器上安装nginx
nginx服务器 地址: flyfish13 (172.16.10.13)
nginx的编译安装:
配置依赖包:
yum -y install gcc pcre pcre-devel zlib zlib-devel openssl openssl-devel gd gd-devel
tar -zxvf nginx-1.23.2.tar.gz
cd nginx-1.23.2/
./configure \
--prefix=/usr/local/nginx \
--http-proxy-temp-path=/usr/local/nginx/proxy_temp \
--http-fastcgi-temp-path=/usr/local/nginx/fastcgi_temp \
--with-http_ssl_module \
--with-threads \
--with-file-aio \
--with-http_ssl_module \
--with-http_realip_module \
--with-http_gzip_static_module \
--with-http_secure_link_module \
--with-http_stub_status_module \
--with-http_auth_request_module \
--with-http_random_index_module \
--with-http_image_filter_module \
--with-stream
make && make install
---------------------------------------------------
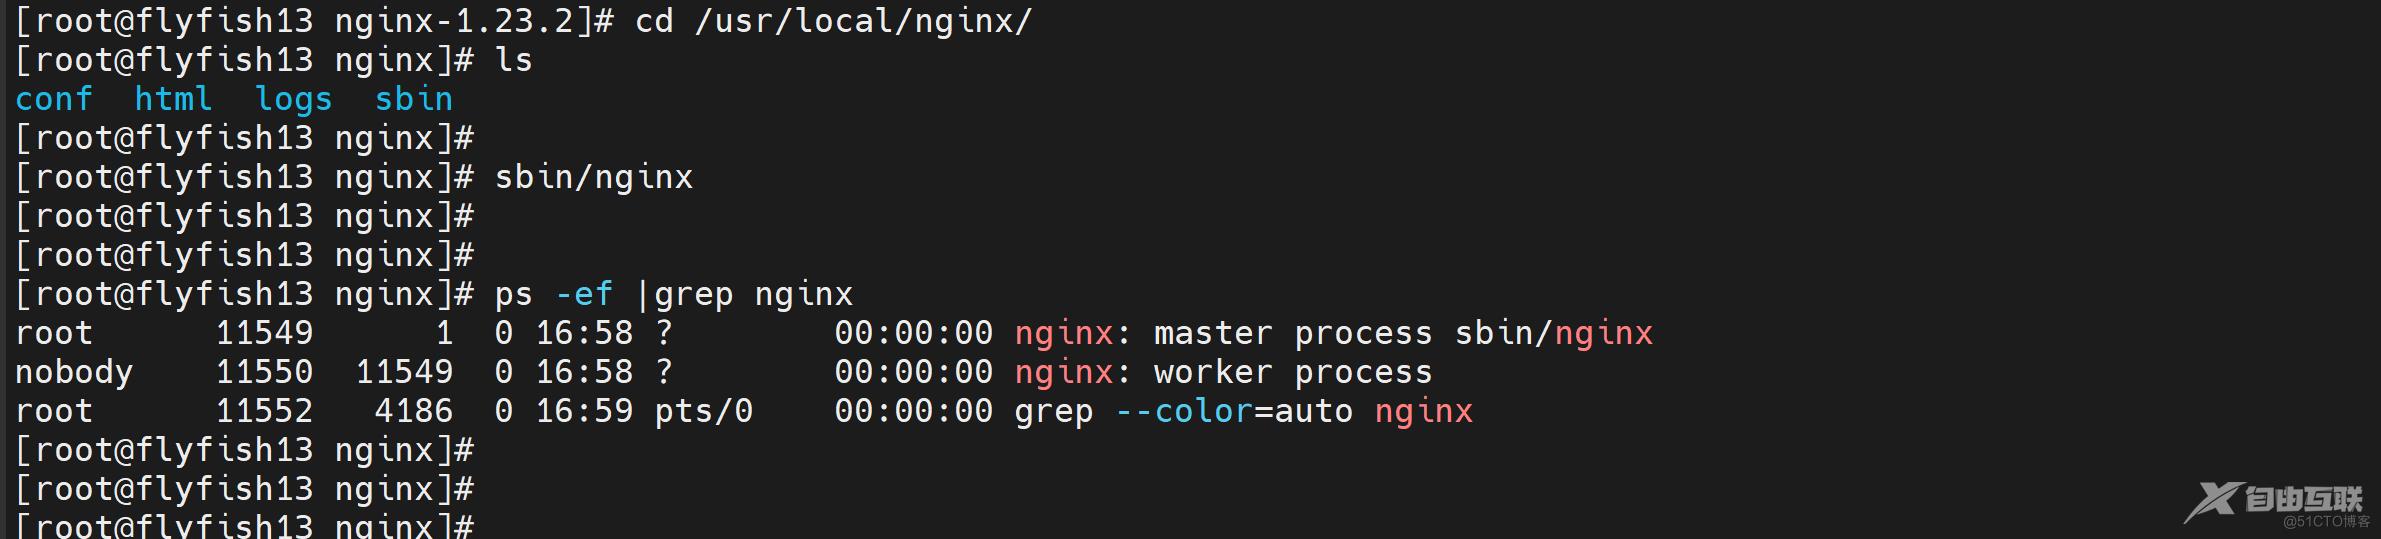
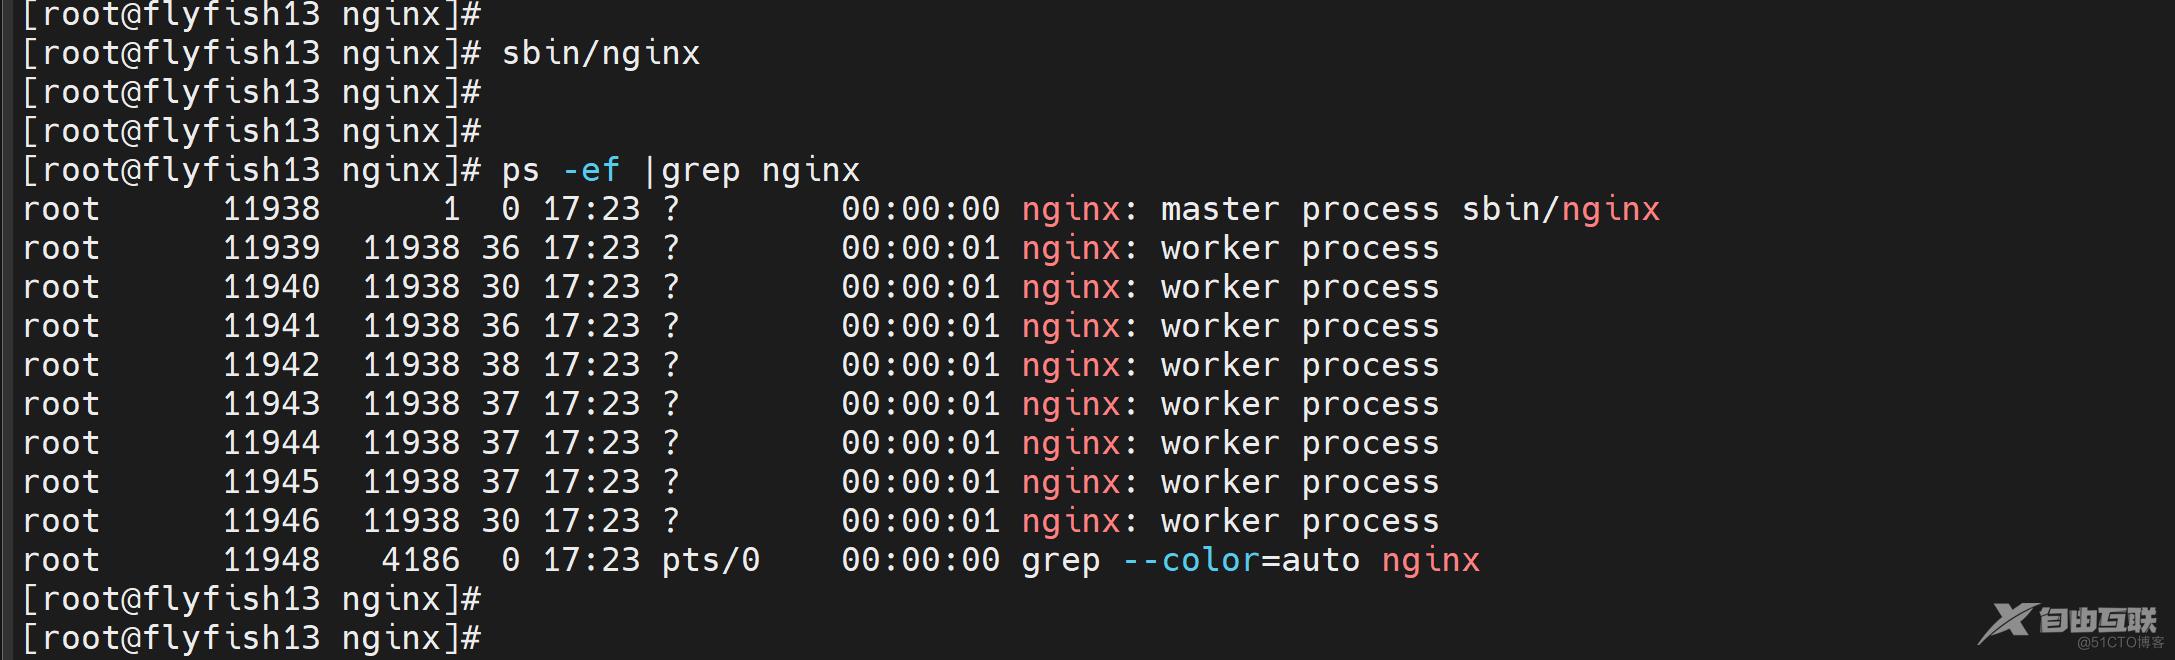
cd /usr/local/nginx/
sbin/nginx
ps -ef |grep nginx
cd /usr/local/nginx/conf/
cp -ap nginx.conf nginx.conf.bak
vim nginx.conf
------------
user root root;
worker_processes auto;
worker_cpu_affinity auto;
worker_rlimit_nofile 65535;

daemon on;
error_log /usr/local/nginx/logs/error.log warn;
pid /usr/local/nginx/pid/nginx.pid;

events {
    use epoll;
    worker_connections  65535;
}

# 开启环境变量
env SPRING_PROFILES_ACTIVE=master;

http {

    include mime.types;
    default_type application/octet-stream;

    charset utf-8;

    log_format main '$remote_addr - $remote_user [$time_local] '
                    '"$request" $status $body_bytes_sent '
                    '"$http_referer" "$http_user_agent" '
                    '"$http_x_forwarded_for" $host $request_time $upstream_response_time $scheme';

    log_format main1 '$remote_addr|$remote_user|[$time_local]|$request|'
                     '$status|$upstream_status|$body_bytes_sent|$http_referer|'
                     '$http_user_agent|$request_time|$host|$upstream_addr|$request_body|$upstream_response_time';

    log_format main3 '$http_x_forwarded_for|$remote_user|[$time_local]|$request|'
                     '$status|$upstream_status|$body_bytes_sent|$http_referer|'
                     '$http_user_agent|$request_time|$host|$upstream_addr|$request_body|$upstream_response_time';

    log_format lua '$remote_addr|$remote_user|[$time_local]|$request|'
                     '$status|$body_bytes_sent|$http_referer|'
                     '$http_user_agent|$request_time|$host|$upstream_addr|$upstream_response_time';

    log_format    main2  escape=json
        '{"@timestamp":"$time_iso8601",'
        '"host":"$hostname",'
        '"server_ip":"$server_addr",'
        '"client_ip":"$http_x_forwarded_for",'
        '"xff":"$http_x_forwarded_for",'
        '"domain":"$host",'
        '"url":"$uri",'
        '"referer":"$http_referer",'
        '"args":"$args",'
        '"upstreamtime":"$upstream_response_time",'
        '"responsetime":"$request_time",'
        '"request_method":"$request_method",'
        '"status":"$status",'
        '"size":"$body_bytes_sent",'
        '"request_body":"$request_body",'
        '"request_length":"$request_length",'
        '"protocol":"$server_protocol",'
        '"upstreamhost":"$upstream_addr",'
        '"file_dir":"$request_filename",'
        '"http_user_agent":"$http_user_agent"'
     '}';

    #基础优化
    server_tokens off;

    sendfile on;
    tcp_nopush on;
    tcp_nodelay on;

    keepalive_timeout  65;
    keepalive_requests 8192;

    # gzip
    gzip on;
    gzip_min_length 1k;
    gzip_buffers 4 16k;
    gzip_comp_level 3;
    gzip_types text/plain application/javascript  text/css application/json application/x-javascript text/xml application/xml application/xml+rss text/javascript application/x-httpd-php image/jpeg image/gif image/png;
    gzip_vary on;

    client_body_timeout 300;
    client_header_timeout 300;
    send_timeout 600;
    reset_timedout_connection on;

    client_max_body_size 50m;
    #client_body_buffer_size 4096k;
    client_body_buffer_size 8192k;

    #client_header_buffer_size 4k;
    #large_client_header_buffers 4 64k;
    client_header_buffer_size 16k;
    large_client_header_buffers 8 256k;

    server_names_hash_bucket_size 512;

    proxy_connect_timeout 600;
    proxy_read_timeout 600;
    proxy_send_timeout 600;

    proxy_buffer_size  128k;
    proxy_buffers   8 128k;
    proxy_busy_buffers_size 256k;

    output_buffers 1 32k;
    postpone_output 1460;

    open_file_cache max=65535 inactive=60s;
    open_file_cache_valid    80s;
    open_file_cache_min_uses 1;
    open_file_cache_errors   on;

    # fastcgi set
    fastcgi_ignore_client_abort       on;
    fastcgi_connect_timeout           300;
    fastcgi_send_timeout              300;
    fastcgi_read_timeout              300;
    #fastcgi_buffer_size               4k;
    #fastcgi_buffers                   8 4k;
    #fastcgi_busy_buffers_size         8k;
    #fastcgi_temp_file_write_size      8k;

    fastcgi_buffer_size               64k;
    fastcgi_buffers                   4 64k;
    fastcgi_busy_buffers_size         128k;
    fastcgi_temp_file_write_size      128k;

    # fastcgi TEST
    fastcgi_cache_valid 200 302 1h;
    fastcgi_cache_valid 301 1d;
    fastcgi_cache_valid any 1m;
    fastcgi_cache_min_uses 1;
    fastcgi_cache_use_stale error timeout invalid_header http_500;
    include /usr/local/nginx/conf/vhost/*.conf;

}

-----------
cd /usr/local/nginx/conf
mkdir vhost

cd vhost

vim thanos.conf

-----
server {

	  listen 80;
	  server_name flyfish13;
location / {

     # auth_basic "please enter you password";
     # auth_basic_user_file /usr/local/nginx/htpasswd;
     proxy_pass http://thanos;
     proxy_set_header Host $host;
     proxy_set_header X-Real-IP $remote_addr;
}

}

upstream thanos {
	 server 172.16.10.11:10903;
	 server 172.16.10.12:10903;
}

-----


sbin/nginx -s stop

sbin/nginx -t

sbin/nginx
五:安装 grafana
安装grafana
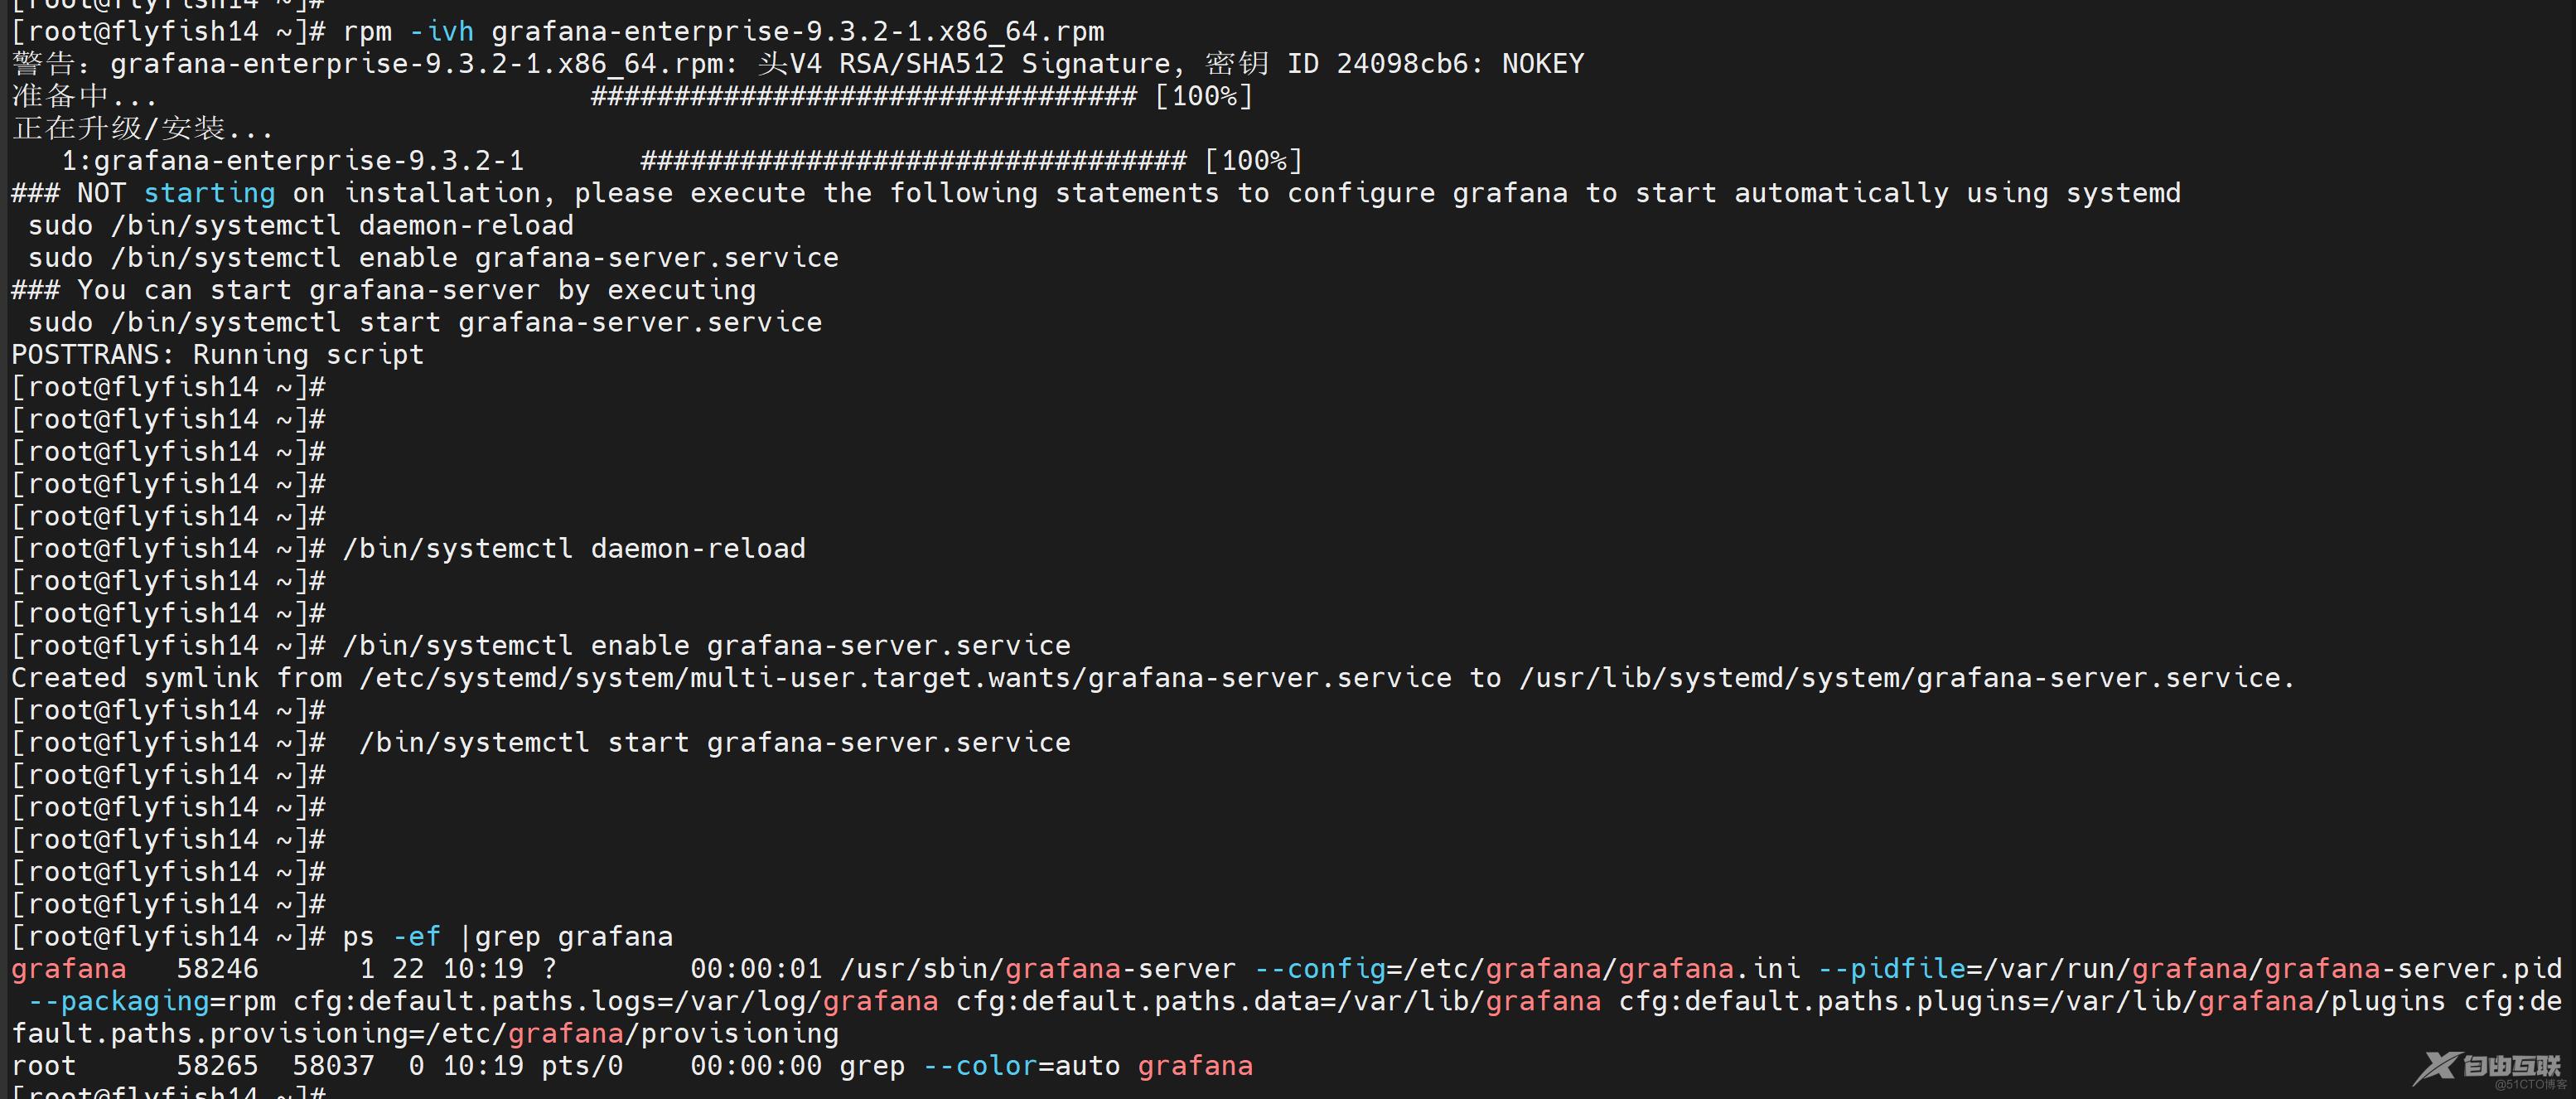
wget https://dl.grafana.com/enterprise/release/grafana-enterprise-9.3.2-1.x86_64.rpm
rpm -ivh grafana-enterprise-9.3.2-1.x86_64.rpm
/bin/systemctl daemon-reload
/bin/systemctl enable grafana-server.service
/bin/systemctl start grafana-server.service
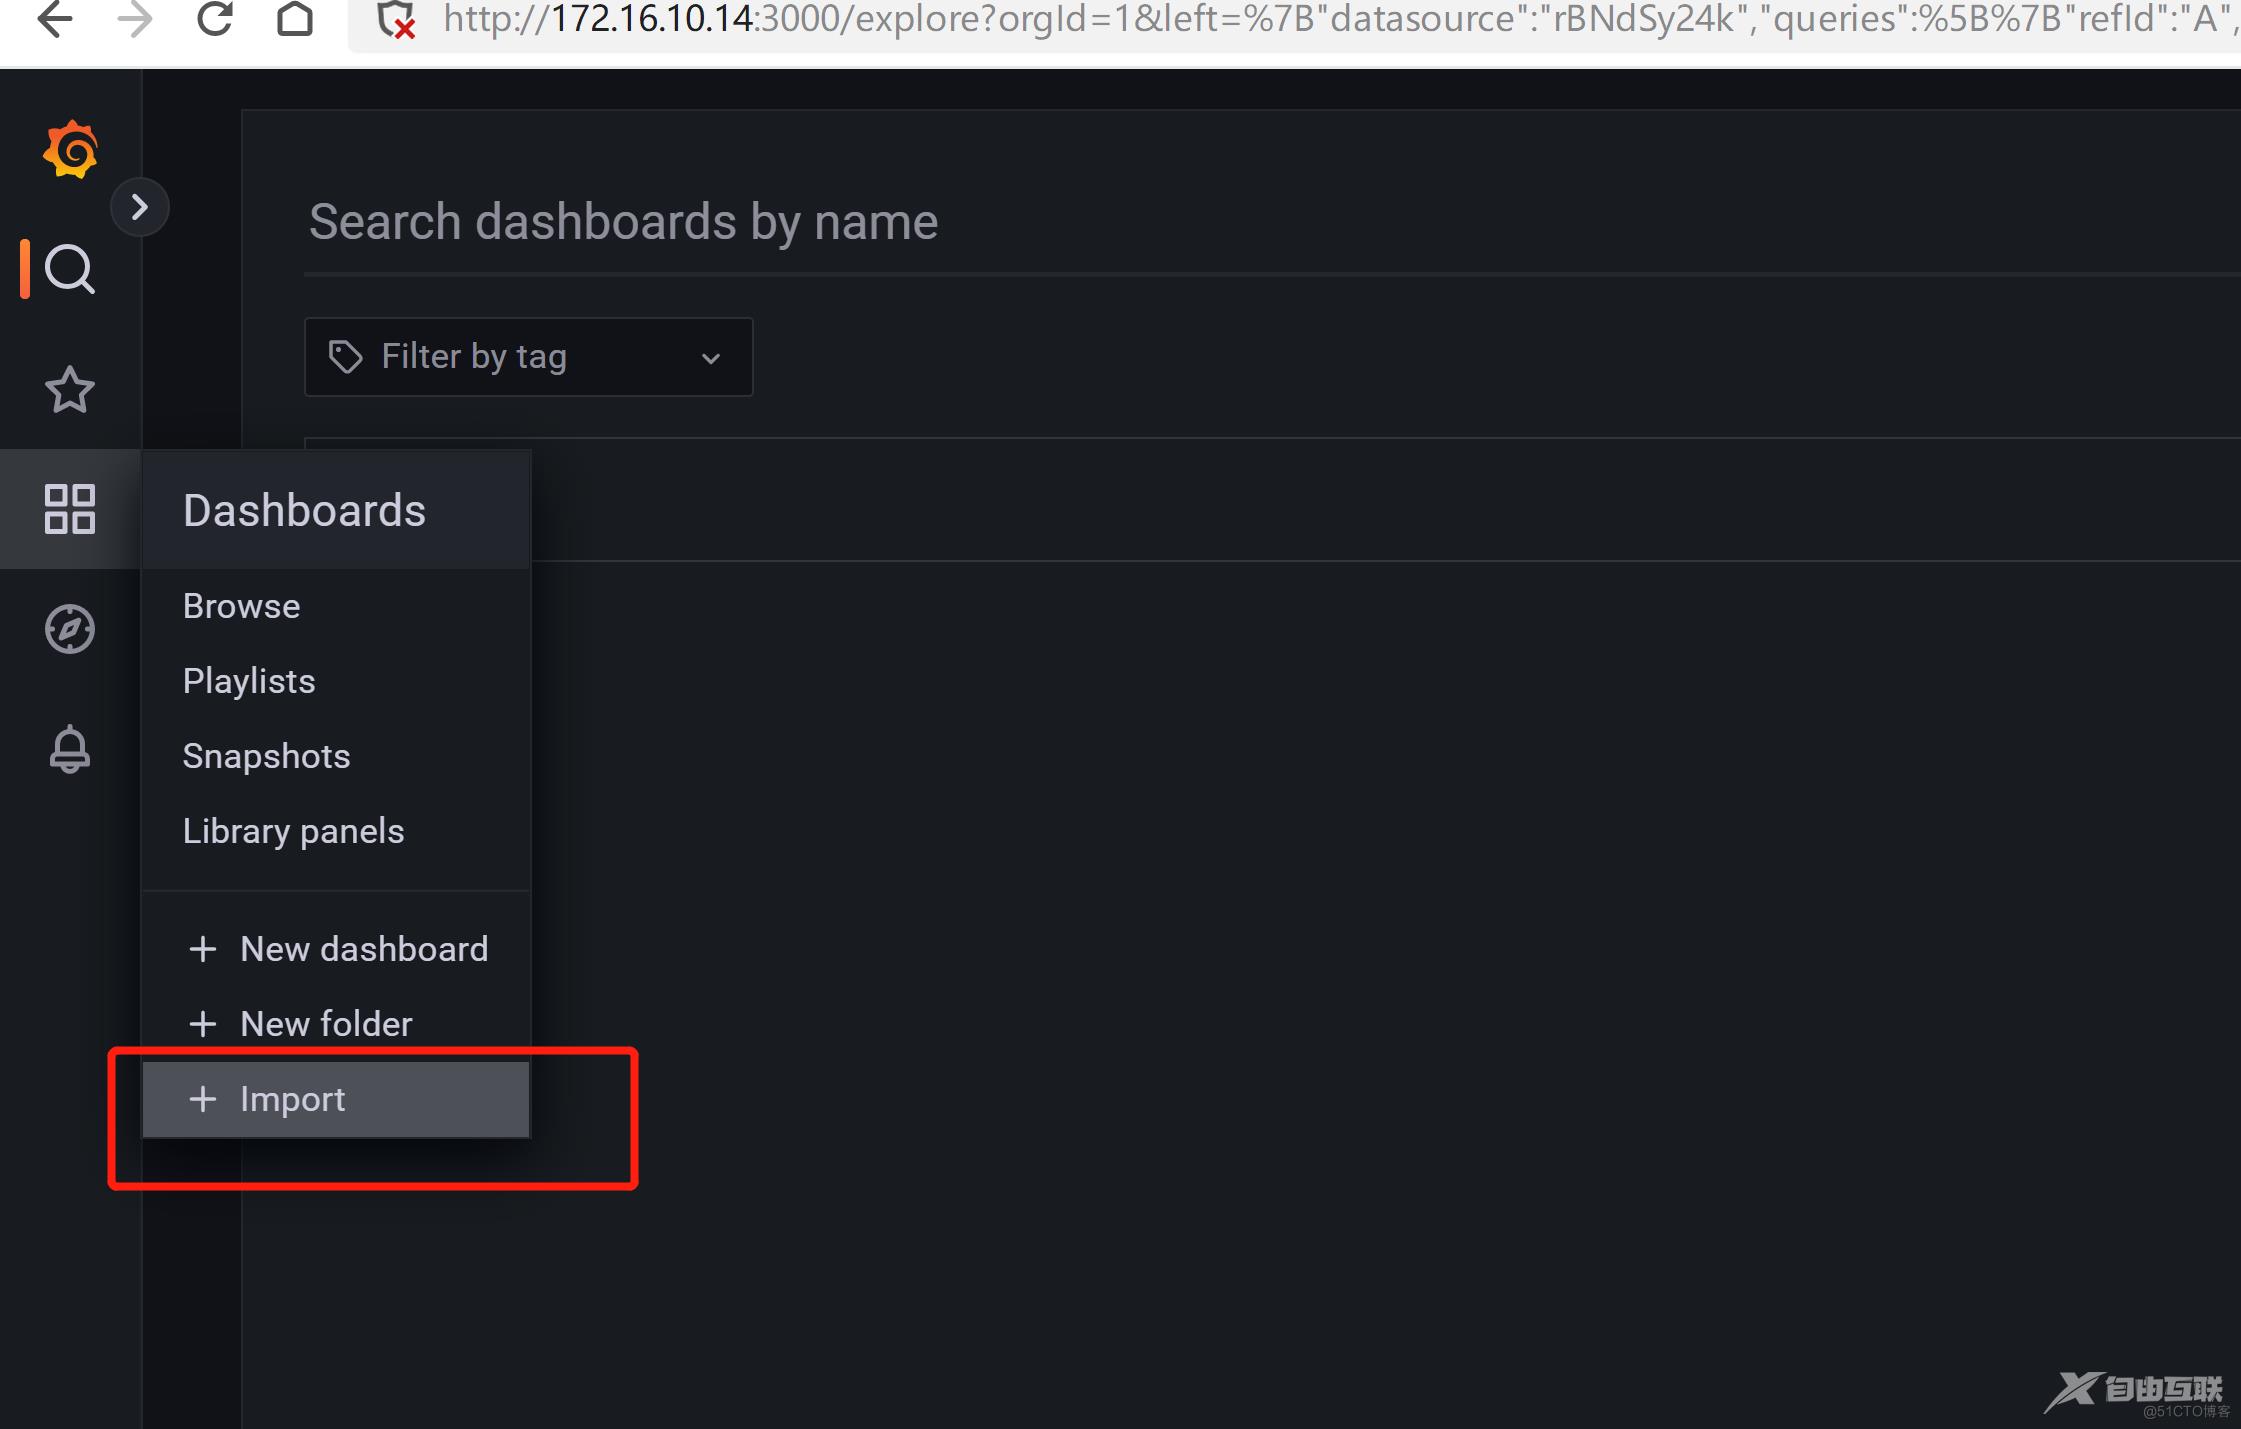
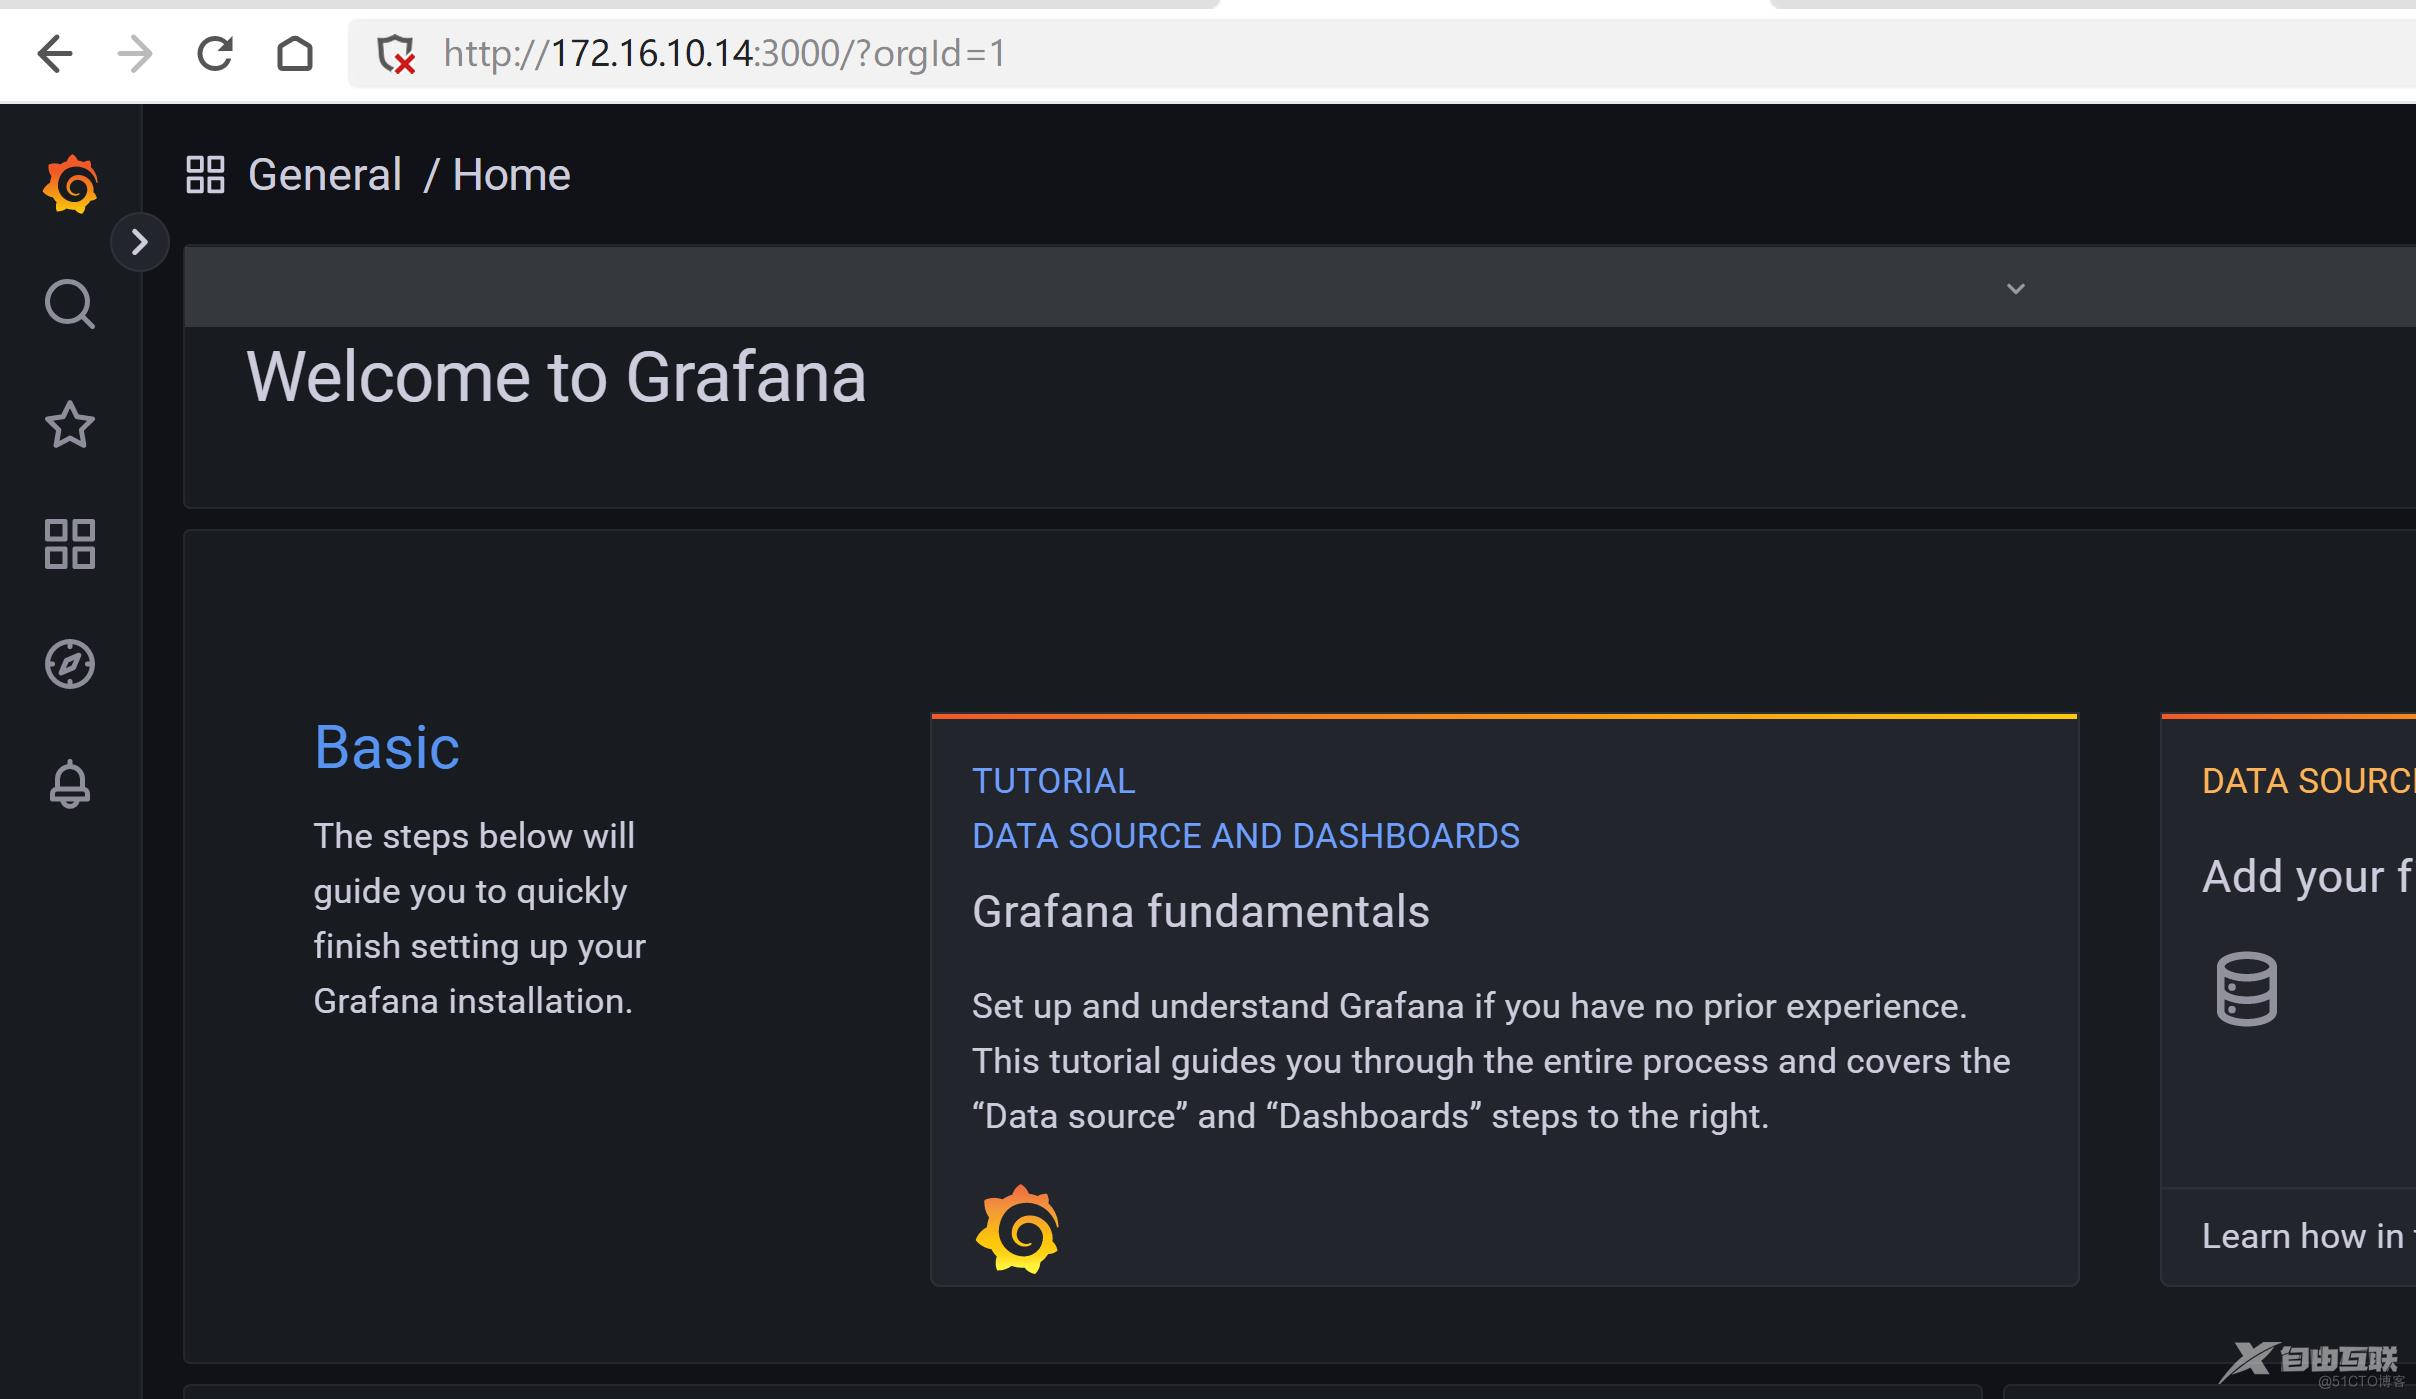
打开grafana面板

http://172.16.10.14:3000
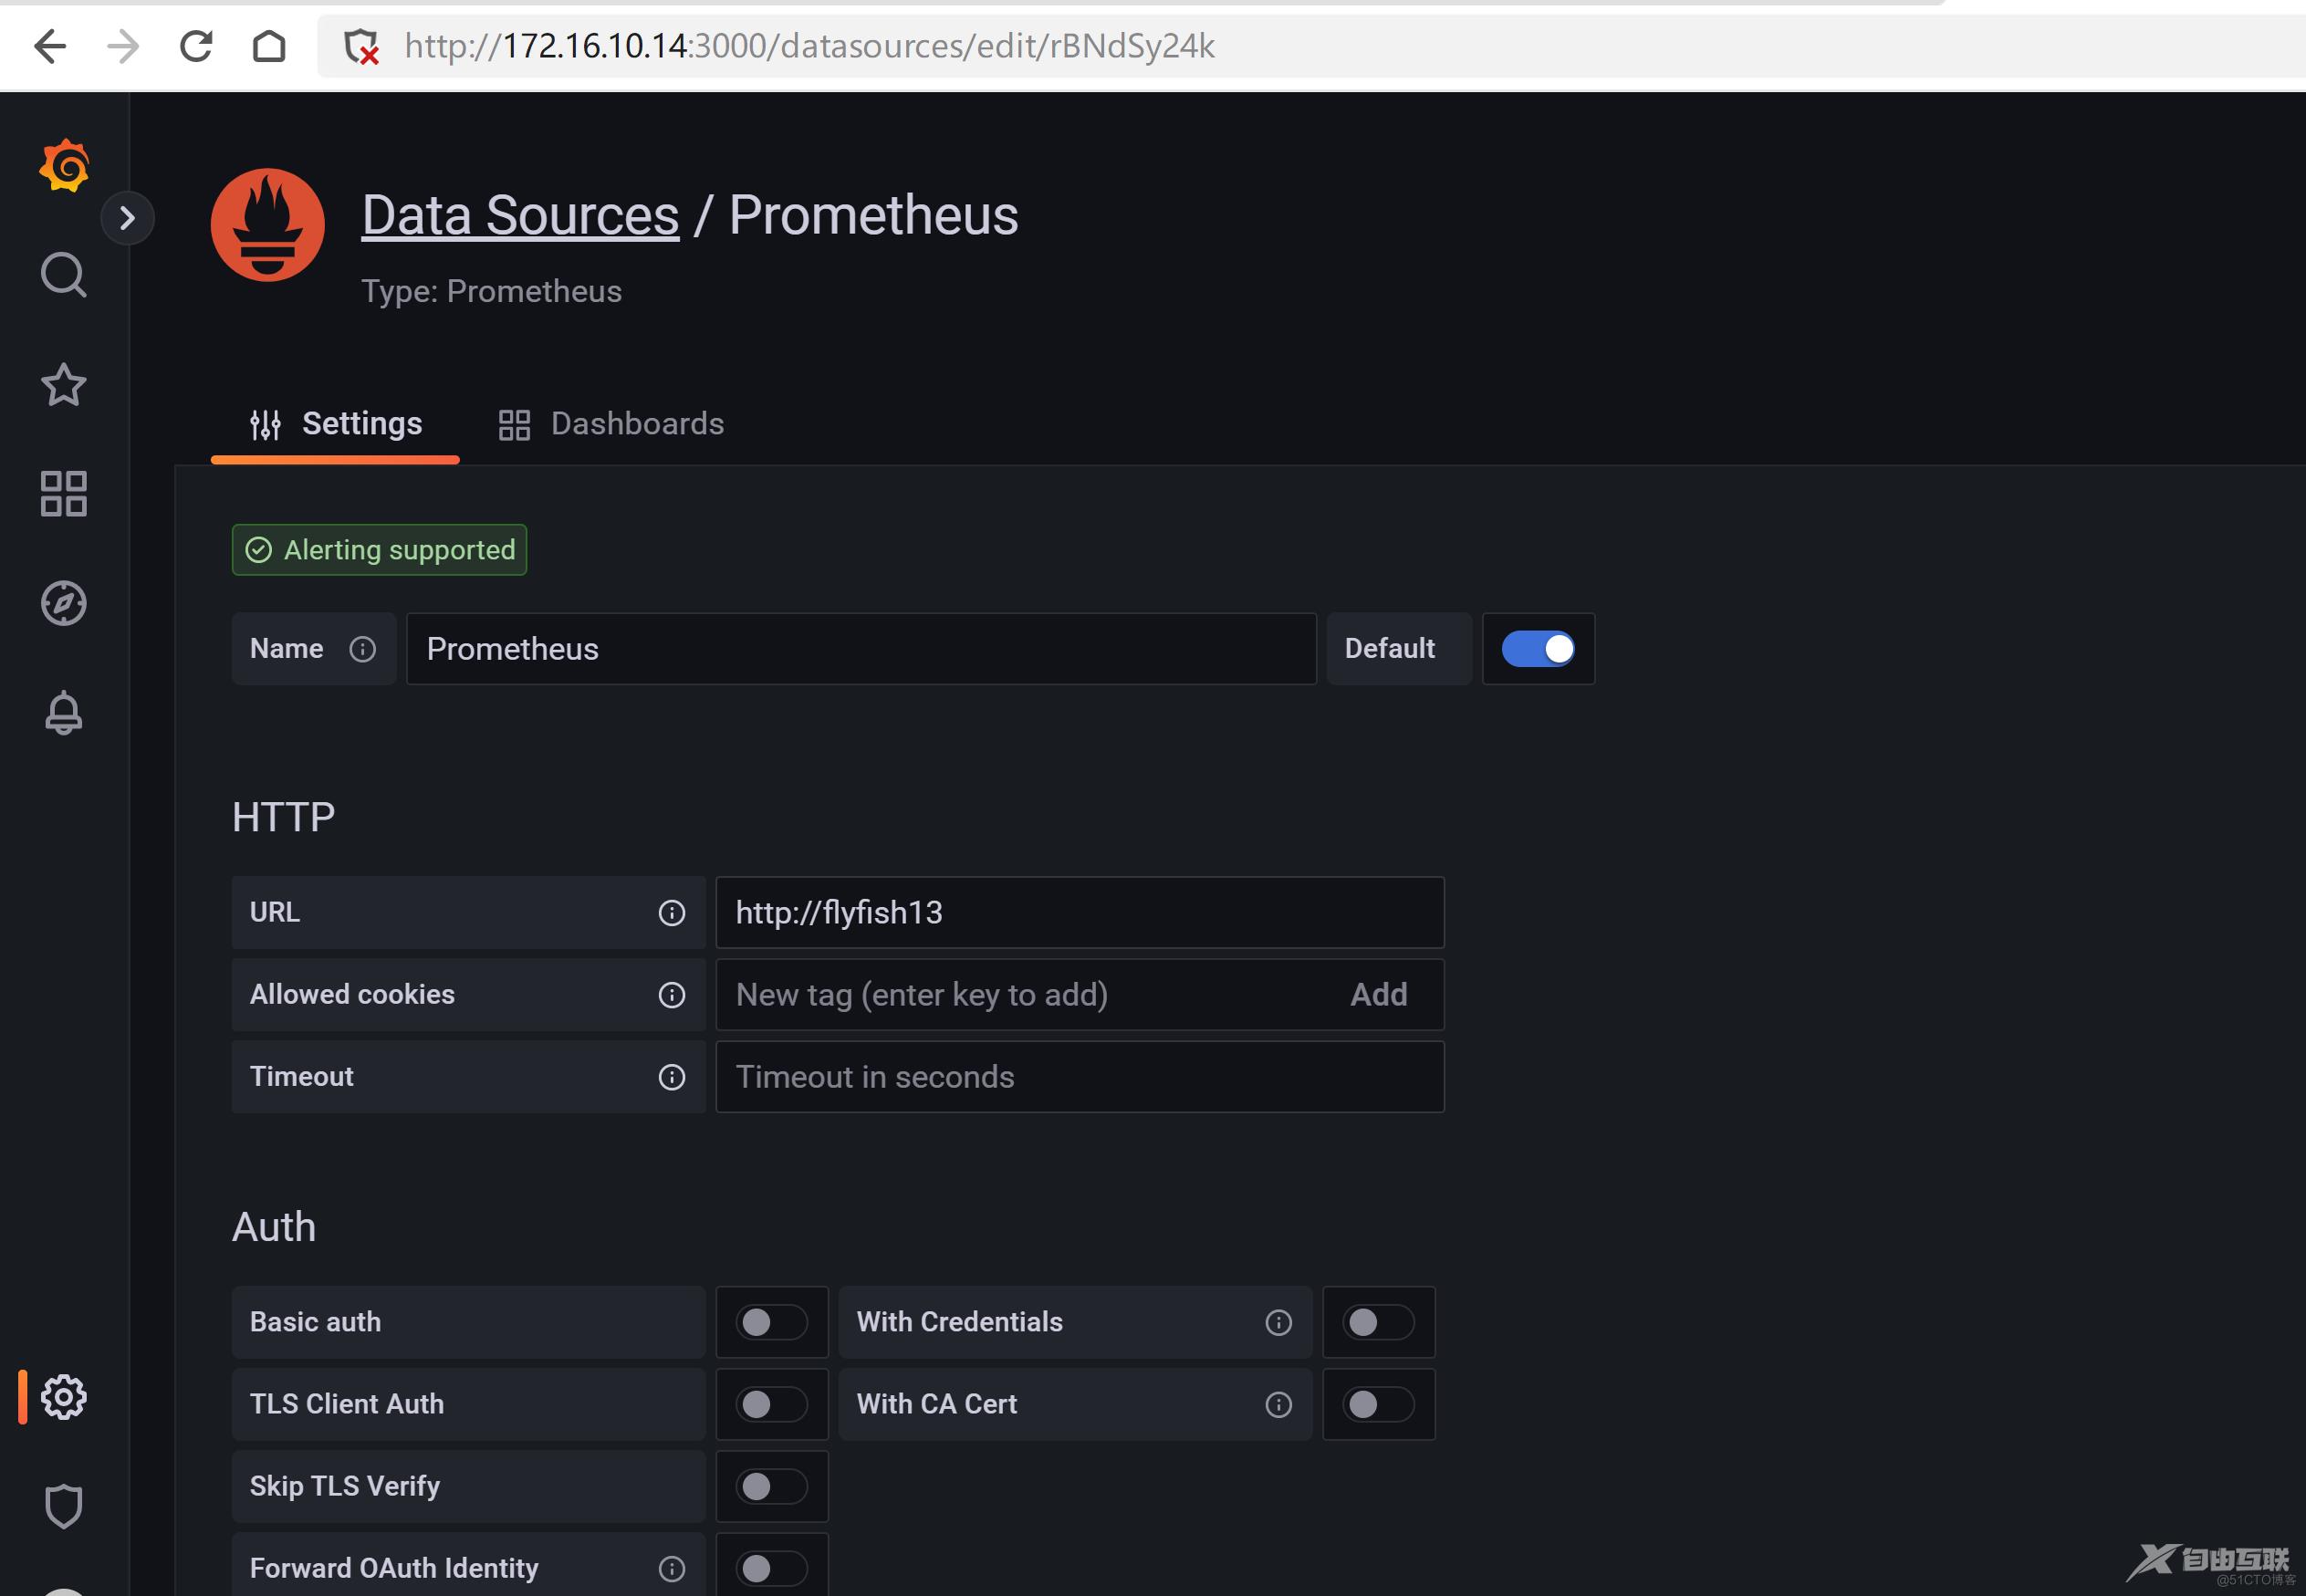
添加一个prometheus的代理
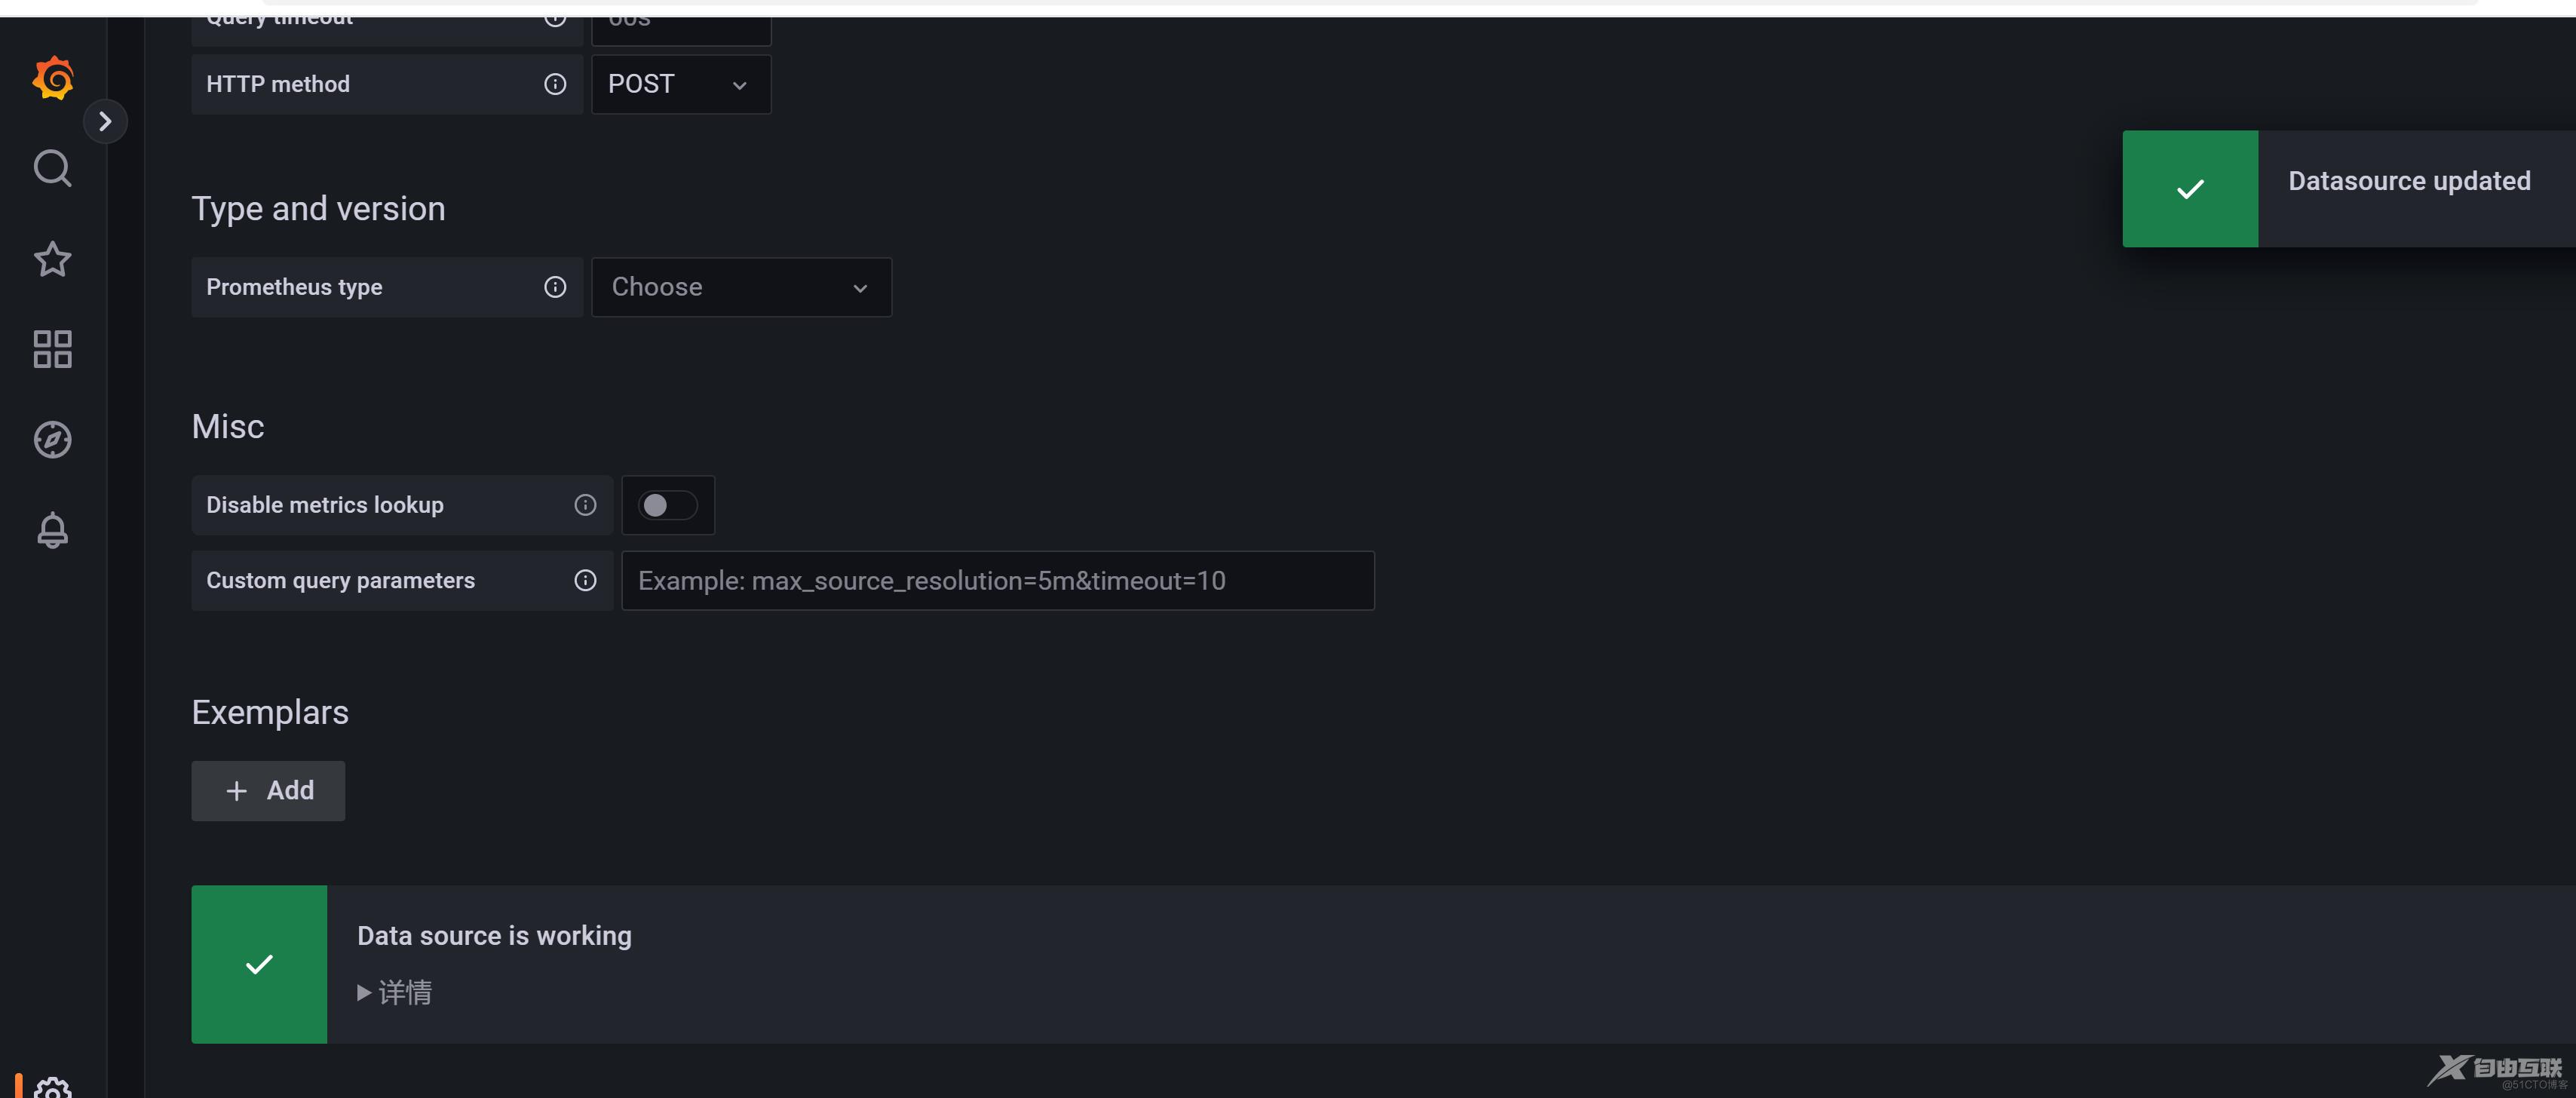
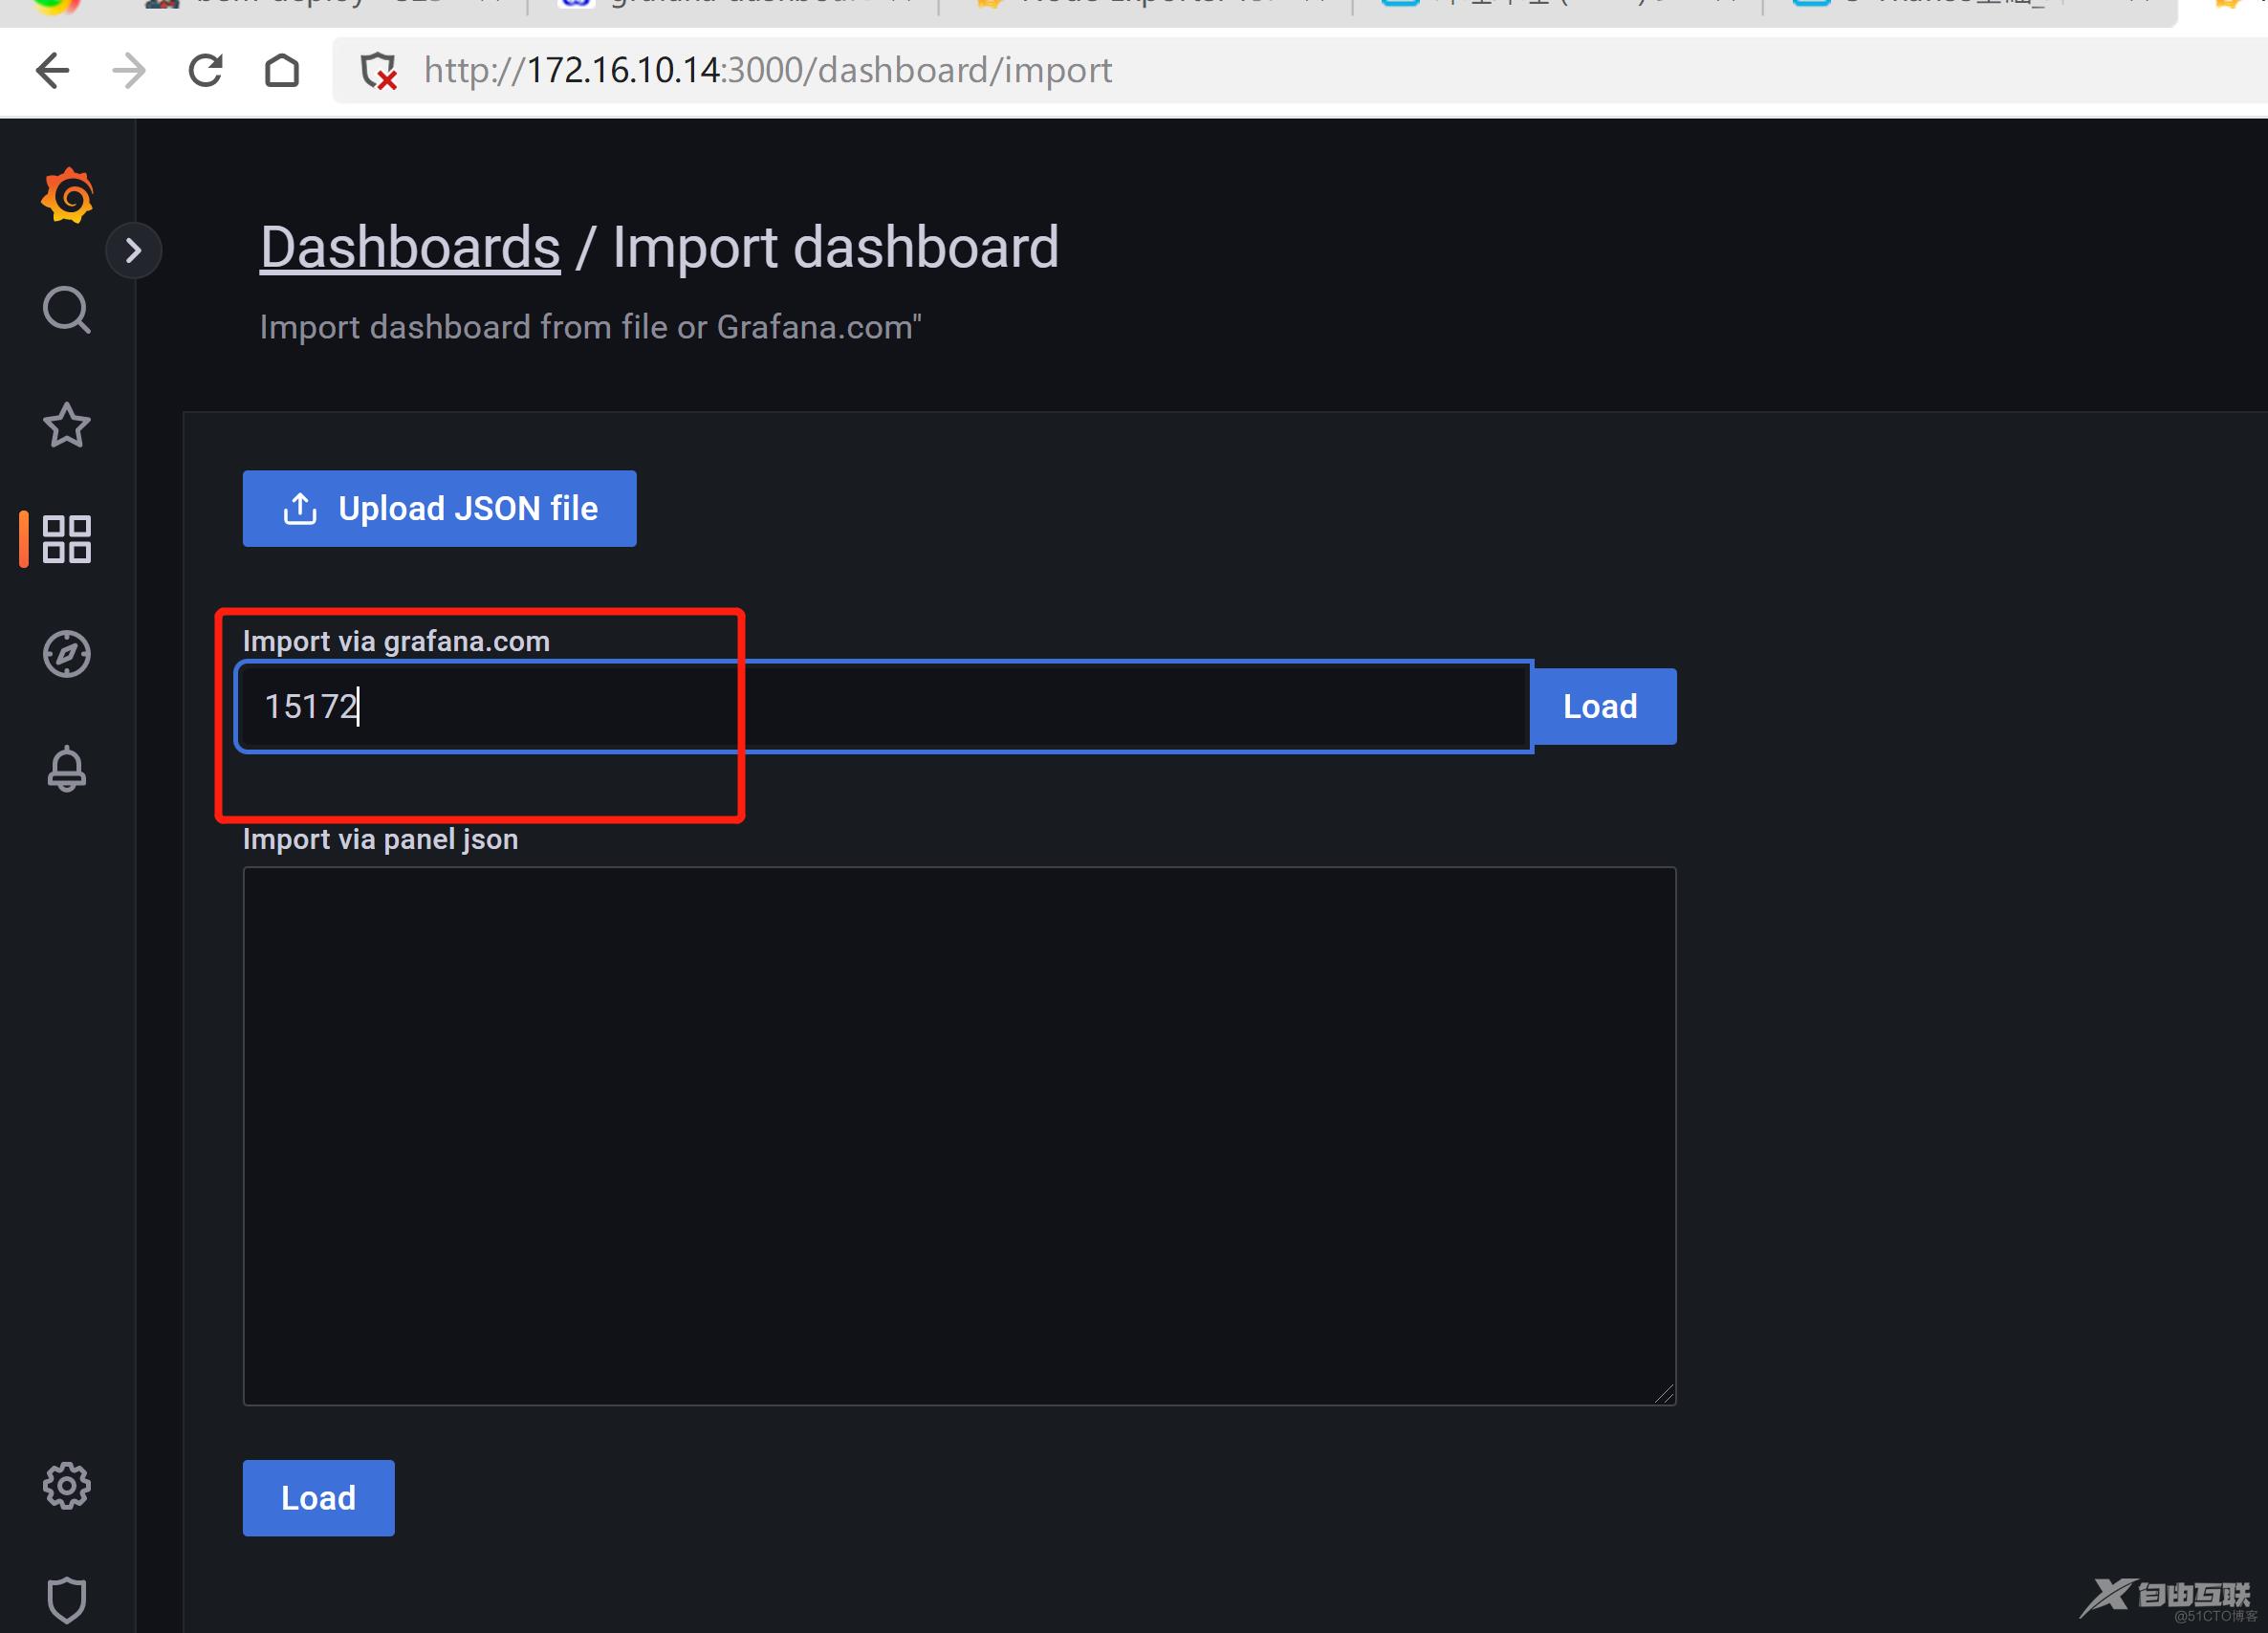
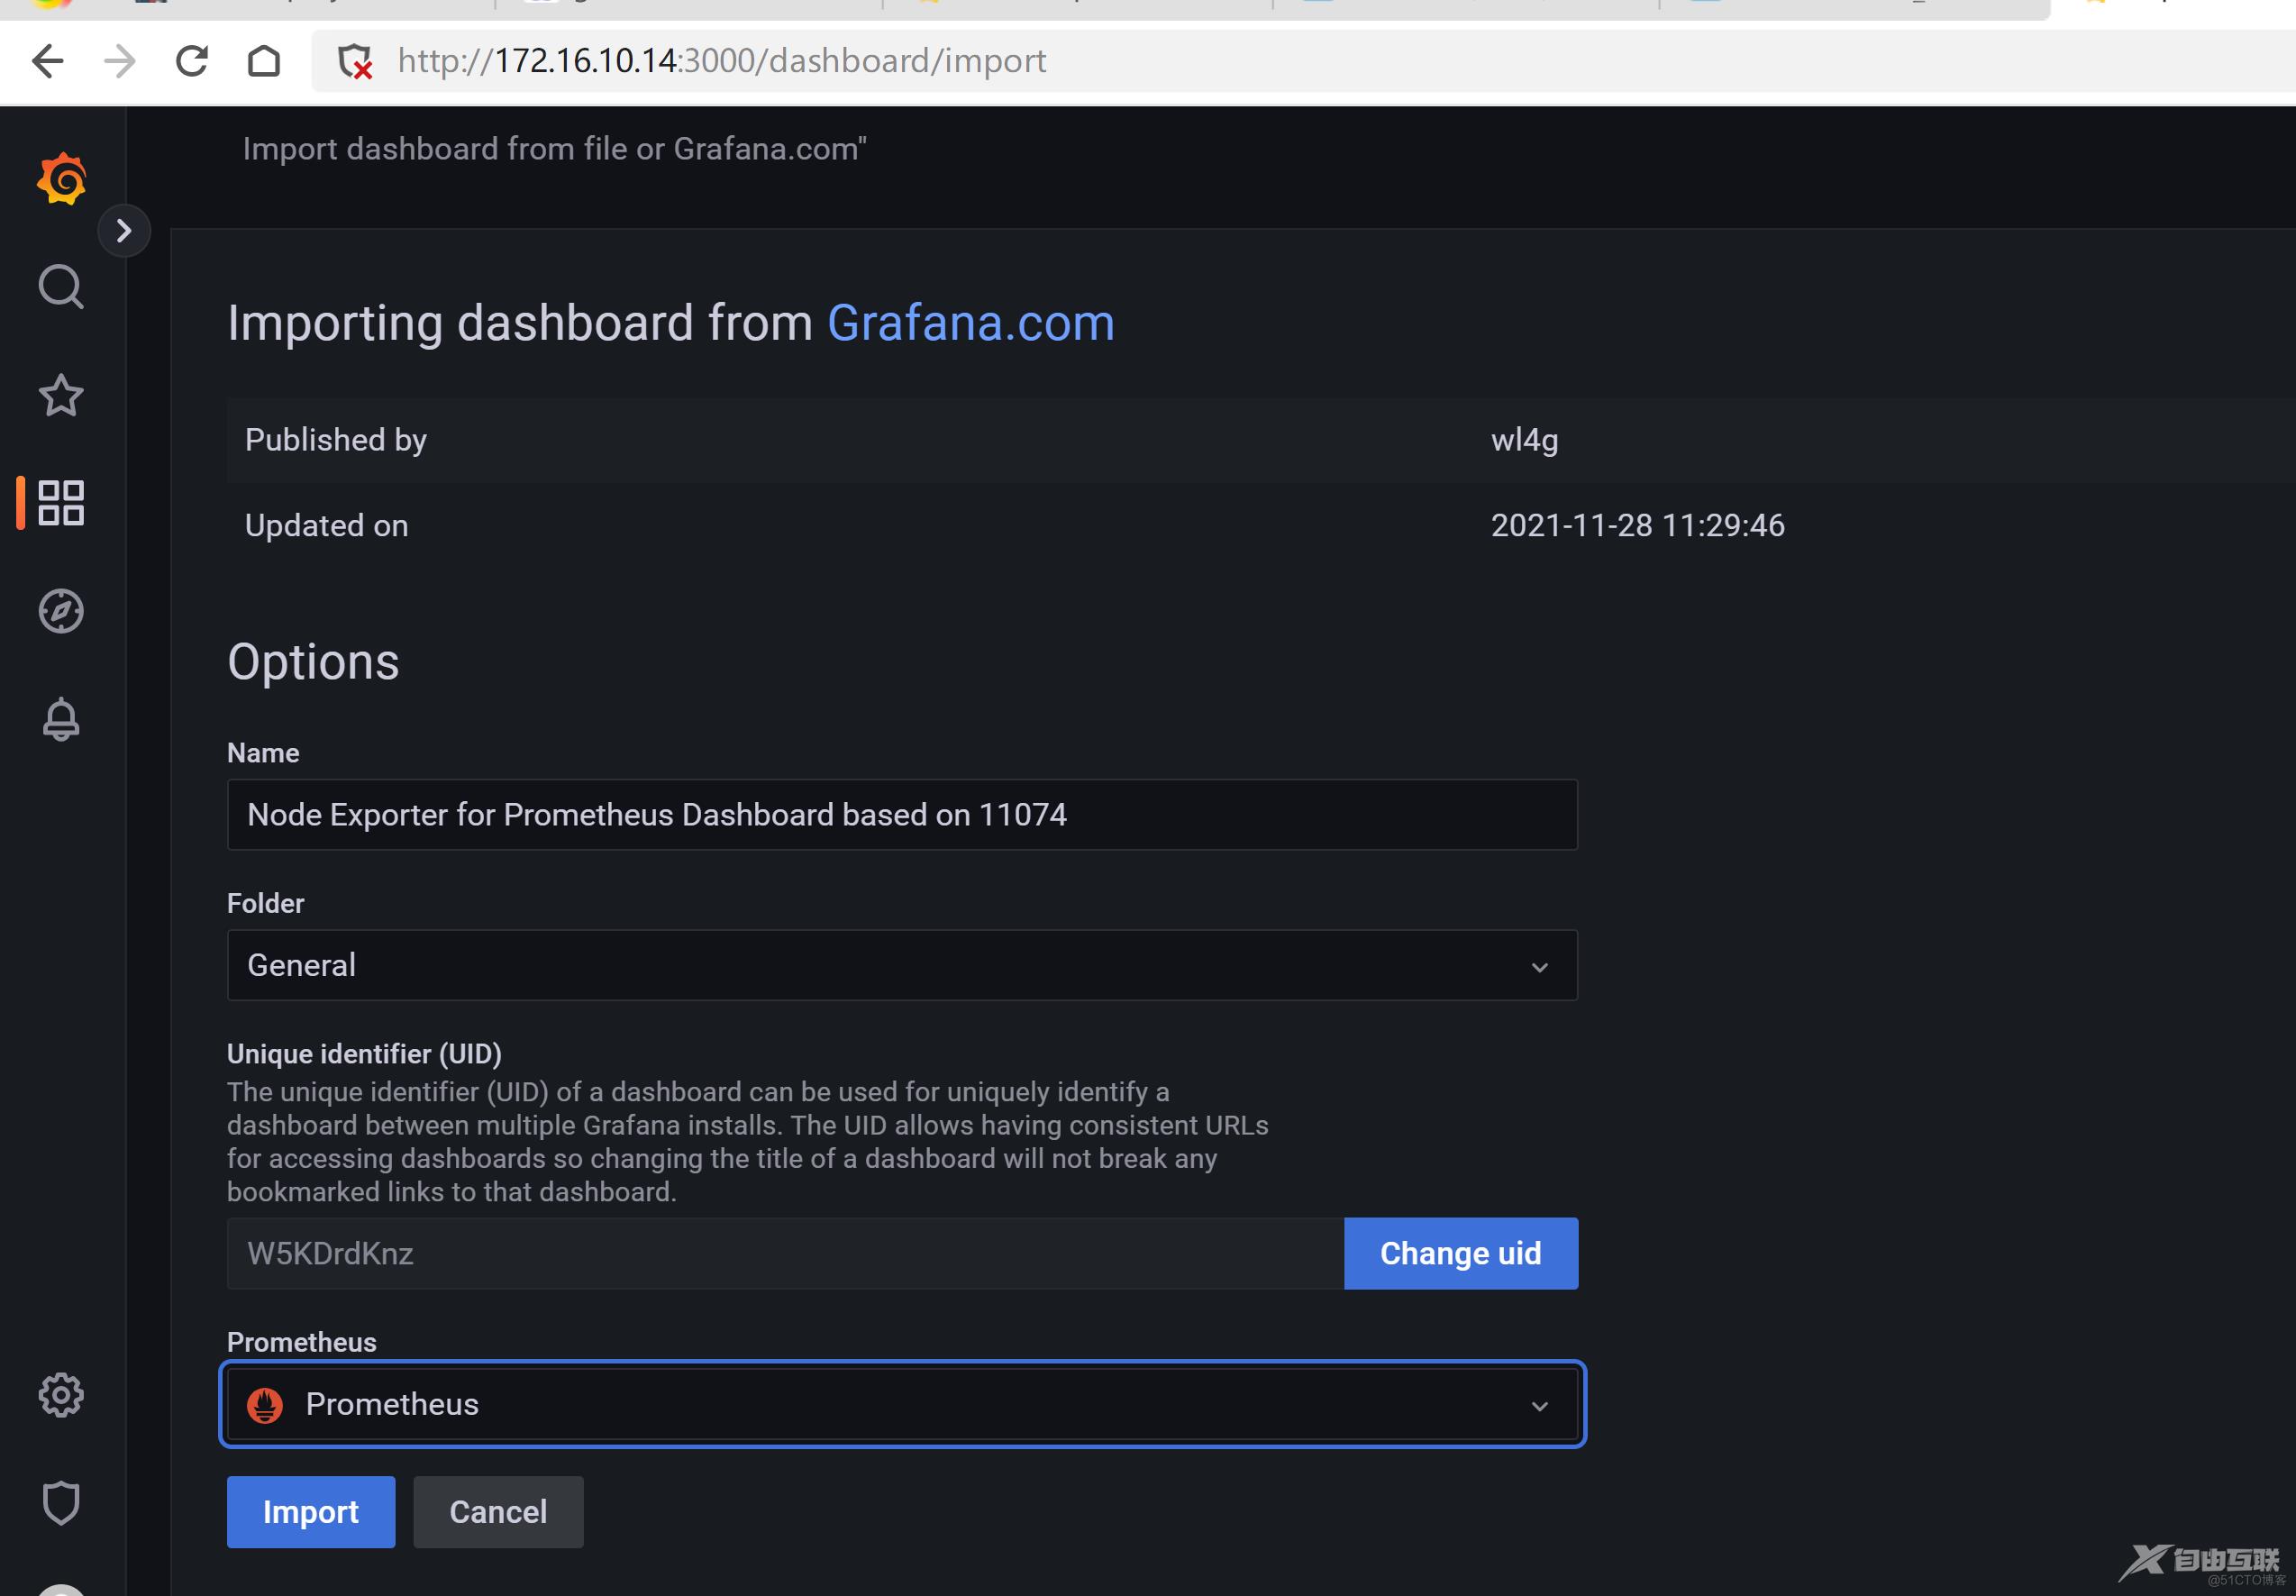
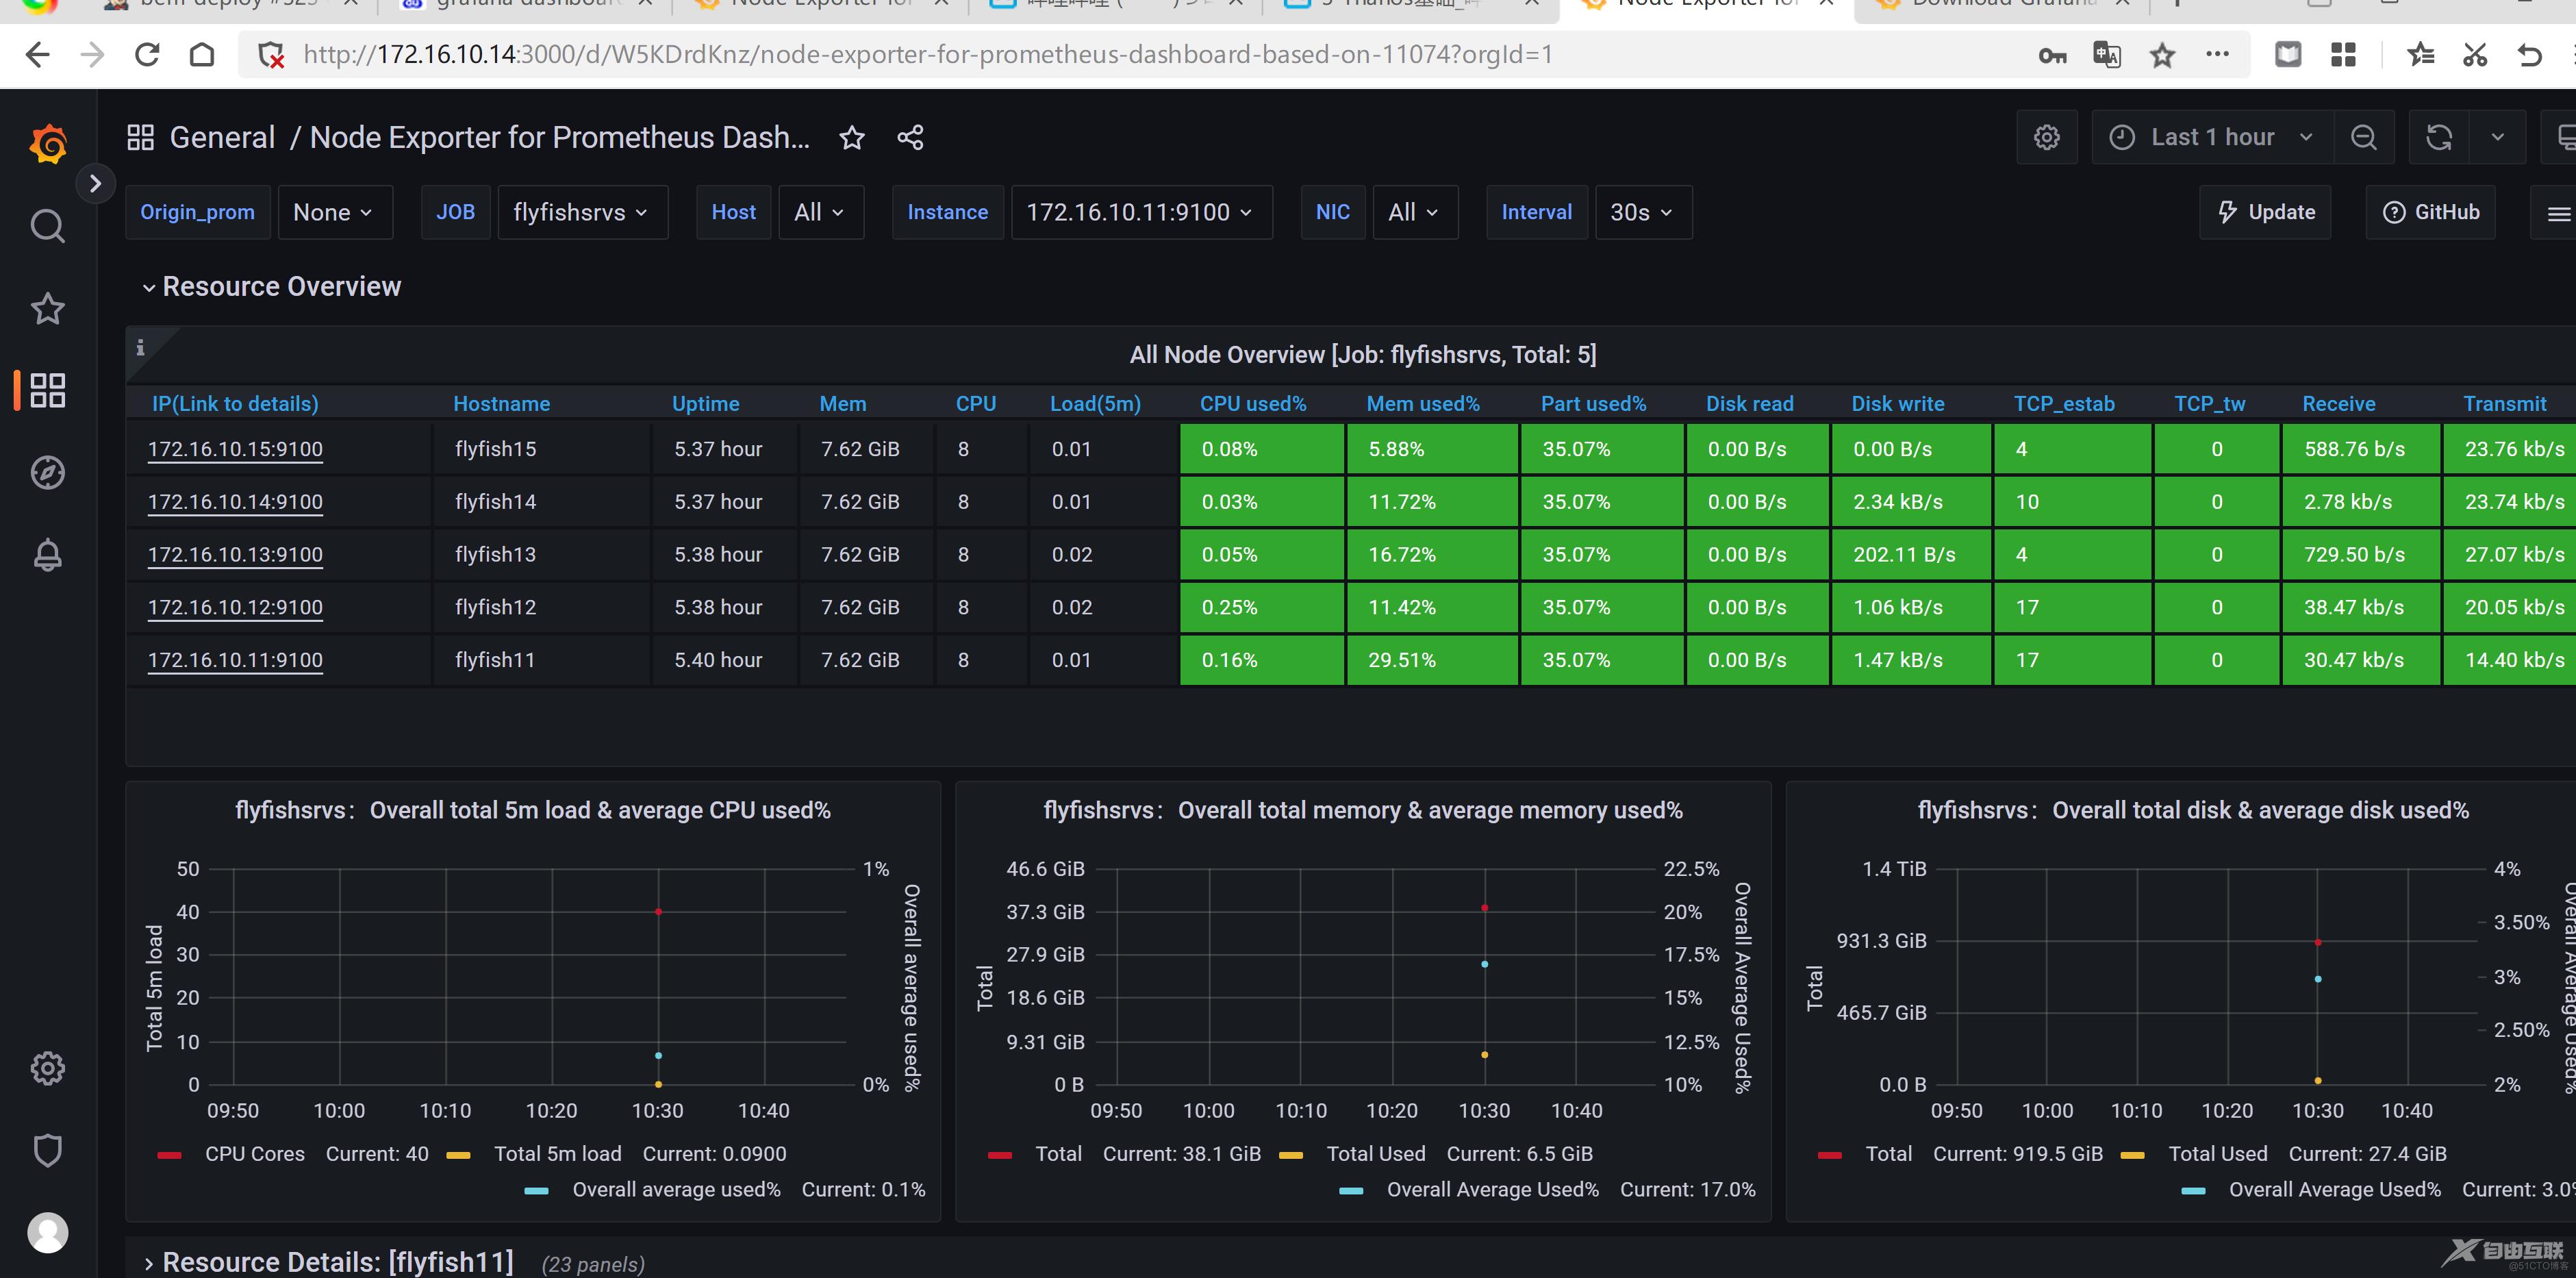
导入import 面板