文章目录 code 布局理解 result code # -*- coding: utf-8 -*- """ Created on Thu Nov 03 16:57:26 2016 @author: gsdx """ import matplotlib . pyplot as plt import numpy as np def f ( t ): return np . e
文章目录
- code
- 布局理解
- result
code
# -*- coding: utf-8 -*-"""
Created on Thu Nov 03 16:57:26 2016
@author: gsdx
"""
import matplotlib.pyplot as plt
import numpy as np
def f(t):
return np.exp(-t) * np.cos(2 * np.pi * t)
t1 = np.arange(0, 5, 0.1)
t2 = np.arange(0, 5, 0.02)
def bar_plot():
plt.subplot(321)
k = 10
x = np.arange(k)
y = np.random.rand(k)
plt.bar(x, y) # 画出 x 和 y 的柱状图
# 增加数值
for x, y in zip(x, y):
plt.text(x, y , '%.2f' % y, ha='center', va='bottom')
def scatter_plot():
plt.subplot(322)
# plt.plot(t2, np.cos(2 * np.pi * t2), 'r--')
k = 500
x = np.random.rand(k)
y = np.random.rand(k)
size = np.random.rand(k) * 50 # 生成每个点的大小
colour = np.arctan2(y, x) # 生成每个点的颜色大小
plt.scatter(x, y, s=size, c=colour)
plt.colorbar() # 添加颜色栏
# plt.figure(12)
def pie_plot():
plt.subplot(323)
# plt.plot(t1, f(t1), 'bo', t2, f(t2), 'r--')
labels = 'Frogs', 'Hogs', 'Dogs', 'Logs'
sizes = [15, 30, 45, 10]
colors = ['yellowgreen', 'gold', 'lightskyblue', 'lightcoral']
explode = (0, 0.1, 0, 0) #only "explode" the 2nd slice (i.e. 'Hogs')
plt.pie(sizes, explode=explode, labels=labels, colors=colors,
autopct='%1.1f%%', shadow=True, startangle=90)
# Set aspect ratio to be equal so that pie is drawn as a circle.
plt.axis('equal')
# plt.pause(5)
def line_plot():
plt.subplot(324)
plt.plot([1, 2, 3, 4], [1, 4, 9, 16])
def histgram_plot():
plt.subplot(313)
mu,sigma=-1,1
array_x=mu+sigma*np.random.randn(10000)
# array_x=np.random.normal(-1,1,10000)
plt.hist(array_x,bins=100,density=1)
# print(bins)
# set the title and x,y lables of the chart:
plt.title('Histogram of normal attributions')
plt.xlabel('x')
plt.ylabel('y')
plt.text(0,0, r'$\mu=-1,\ \sigma=1$')
""" Convenience method to get or set axis properties. """
#if you not specify the axis ,then the chart axes will auto adjust to display properly!
# plt.axis([-10,10,0,1])
''' set if you want to display the grid: '''
plt.grid(True)
bar_plot()
scatter_plot()
pie_plot()
line_plot()
histgram_plot()
plt.show()
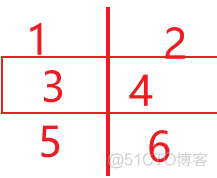
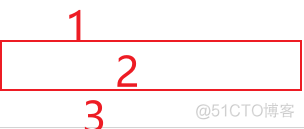
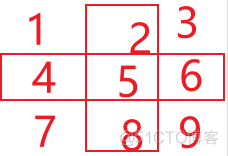
布局理解
代码中的划分及区块编号

又比如:
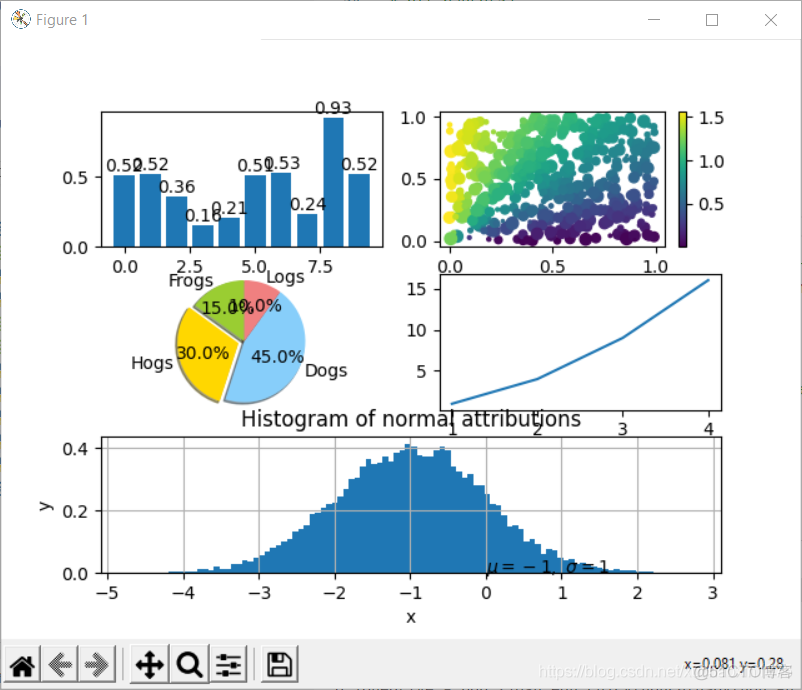
result

