import matplotlib . pyplot as plt import numpy as np 图例的展示样式调整 def no1 (): """ 图例的展示样式调整 :return: """ x = np . arange ( 0 , 2.1 , 0.1 ) y = np . power ( x , 3 ) y1 = np . power ( x , 2 ) y2 = np . power (
import numpy as np

"""
图例的展示样式调整
:return:
"""
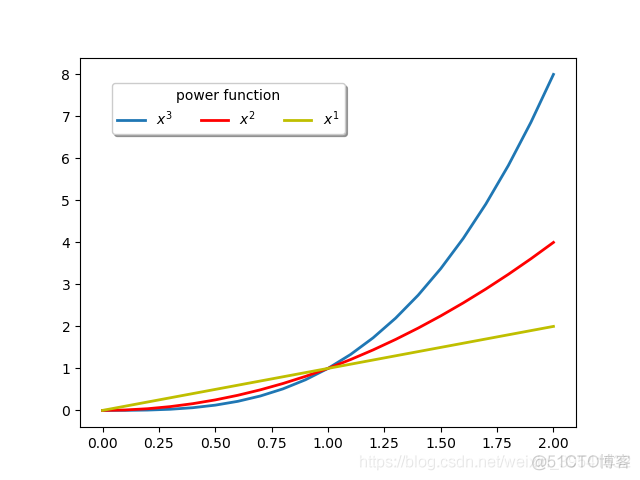
x = np.arange(0, 2.1, 0.1)
y = np.power(x, 3)
y1 = np.power(x, 2)
y2 = np.power(x, 1)
plt.plot(x, y, ls='-', lw=2, label="$x^{3}$")
plt.plot(x, y1, ls='-', lw=2, c='r', label="$x^{2}$")
plt.plot(x, y2, ls='-', lw=2, c='y', label="$x^{1}$")
# loc: 位置参数(使用字符串或者数字均可)
# bbox_to_anchor: 线框位置参数
# 图例标签内容的标题参数title
# 线框阴影shadow和线框圆角处理参数fancybox等
# bbox_to_anchor: (距离画布左侧的x倍长度的倍数的距离,距离画布底部的y轴长度的倍数,x轴长度的倍数的线框的长度,x
# 轴长度的倍数的线框的长度)
# fancybox: 圆角或者直角
# shadow: 控制线框是否添加阴影
plt.legend(loc="upper left", bbox_to_anchor=(0.05, 0.95), ncol=3,
title="power function", shadow=True, fancybox=True)
plt.savefig(r"E:\Programmer\PYTHON\Matplotlib实践\figure\Figure(Unit "
r"4)\no1.png")
plt.show()

"""
标题的展示样式调整
:return:
"""
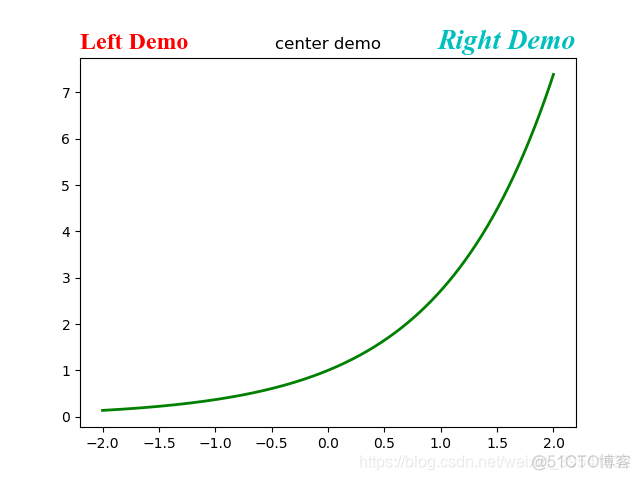
x = np.linspace(-2, 2, 1000)
y = np.exp(x)
plt.plot(x, y, ls='-', lw=2, color='g')
plt.title('center demo')
plt.title('Left Demo', loc='left', fontdict={'size': "xx-large",
'color': 'r',
"family": 'Times New Roman'})
plt.title(
'Right Demo',
loc='right',
fontdict={
'size': 20,
'style': 'oblique',
'color': 'c',
"family": 'Times New Roman'})
plt.savefig(r"E:\Programmer\PYTHON\Matplotlib实践\figure\Figure(Unit "
r"4)\no2.png")
plt.show()

"""
调整刻度范围和刻度标签的方法
:return:
"""
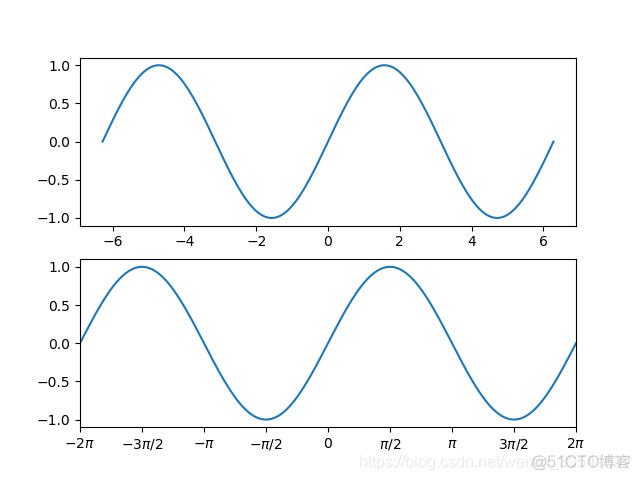
x = np.linspace(-2 * np.pi, 2 * np.pi, 200)
y = np.sin(x)
# 在2行1列区域绘制图形1
plt.subplot(211)
plt.plot(x, y)
plt.subplot(212)
# 将xlim中的两数交换顺序,即可得到x逆序结果图像
plt.xlim(-2 * np.pi, 2 * np.pi)
plt.xticks([-2 * np.pi, -3 * (np.pi) / 2, -1 * np.pi, -1 * (np.pi) / 2, 0, (np.pi) / 2,
np.pi, 3 * np.pi / 2, 2 * np.pi], [r"$-2\pi$", r"$-3\pi/2$", r"$-\pi$",
r"$-\pi/2$", r"$0$", r"$\pi/2$",
r"$\pi$", r"$3\pi/2$", r"$2\pi$"])
plt.plot(x, y)
plt.savefig(r"E:\Programmer\PYTHON\Matplotlib实践\figure\Figure(Unit "
r"4)\no3.png")
plt.show()

"""
向统计图中添加表格
:return:
"""
mpl.rcParams["font.sans-serif"] = ["SimHei"]
mpl.rcParams["axes.unicode_minus"] = False
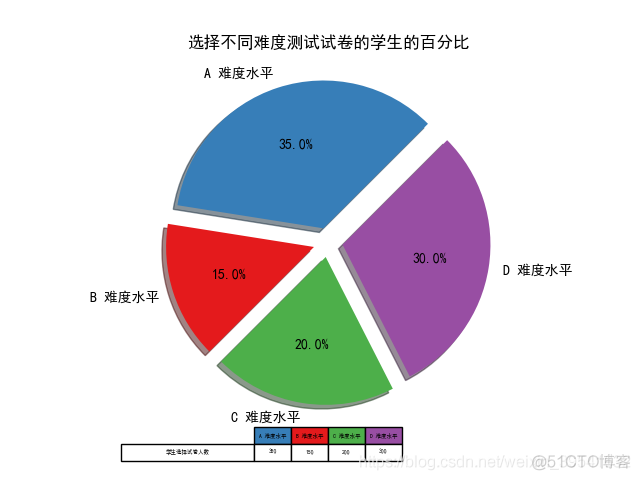
labels = 'A 难度水平', 'B 难度水平', 'C 难度水平', 'D 难度水平'
students = [0.35, 0.15, 0.20, 0.30]
explode = (0.1, 0.1, 0.1, 0.1)
colors = ['#377eb8', '#e41a1c', '#4daf4a', '#984ea3']
plt.pie(students, labels=labels, explode=explode, autopct="%1.1f%%",
startangle=45, colors=colors, shadow=True)
plt.title('选择不同难度测试试卷的学生的百分比')
colLabels = ['A 难度水平', 'B 难度水平', 'C 难度水平', 'D 难度水平']
rowLabels = ['学生选择试卷人数']
studentValues = [[350, 150, 200, 300]]
colColors = ["#377eb8", "#e41a1c", "#4daf4a", "#984ea3"]
plt.table(cellText=studentValues,
cellLoc="center",
colWidths=[0.1] * 4,
colLabels=colLabels,
colColours=colColors,
rowLabels=rowLabels,
rowLoc="center",
loc="bottom")
plt.savefig(r"E:\Programmer\PYTHON\Matplotlib实践\figure\Figure(Unit "
r"4)\no4.png")
plt.show()
- 本篇博文特别感谢刘大成的《Python数据可视化之matplotlib实践》
